
Numerical Simulation Study of Vibration Characteristics of Cantilever Traffic Signal Support Structure under Wind Environment
2023-01-22 09:01MengZhangZhichaoZhouGuifengZhaoandFangfangWang
Meng Zhang,Zhichao Zhou,Guifeng Zhao,★and Fangfang Wang
1School of Civil Engineering,Zhengzhou University,Zhengzhou,450001,China
2Henan Vocational College of Mechanical and Electrical,Zhengzhou,451192,China
ABSTRACT Computational fluid dynamics(CFD)and the finite element method(FEM)are used to investigate the wind-driven dynamic response of cantilever traffic signal support structures as a whole.By building a finite element model with the same scale as the actual structure and performing modal analysis,a preliminary understanding of the dynamic properties of the structure is obtained.Based on the two-way fluid-structure coupling calculation method, the wind vibration response of the structure under different incoming flow conditions is calculated,and the vibration characteristics of the structure are analyzed through the displacement time course data of the structure in the crosswind direction and along-wind direction.The results show that the maximum response of the structure increases gradually with the increase of wind speed under 90°wind direction angle,showing a vibration dispersion state,and the vibration response characteristics are following the vibration phenomenon of galloping;under 270°wind direction angle, the maximum displacement response of the structure occurs at the lower wind speed of 5 and 6 m/s,and the vibration generated by the structure is vortex vibration at this time;the displacement response of the structure in along-wind direction increases with the increase of wind speed.The along-wind displacement response of the structure will increase with increasing wind speed,and the effective wind area and shape characteristics of the structure will also affect the vibration response of the structure.
KEYWORDS Signal structure;modal analysis;wind-induced vibration;two-way fluid-structure interaction;numerical simulation
1 Introduction
With the rapid development of road construction,the development of various supporting facilities on the road has also entered a rapid development stage simultaneously.As the main support structure of the light pole,its reliability directly affects the traffic safety of the road.Cantilever traffic signals are a class of cantilevered flexible structures because their length and thickness are relatively large,so wind loads are particularly sensitive.Many scholars have started to study such structures because the dynamic effect of wind load has a continuous effect during the service life of the structure.Hong et al.[1]evaluated the statistics of the stress range and the fatigue reliability of the structure under the action of natural wind gusts for some support structures suitable to be represented by simplified structures.Christenson et al.[2] proposed the signal head vibration absorber (SHVA) to verify the ability to reduce wind-induced vibration in traffic signal support structures.Wieghaus et al.[3] proposed a low-cost damage avoidance approach to mitigate the fatigue effects of wind on cantilevered traffic signal support structures.Demello et al.[4]proposed to experimentally verify the existence of signal light aerodynamic shielding effects to quantify the effect of such effects on wind loads.Choi et al.[5]evaluated the fatigue performance of signal sign support structure bases with stiffened ribs based on reliability.Puckett et al.[6] performed 16 fatigue tests on 12 cantilevered traffic signal arm-pole connections with circular stiffeners to quantify the fatigue strength.The research results of these scholars provide insight into existing signal structures in all directions that need attention in their service life.In ongoing research,guidance is provided for the design and maintenance of the structure.
Currently,the research methods for cantilever traffic signal structures are mainly based on field measurements and wind tunnel tests.Ding et al.[7] observed the wind vibration characteristics of traffic signal structures through long-term,comprehensive measurements as a basis for understanding the vibration generation mechanism of the structures.Chen et al.[8] proposed a statistical method to predict the fatigue life of cantilever traffic signal structures based on the strain data measured in the field.Zuo et al.[9]investigated the role of signal light cantilever pole in aeroelastic vibration by field measurements of cantilevered traffic signal support structures.Cruzado et al.[10,11]conducted field measurements and wind tunnel tests on cantilevered traffic signal structures.Pulipaka et al.[12]overturned the assertion that wind tunnel tests conducted on a quarter scale show that galloping is the main cause of structural vibration.From the above mentioned studies,it can be understood that the wind vibration characteristics of cantilever traffic signal structures under natural wind environments and the mechanical properties of the structures when subjected to ambient wind can be more accurately counted by field measurements.However,field measurements require a long period of monitoring,and random factors such as extreme weather and equipment stability can also lead to the unavailability of the measured data.The wind tunnel test can be adjusted continuously to get close to the real wind conditions,and the experimental results can be obtained easily and quickly.However,the experimental object of the wind tunnel test is often a scaled-down model,and the accuracy of the structural model cannot be fully guaranteed.
Numerical simulation technology, as a means of experimental research in the computer age, is now receiving increasing attention and research.In many engineering fields, numerical simulation technology has been more widely used due to its advantages, such as high efficiency and accuracy.In high-rise buildings, Zhang et al.[13] used the technique of non-constant CFD to predict windinduced vibration of high-rise buildings;Chen et al.[14]studied the amplification effect of wind load and wind speed on high-rise buildings with cavities;Lu et al.[15]analyzed the wind vibration response of Taipei 101 building based on large eddy simulation.In bridge structures, Sangalli et al.[16] used a fluid-structure coupling model to numerically simulate the chattering of bridges;Li et al.[17]used numerical simulations and wind tunnel tests to analyze the phenomenon of boom vortex vibration under the wake flow of bridge towers.In terms of structures,Castellani et al.[18],Chizfahm et al.[19],and Li et al.[20]conducted numerical simulation studies on a horizontal axis micro wind turbine,a bladeless wind turbine,and a wind turbine with a damper,respectively.Belver et al.[21]conducted wind vibration simulation studies on a 183 m industrial chimney,Wang et al.[22]on a high-rise thin-walled tower,and Zou et al.[23]on a very large natural ventilation cooling tower.In practical engineering,numerical simulation techniques have been applied to various types of structures.For cantilevered traffic signal structures,numerical simulation techniques have also started to be used initially.In the field of wind energy utilization, Wang et al.[24,25] considered changing the bluff body shapes to enhance the harvesting performance of the wind energy harvester.Jafari et al.[26] investigated the wind excitation of cantilevered traffic signal structures by a time-domain-based numerical simulation method.In this method, the cross-wind response of the structure is still mainly observed by wind tunnel tests through the wind speed generated by numerical simulation techniques,and this method does not fully reflect the advantages of numerical simulation techniques.
The purpose of this paper is to evaluate the wind vibration response of a cantilever traffic signal structure in a city using numerical simulation techniques.The validity of the structural modeling is demonstrated by establishing a numerical model of equal scale with the actual model and undergoing modal analysis and by comparing the modal analysis results with the actual structure.Then, a turbulence model close to the actual wind field is established, and finally, the structural response of the cantilevered traffic signal structure is analyzed in the cross-wind and along-wind directions based on the two-way fluid-solid coupling method.
2 Structure Modeling and Dynamics Analysis
2.1 Model Setting
The cantilever traffic signal structure is geometrically modeled according to a field structure,and the model dimensions are shown in Fig.1.The cross-sectional geometric parameters of the structure are shown in Table 1,and for the material properties of the structure,we used the following:the main material of the cantilever pole and the vertical pole is Q235 steel.Steel densityρ=7850 kg/m3,elastic modulusE=2.06×10¹¹Pa,Poisson’s ratioν=0.3.The specific signal data information is shown in Table 2.
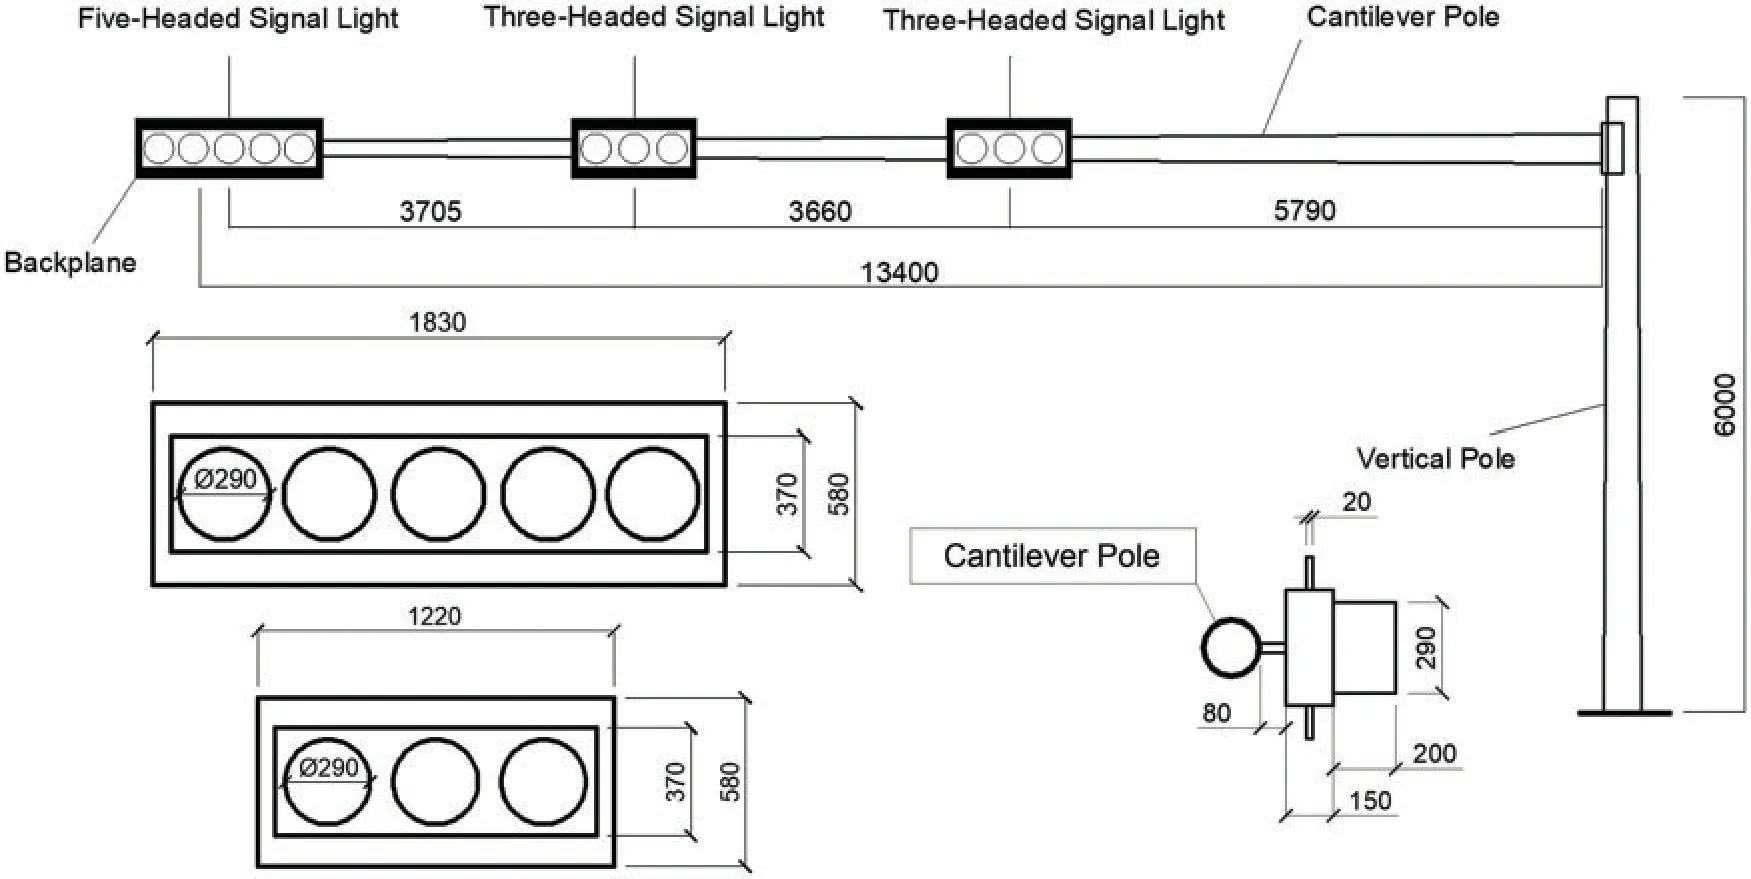
Figure 1:Dimensional drawing of the structural geometry model(unit:mm)
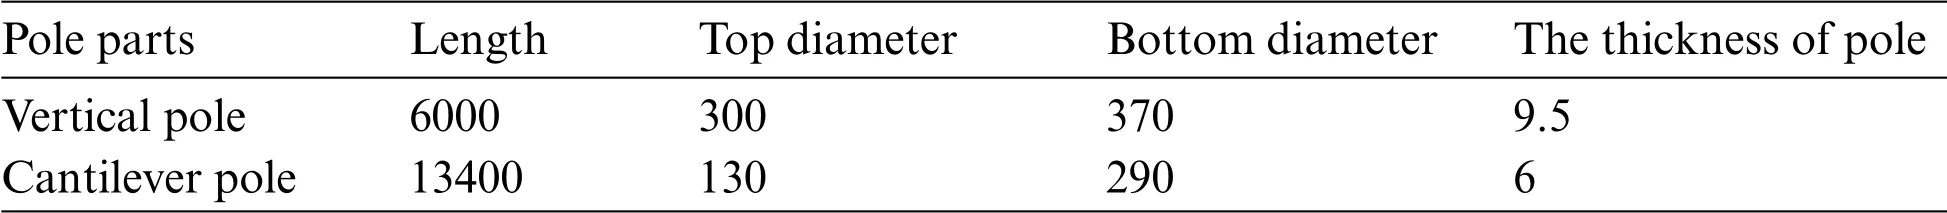
Table 1:Geometric parameters of the main components of the signal light structure(unit:mm)
Table 2:Mass of attached signal(unit:kg)
The direction of the incoming wind load on the structure is shown in Fig.2.In the actual case,the vibration response of the structure by wind load is not obvious in the 0°and 180°cases,so the settings of these two wind angle conditions are omitted here,and the wind speed range is experienced by the geographical location of the structure is 3–12 m/s.All the numerical simulations performed in this paper were carried out in the general analysis software ANSYS,and for the meshing of the cantilever traffic signal support structure, we chose a three-dimensional 8-node hexahedral cell (solid185).To ensure the accuracy of the calculation,the mesh division needs to be as dense as possible.In this paper,the mesh size of the structure is 20 mm,which saves computational cost while meeting computational accuracy.
Figure 2:Schematic diagram of the incoming wind angle of the structure
2.2 Modal Analysis
In structural dynamics analysis, solving the dynamic response of a structure needs to be done based on the dynamic equilibrium equations of the mass system in the structure.When the engineering structure can be discretized as a constant, linear multi-degree-of-freedom system, the dynamic equilibrium equation of the structure can be expressed as Eq.(1):

where [M], [C], [K] are the mass matrix, damping matrix, and stiffness matrix of the structure,respectively;{(t)},{(t)},{X(t)}are the acceleration vector,velocity vector,and displacement vector,respectively;{F(t)}is the action force vector.
The modal analysis of this cantilever signal structure was carried out,and the first three orders of vibration patterns of the signal structure were obtained by using the Lanczos method with full restraint on the base of the signal riser without applying pre-stress,as shown in Table 3.
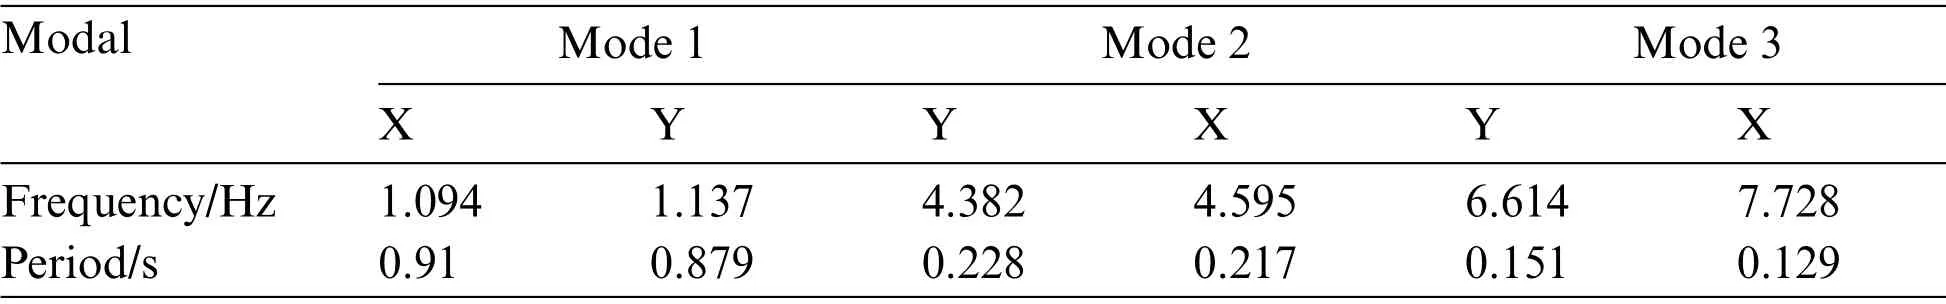
Table 3:The first three orders of modalities of the signal light structure
The structure exhibits pendulum vibrations in the X and Y directions under the first-order vibration pattern, where the largest displacements all occur at the top of the cantilever end.When the wind speed direction approaches the structure from the leeward side of the signal light, the top of the cantilever pole of the structure will produce a larger displacement response.In the second-order vibration mode, the structure first vibrates in the Y-direction at a lower frequency,then X-direction vibration occurs,and the vibration shows that the middle of the cantilever and the top of the cantilever will produce a larger displacement response.In the third-order vibration mode,the Y-directional vibration mode shows that the top of the cantilever bends in the positive direction of Y,and the middle of the cantilever bends in the negative direction of Y.The X-directional vibration mode shows that the top of the cantilever and the top of the column bends in the positive direction of X,and the middle of the cantilever bends in the negative direction of X.The first three orders of the structure are shown in Fig.3.
Table 4 shows the comparison of the vibration frequencies given by the finite element analysis in this study with the field measurement results and finite element simulation results given by reference[10].It can be seen that the finite element simulation results in this study are basically in agreement with the values in reference[10],but the discrepancies between the finite element analysis and the field measurements are slight larger.Table 4 also indicates that the measured frequencies are lower than the calculated ones.This is mainly because the ideal structural model is used in the finite element analysis,whereas the actual structure is not absolutely rigid connected and additional mass may also be taken into account during fabrication and installation,resulting in a smaller stiffness and larger mass of the actual structure.However,as demonstrated in Table 4,the maximum deviation of the frequencies does not exceed 20%,which are acceptable deviations in engineering practice.Therefore,the finite element model for the signal light structure established in this study is reliable and can be used to simulate more engineering cases.
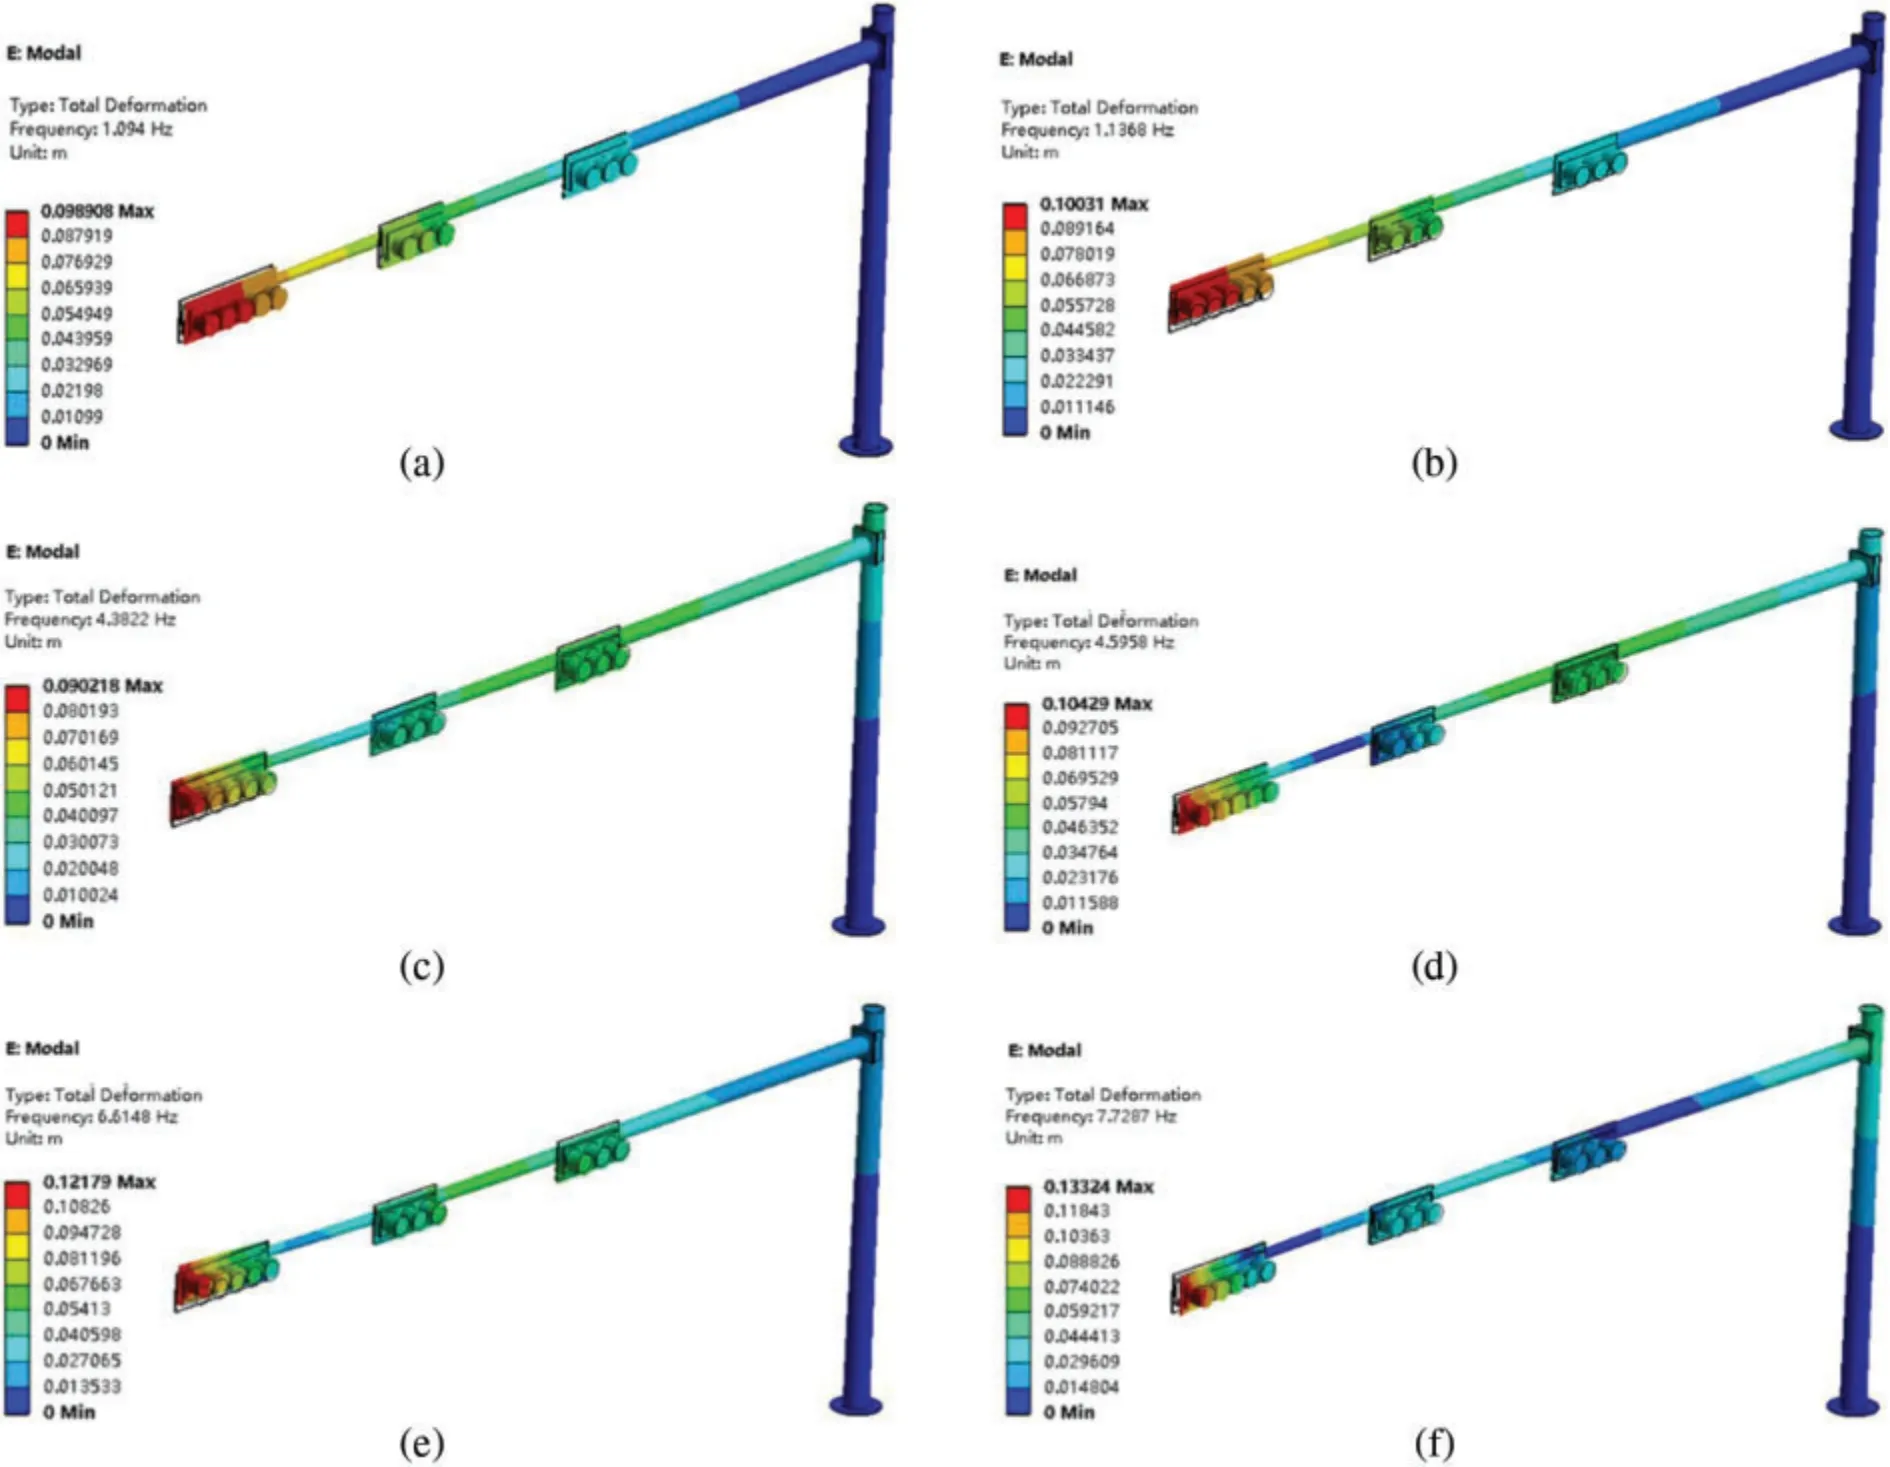
Figure 3:The first three orders of vibration of the signal light structure.(a)X-directional first order;(b) Y-directional first order; (c) Y-directional second-order; (d) X-directional second-order; (e) Ydirectional third order;(f)X-directional third order
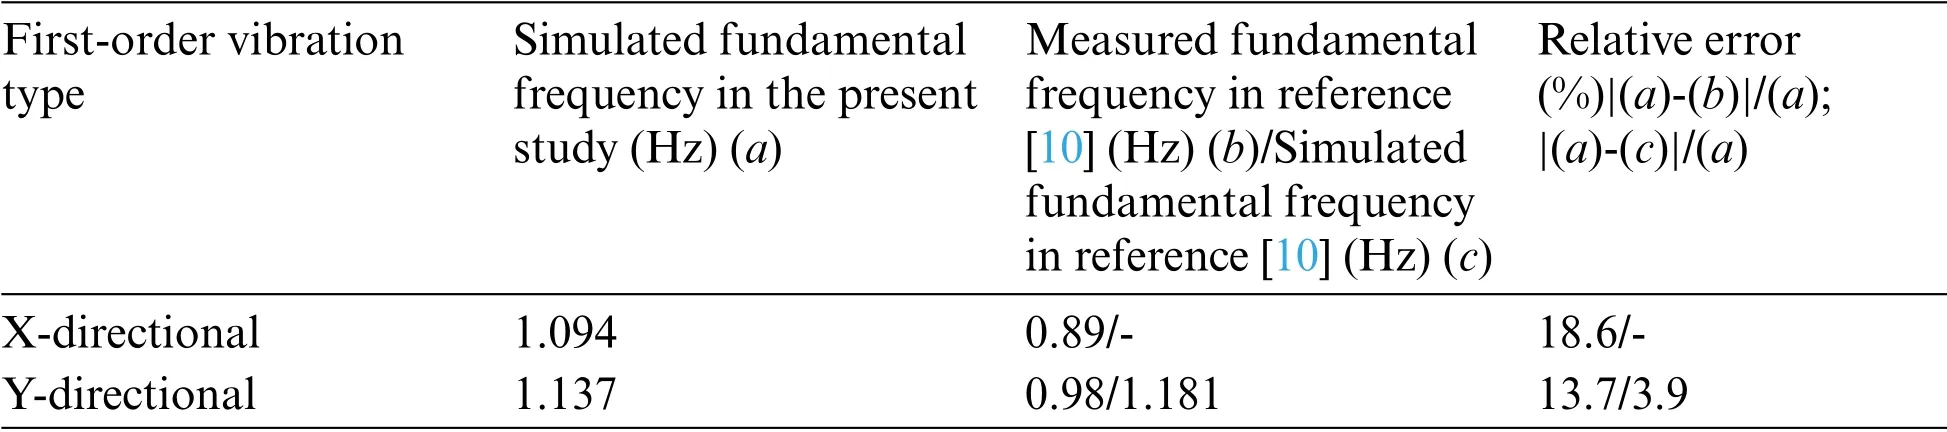
Table 4:Comparison of fundamental frequency from the finite element analysis and field measurements
3 Wind and Structure Coupling Calculation Model
The cantilever traffic signal support structure model is from an actual structural model in a certain place, and the model of this size specification is more representative in actual engineering, so the structure is selected as the wind vibration response analysis model for this type of structure.Since data transfer is required in the process of two-way fluid-solid coupling calculation, its calculation volume will change with the complexity of the model.In this paper, the main consideration is the wind vibration response of the main structure, so the structure shape is simplified as necessary, i.e.,the bolts,flanges,and stiffening ribs are removed.Describing the coupling between fluid and solid is quite complicated,mainly because fluid-solid coupling is a nonlinear process.Therefore,in practical engineering applications,when the accuracy of the structure to be calculated is high and the calculation results need to be closer to the real situation, the calculation method of two-way fluid-structure coupling can be chosen.The calculation flow of bidirectional fluid-structure coupling is shown in Fig.4.
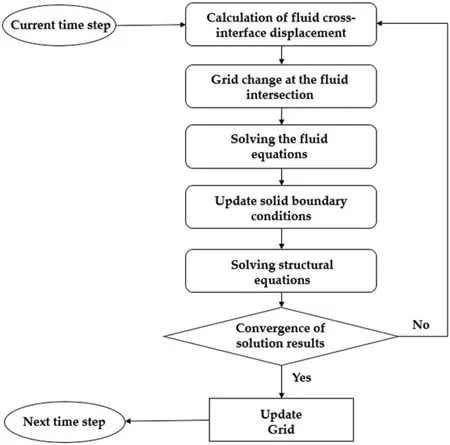
Figure 4:Two-way fluid-structure interaction calculation flow
In the fluid-structure coupling analysis of the structure,due to the repeated actions between the structure and the air,the flow of air will lead to the deformation of the signal light support structure,and in turn,the deformation of the structure will affect the flow of air.Therefore,the three modules Fluent,Transient Structural,and System Coupling in the Workbench platform are used to interact in the fluid-structure coupling analysis to realize the fluid-structure coupling solution of the structure to obtain the wind vibration response of the structure under the action of wind loads.
3.1 Structural Dynamics Equations during Coupling Action
When considering the coupling effect between the cantilever traffic signal structure and the wind,the control equation is generally used as the incompressible Navier–Stokes equation.Due to the small change in the density of air, the mass conservation equation of wind can be disregarded.The conservation of the momentum equation for the fluid is expressed as Eq.(2).

wherepis the static pressure,σis the stress tensor,ρfis the mass force of the fluid, and -→Fis the external force on the fluid, including model-dependent source terms, such as porous media and user-defined source terms.
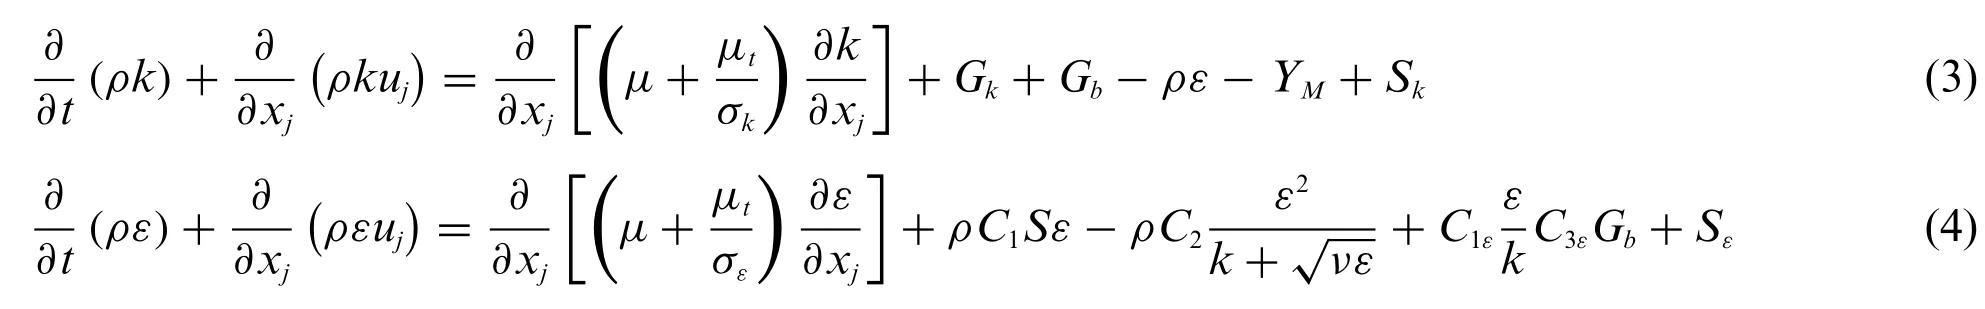
For the above Navier–Stokes equation,to achieve the turbulence effect of wind,we need to choose a suitable turbulence model when we simulate it in Fluent[27].In this paper,the Realizable k-epsilon turbulence model based on two equations is chosen, and the transport equations of this turbulence model are expressed as Eqs.(3)and(4).
The equation of motion of the structure can be obtained using the finite element method,expressed as Eq.(5).

whereris the displacement vector;f pis the nodal vector of hydrodynamic forces at the fluid-solid interface;andf0is the external excitation vector at other locations at the non-fluid-solid interface.
3.2 CFD Model Setup
Since this paper mainly discusses the vibration response of the cantilever traffic signal structure caused by wind load,less attention is given to the flow details at the near-wall surface of the structure boundary, so the Realizable k-epsilon turbulence model based on two equations is selected in this paper.The fluid domain mesh is an unstructured tetrahedral mesh with local encryption.For the boundary layer mesh,the height of the first layer near the wall is 5 mm,the boundary layer is divided into 5 layers, and the expansion growth rate of each layer is 1.2.For the non-boundary layer mesh,free diffusion division is used,and the mesh size is 0.8 m.The final number of fluid domain meshes is 2125445,and the number of nodes is 390971.The delineated grid is shown in Fig.5.
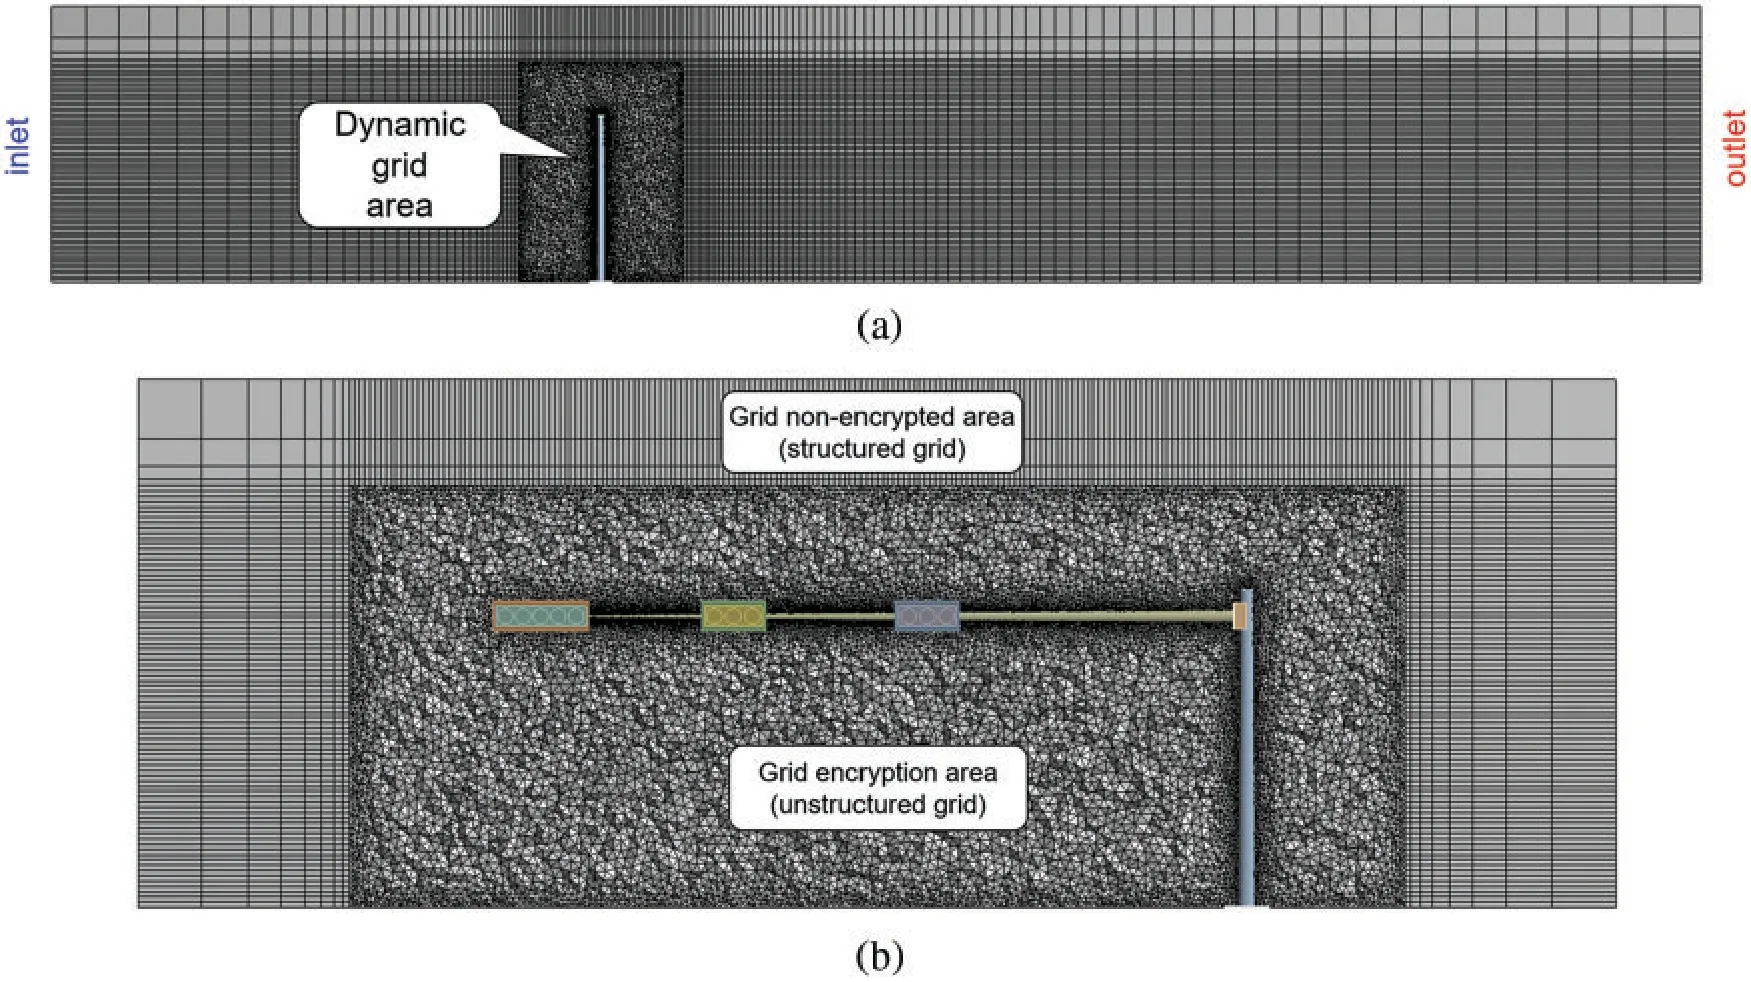
Figure 5:Fluid domain meshing diagram.(a)XZ plane;(b)YZ plane
In Fluent software,the standard wall function is used for this turbulence model near the wall.The boundary layer is divided into laminar boundary layer and turbulent boundary layer.The laminar boundary layer is the boundary layer when the flow is closest to the wall or laminar flow, and for general turbulent flow, then both boundary layers will exist.When divided by the parameter distribution law, the boundary layer is divided into inner and outer zones, where the inner zone is divided into the viscous bottom layer, transition layer, and logarithmic law layer; the outer zone is mainly dominated by inertial forces,and its upper limit depends on the Reynolds number.
To facilitate the description of the flow in the wall region,two dimensionless parametersu+,y+,are introduced to represent the velocity and distance in the wall region[28],expressed as Eqs.(6)and(7).
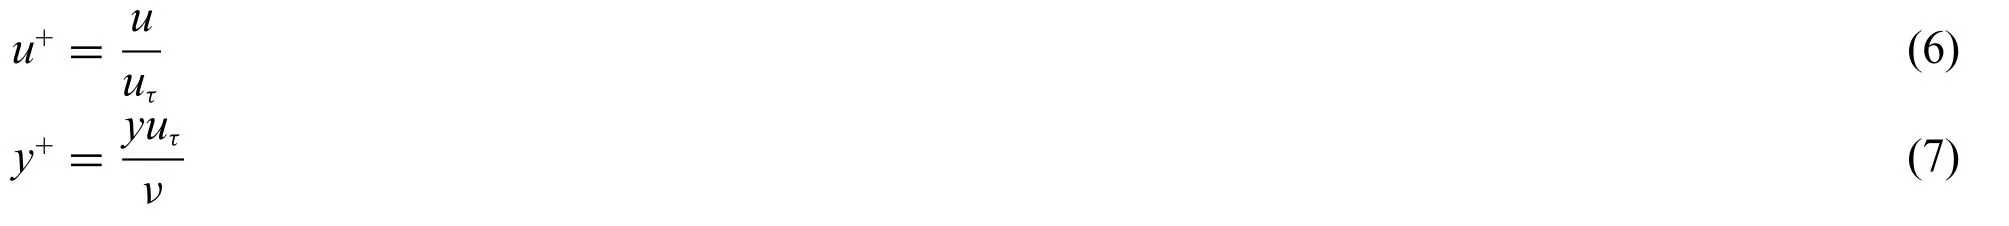
where,uis the time-averaged velocity of the fluid;uτis the wall friction velocity;yis the absolute distance from the wall;νis the kinematic viscosity.
The wall function method is not solved for the region where the vicious influence is more obvious(y+smaller region),and for the turbulence model using the wall function,the thickness of the viscous sublayery+is generally required to be between 30 and 300.For this requiredy+value, the grid size of the near-wall surface of the structure is between 2 and 20 mm.In this paper,the first layer of the near-wall surface of the structure is divided into a grid height of 5 mm,and itsy+value is 60,which satisfies they+value of this turbulence model.
The inlet boundary adopts the velocity-inlet boundary condition, the outlet boundary adopts the pressure-outlet boundary condition, the upper and lower surfaces of the fluid domain are the stationary boundary and the side surfaces are the symmetry boundary.The CFD model is shown in Fig.6.The pressure-velocity coupling scheme is chosen as a SIMPLE scheme,the spatial discretization sets the gradient based on the least-squares unit,the discretization scheme of the pressure equation is second order,and the momentum,turbulent kinetic energy,and turbulent dissipation rate are chosen as second-order upwind options.CFD simulation boundary conditions are shown in Table 5.Where,U,V,Wis the flow velocity in X,Y,and Z directions,respectively;U0is the average wind speed out of 10 m height[29,30];zis the height position;Iis the turbulence intensity;kis the turbulent kinetic energy;εis the turbulent dissipation rate;lis the structure characteristic size;Ksis the fluid domain ground roughness length.The dynamic grid is updated by the spring smoothing method and the local grid reconstruction method,and the total time of fluid domain calculation is 20 s,with a time step of 0.02 s.

Figure 6:CFD model.(a)Top view of the model;(b)Left view of the model;(c)3D view of the model
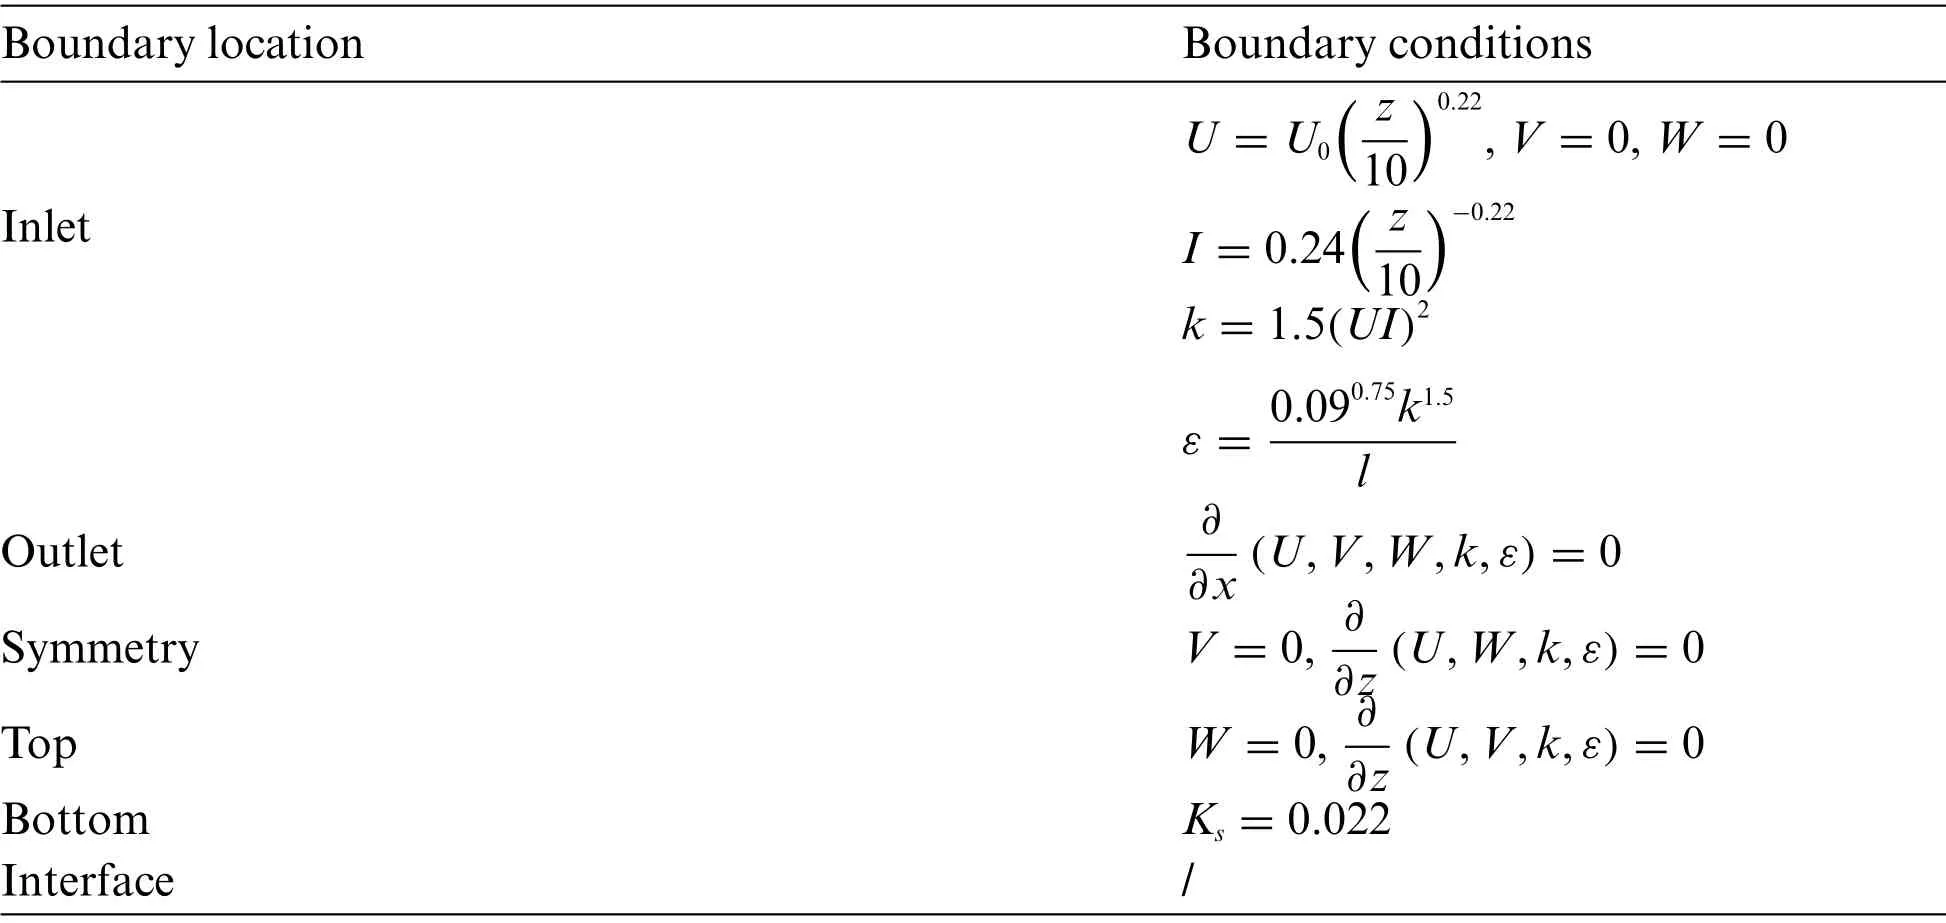
Table 5:Boundary conditions of CFD simulation
3.3 CSD Model Setup
The base of the signal light support structure is fully constrained, acceleration is applied to the structure in the same direction as gravity,and the acceleration magnitude is also the same as the gravity magnitude.The surface of the structure is set as a coupling surface,which will be used for data transfer with the coupling surface of the fluid in the system coupling module.The solution type is chosen as a direct solution,and the large deformation switch is chosen to be turned on because the deformation of the structure is a nonlinear geometric deformation.The solution time of the structure is kept the same as the solution time of the fluid domain,with a solution time of 20 s and a time step of 0.02 s.
3.4 Model Validation
In the modal analysis,the structural dynamics of the cantilevered traffic signal support structure have been verified,and the structural model has been proven to be correct.In this part of the analysis,the main consideration is the correctness of the structural model when considering the coupling action.
3.4.1 Mesh Convergence Verification
In computational fluid dynamics,different mesh sizes can have an impact on the accuracy of the computational results.Too large a mesh size can lead to inaccurate capture of fluid details and bias the calculation results,while too small a mesh size can make the simulation more accurate,but the number of meshes will increase as a result,leading to higher computational effort and higher computational cost.Therefore,it is especially important to choose the appropriate mesh size when performing fluidstructure coupling analysis.
There are many methods for grid convergence verification,among which the Richardson extrapolation method[31]can be used to estimate the error due to grid variation.For the estimation of the error, several calculations with grids of different scales are required.To facilitate the analysis, it is desirable to keep the ratio between the different grid scales consistent,expressed as Eq.(8).

where,xiis the grid spacing.
For the mesh convergence analysis of fluid-structure coupling in this paper,three sets of different numbers of fluid domain meshes were selected.The numerical calculation of the fluid-structure coupling is carried out for three different sets of fluid domain meshes,and the three calculation results are also compared and analyzed.The scale factors can be obtained by Eq.(9)to determine whether the grid converges or not.The convergence conditions are as follows:when 0<Δ <1,the grid converges monotonically;whenΔ <0,the grid oscillation converges;and whenΔ >1,the grid diverges.

whereSiis the calculation result of theiset of grids.
3.4.2 Comparison of Calculation Results with Different Grid Densities
The grid density of the whole fluid domain is changed by changing the grid size at the boundary layer, and three sets of grid schemes with densities of 96, 203, and 380 W are selected.The selected working conditions were as follows:wind angle 90°and wind speed 5 m/s.
The most favorable grid density was selected by comparing the along-wind displacement of the cantilevered traffic signal support structure at the tip of the cantilever pole under the flow field with different grid densities and comparing the along-wind response of the structure under the flow-solid coupling with the theoretical method[32].The comparison data are shown in Table 6 below.
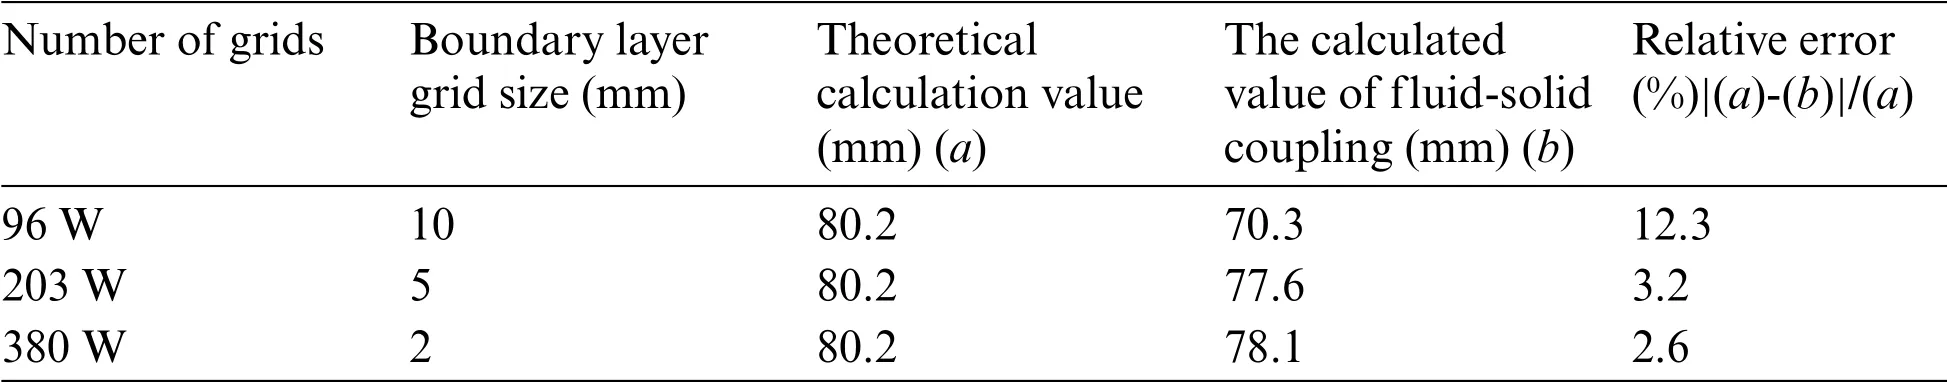
Table 6:Comparison of along-wind displacement at the top of the cantilever pole of the signal light support structure
From the data in the table,it can be seen that with the increase in the number of grids,the error of the calculated values of fluid-solid coupling and the results obtained from the theoretical calculation do not produce large changes, and the error is within the acceptable range under the conditions of fewer grids and more grids.However,since the presented method is an approximation of the theoretical calculation,it can be considered that in this example,the fluid grid selection above 100 W has satisfied the calculation requirements,and in this paper,the fluid domain grid can be selected as the second set of grid schemes for subsequent calculations.
4 Wind Vibration Response Analysis of Cantilevered Traffic Signal Support Structure
Through the dynamic response characteristics of the structure in the modal analysis,we can obtain the position of the maximum displacement of the dynamic response of the structure that is generated at the top of the cantilever pole.Therefore,the displacement measurement points are arranged at the top of the cantilever pole of the structure,as shown in Fig.7.Therefore,the displacement response at this position is analyzed under different wind angle and wind speed conditions, and the wind vibration response law of the cantilever traffic signal support structure can be understood.Figs.8a and 8b indicate the cross-wind vibration and along-wind vibration of the structure when subjected to wind load,respectively.
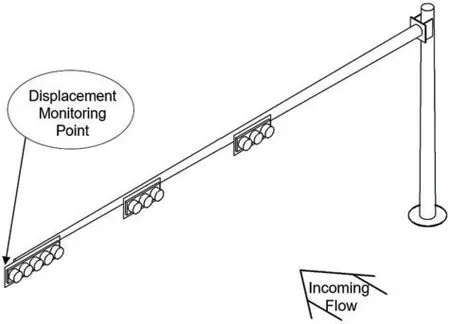
Figure 7:Monitoring measurement point layout drawing
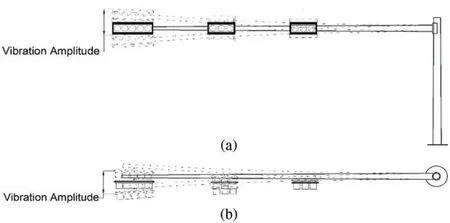
Figure 8:Monitoring measurement point layout drawing.(a) Cross-wind vibration; (b) Along-wind vibration
4.1 Structural Cross-Wind Response Analysis
Figs.9 and 10 below show the cross-wind displacement time courses for two wind angles of 30°and 270°at different wind speeds,respectively.
(1) The mean value of the transverse wind displacement response of the structure is approximately zero under different working conditions.
(2) In the initial stage of wind load action,the displacement response of the structure is small,but with increasing time,its displacement response also gradually increases and stabilizes.
(3) Under a wind angle of 30°,the displacement response at low wind speeds is larger than that at high wind speeds,but this law is not constant.With the gradual increase in wind speed,the cross-wind displacement response will still gradually increase.
(4) At a 270°wind angle,the displacement response of the structure is larger,and it can be seen that the maximum value of the displacement response at 5 m/s exceeds that at a wind speed of 10 m/s.
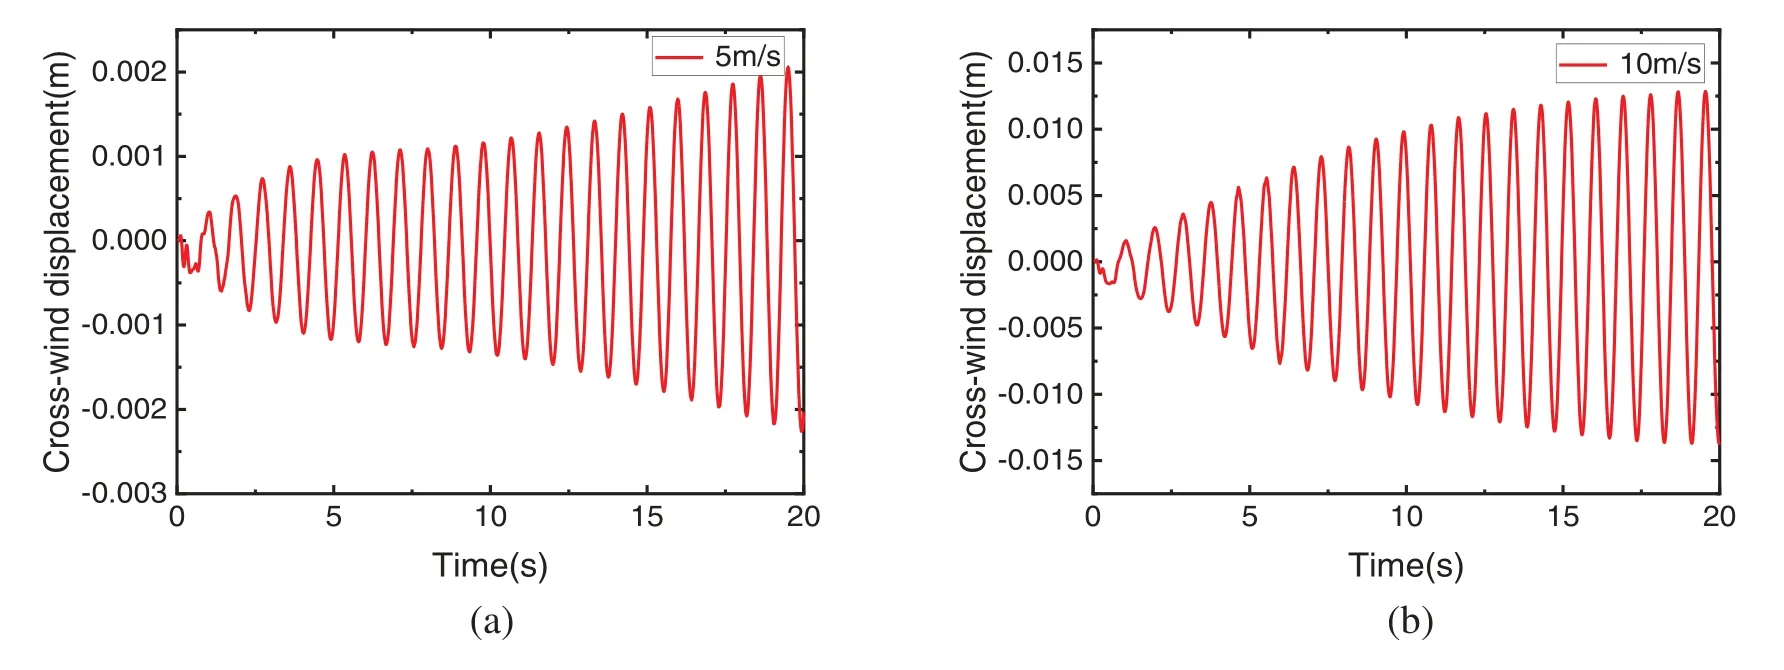
Figure 9:Temporal displacement cross-wind at a 30° wind angle at different wind speeds.(a) 5 m/s;(b)10 m/s
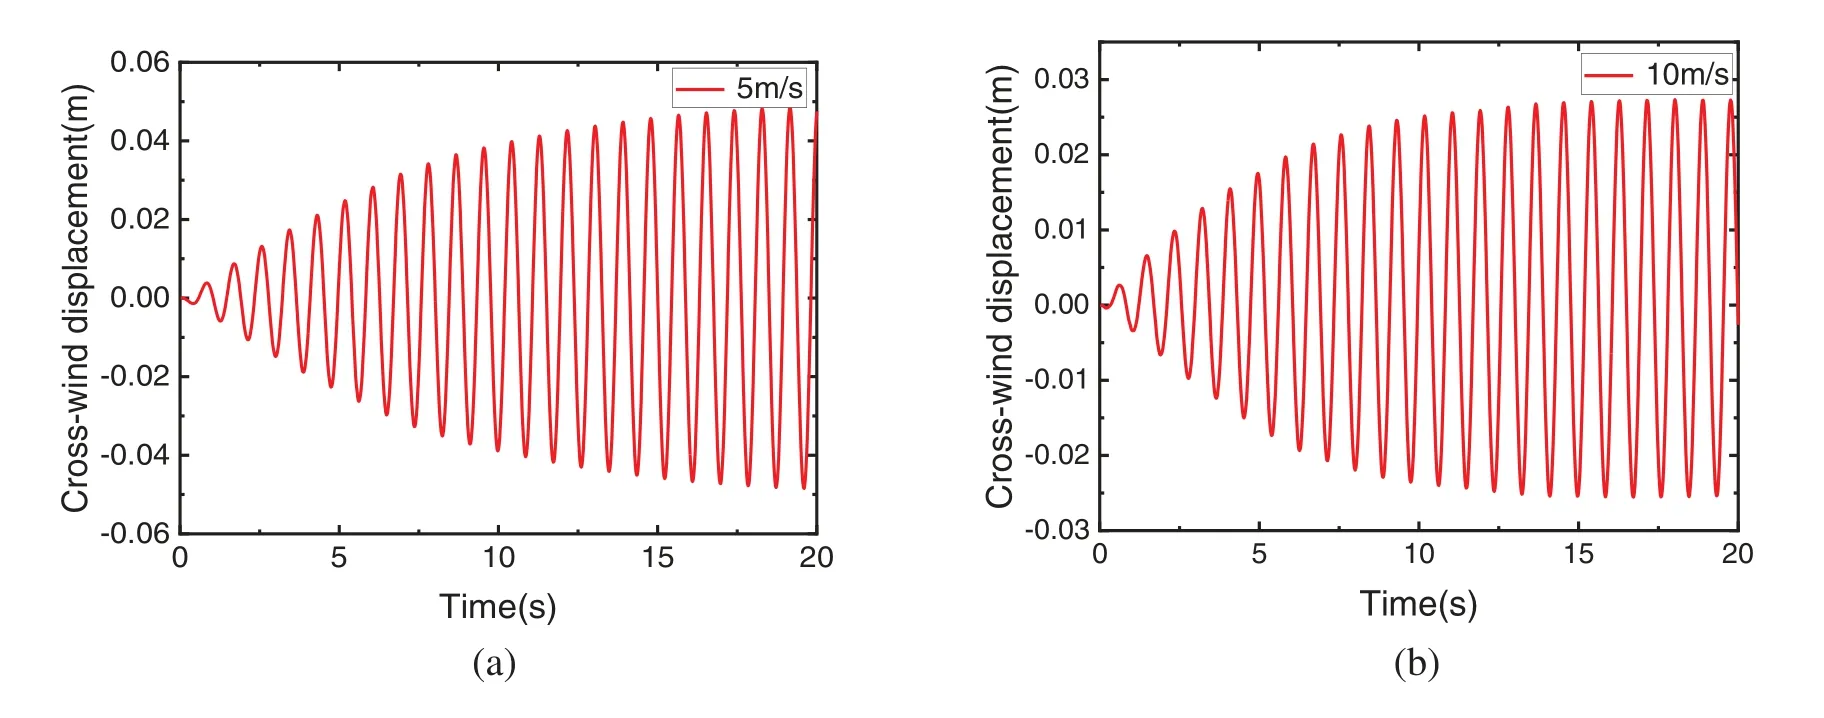
Figure 10:Temporal displacement cross-wind at a 270°wind angle at different wind speeds.(a)5 m/s;(b)10 m/s
Since more working conditions are involved, this part only briefly presents two typical wind angles and two typical wind speeds in the displacement time domain.Through the above time domain analysis,we can understand the vibration of the cantilevered traffic model light support structure in the plane.
According to the displacement time equation above, the vibration response of the structure in the frequency domain can be obtained by Fourier transforming the above time domain results in MATLAB, as shown in Fig.11.At different wind angles, the structure produces the maximum vibration response near the fundamental frequency,and other vibration modes do not participate,i.e.,the displacement response of the structure is dominated by the contribution of the first-order vibration mode.Moreover, the vibration response caused by the dominant vibration mode of the structure at the same wind speed is not the same at different wind angles.
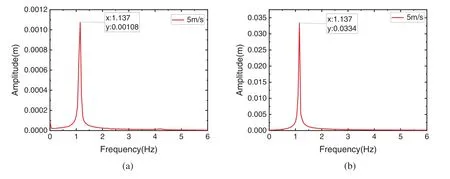
Figure 11:Frequency domain response of the structure at 5 m/s for different wind angles.(a)30°;(b)270°
To compare with the time-frequency diagram obtained by the Fourier transform,the frequency domain analysis of the displacement time course of the structure was carried out based on the continuous wavelet transform[33].The obtained wavelet transform time-frequency is shown in Fig.12.According to the time-frequency diagram of the wavelet transform, the vibration response of the structure in the time domain and frequency domain can be observed visually.Under the cross-wind condition,the larger amplitude of the structure appears after 10 s.
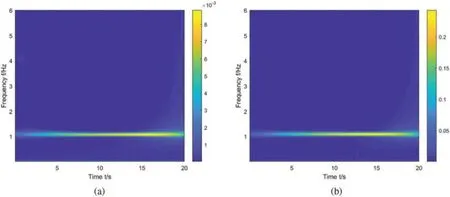
Figure 12:Frequency domain response of the structure based on wavelet transform for 5 m/s at different wind angles.(a)30°;(b)270°
Through the dynamic response of the cantilever traffic signal support structure under each wind angle and each wind speed condition,we can use the response time data of the structure to evaluate and judge the wind vibration response characteristics of the structure.Fig.13 shows the cross-wind structural response characteristics of the structure at four wind angles,where the horizontal coordinate indicates the wind speed and the vertical coordinate indicates the standard deviation of the cross-wind displacement.The standard deviation of displacement under each different working condition is used to understand the vibration law of the structure when it is subjected to wind load.
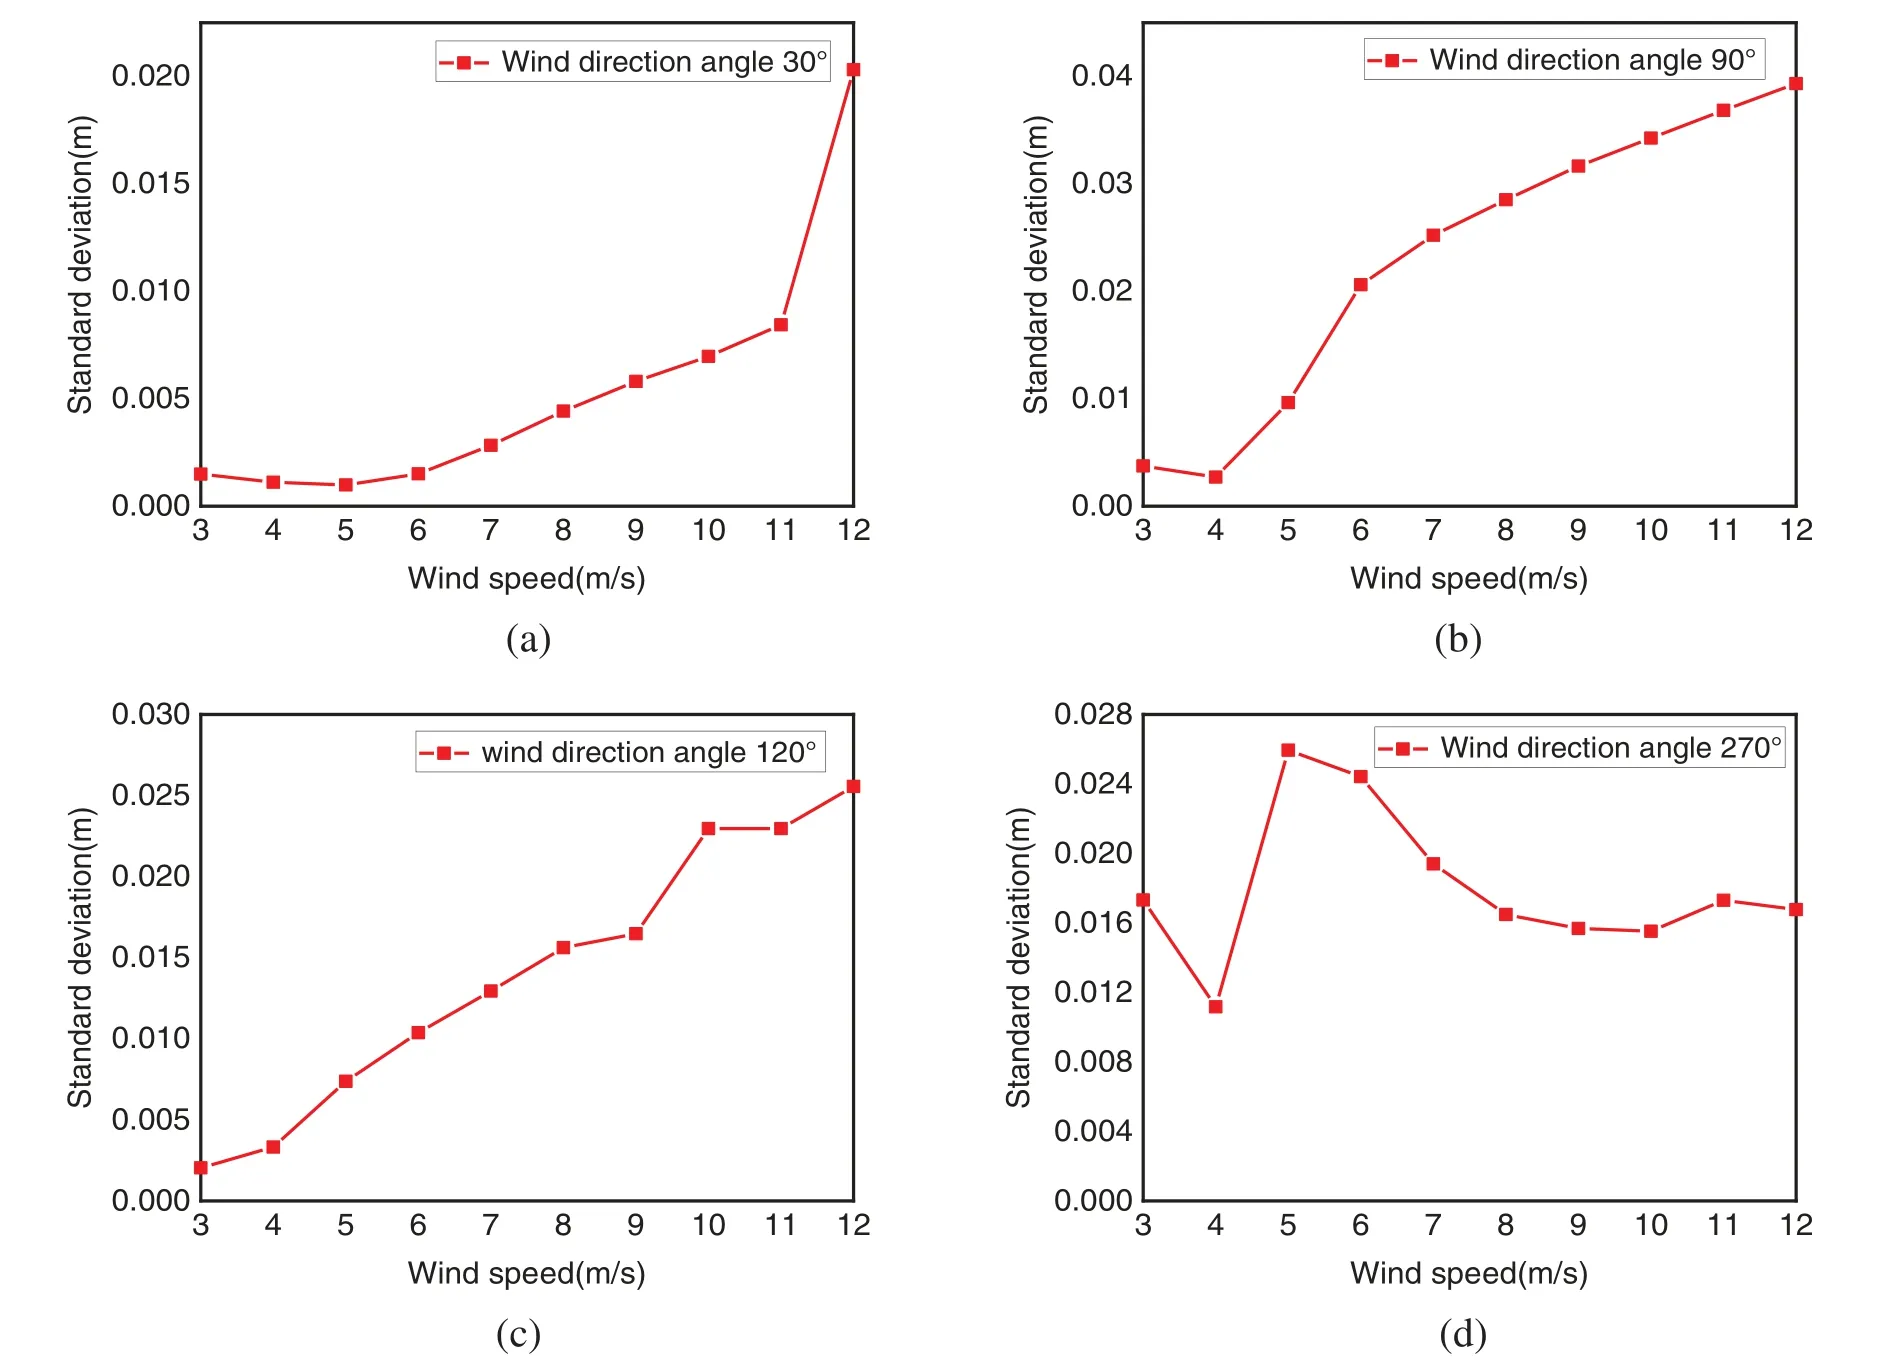
Figure 13:The standard deviation of cross-wind displacement of the structure at different wind angles.(a)30°;(b)90°;(c)120°;(d)270°
As indicated in Fig.13,the structure produces a larger vibration response for wind angles of 90°and 270°.This is because the structure plane is perpendicular to the incoming wind direction when the effective wind area of the structure is the largest.Among them, the maximum response of the structure increases gradually with increasing wind speed under a wind direction angle of 90°,showing a state of vibration dispersion.From 6 m/s,the increase in the displacement response of the structure is approximately linear.According to the vibration response characteristics under the wind angle,the response is due to the vibration phenomenon of galloping.Under a wind direction angle of 270°,the maximum displacement response of the structure occurs at wind speeds of 5 m/s and 6 m/s throughout the wind speed range,and the response of the structure remains the same in other wind speed states.Based on the nature of the vibration response, it can be judged that the vibration generated by the structure at a wind speed of 5 m/s at a wind angle of 270°is vortex-excited.Under other wind angles,the transverse wind displacement response of the structure is proportional to the wind speed,and its regular change is not significant.
To more clearly understand the vibration response characteristics of the cantilever signal structure under transverse winds, the standard deviations of the transverse wind displacement on the front side and back side of the cantilever signal structure are also analyzed.The standard deviations trend contours of the displacement responses of the structure under different wind angles and different wind speeds are shown in Fig.14.Fig.14 clearly demonstrates that the cross-wind vibration responses of the structure are most obvious under the 90°and 270°wind angles.
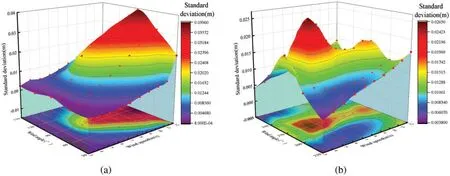
Figure 14:Standard deviation of transverse wind displacement responses of the cantilever signal structure.(a) Wind acting from the front side of the structure; (b) Wind acting from the backside of the structure
Table 7 shows the maximum values and standard deviations of the cross-wind displacement response of the structure at two wind angles of 90° and 270°.The structure has the largest effective wind area under these two wind angles, so the structural response under these two wind angles is judged to be representative.The standard deviation represents the degree of dispersion of the data,while the maximum value represents the maximum response of the structure during the load action.As mentioned in the above analysis,the displacement response of the structure increases with increasing wind speed under a 90°wind angle,and the maximum value of transverse wind displacement is close to 130 mm at the maximum wind speed of 12 m/s in this paper;under a 270°wind angle,the structure produces the maximum vibration response at a 5 m/s wind speed,and the maximum value of transverse wind displacement reaches 97 mm at this time.
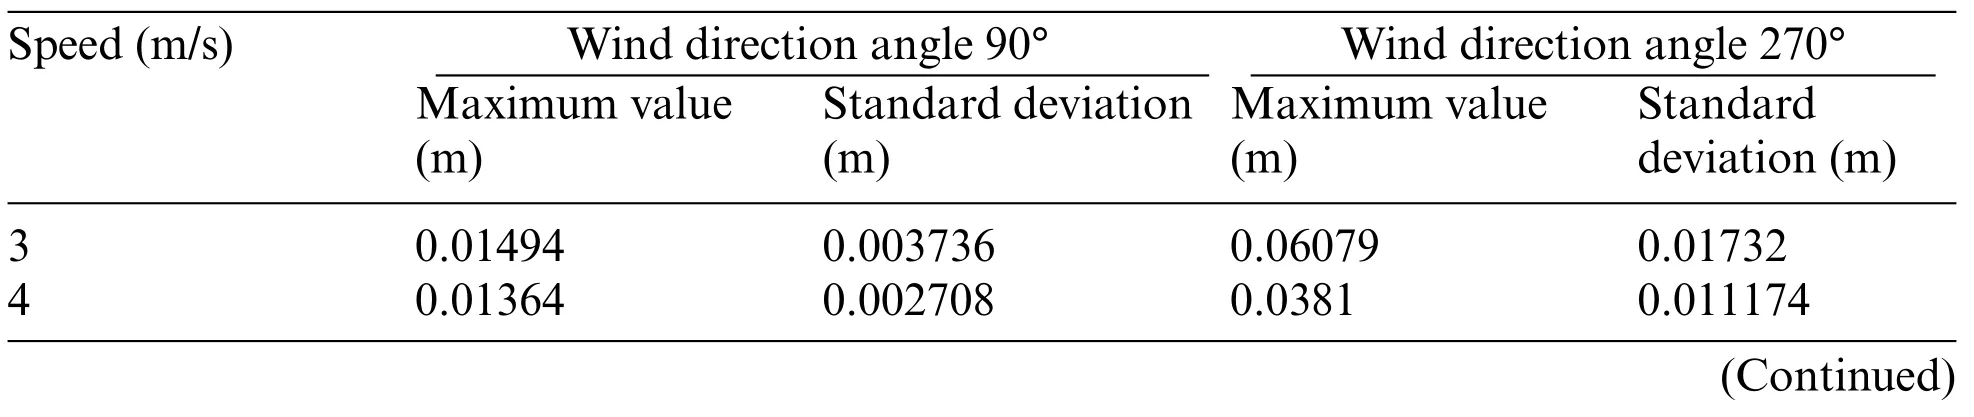
Table 7:Maximum and standard deviation of the structural cross-wind displacement response
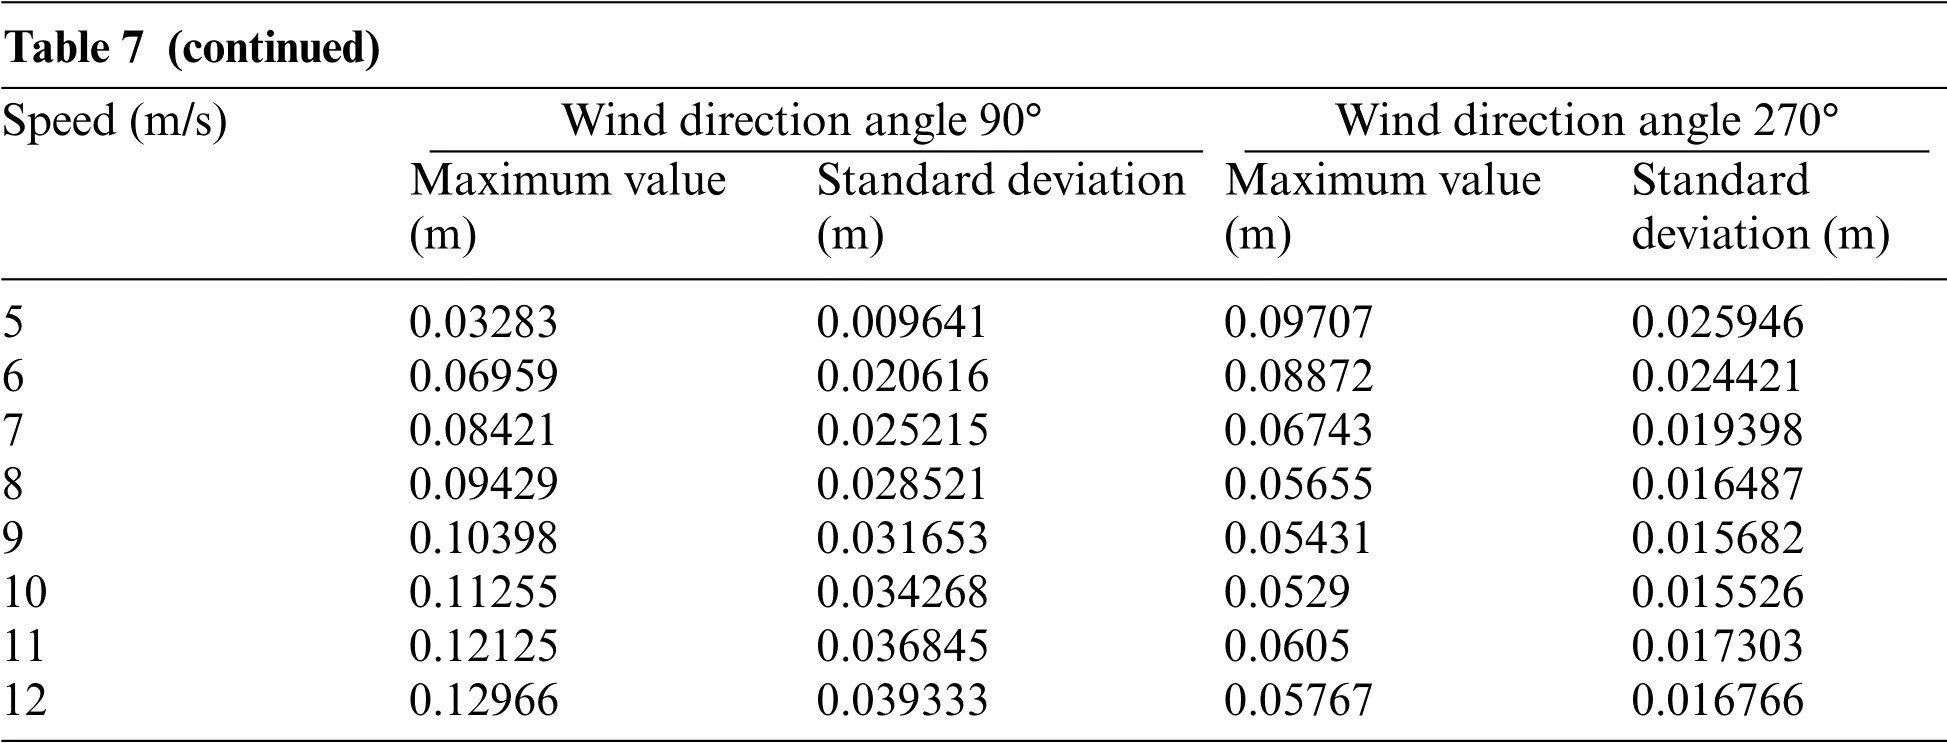
Table 7 (continued)Speed(m/s) Wind direction angle 90° Wind direction angle 270°Maximum value(m)Standard deviation(m)Maximum value(m)Standard deviation(m)5 0.03283 0.009641 0.09707 0.025946 6 0.06959 0.020616 0.08872 0.024421 7 0.08421 0.025215 0.06743 0.019398 8 0.09429 0.028521 0.05655 0.016487 9 0.10398 0.031653 0.05431 0.015682 10 0.11255 0.034268 0.0529 0.015526 11 0.12125 0.036845 0.0605 0.017303 12 0.12966 0.039333 0.05767 0.016766
4.2 Structural Along-Wind Response Analysis
Figs.15 and 16 below show the along-wind displacement time histories for two wind angles of 30°and 270°at different wind speeds,respectively.
(1) The mean value of the along-wind displacement response of the structure is not zero under different working conditions.Moreover,the mean value increases with increasing wind speed.
(2) In the initial stage of wind loading,the displacement response of the structure is more violent,but with the time of loading, the displacement response gradually leveled off and stabilized and finally approached a stable value.
(3) At a 30° wind direction angle, the maximum displacement response occurs at approximately 10 s under the low wind speed condition,but with the loading time,the displacement response gradually decreases and tends to be stable.
(4) At a 270°wind angle,the displacement decays to a steady value state after 10 s in the full wind speed interval,but some fluctuations appear with time at lower wind speed conditions.
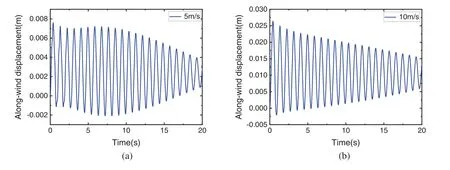
Figure 15:Temporal displacement along-wind of the 30°wind angle at different wind speeds.(a)5 m/s;(b)10 m/s
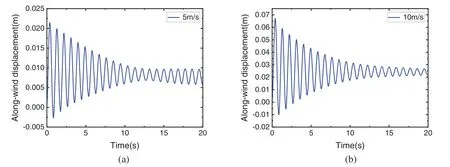
Figure 16:Temporal displacement along-wind of the 270° wind angle at different wind speeds.(a)5 m/s;(b)10 m/s
The vibration response of the structure in the frequency domain can be obtained by spectral analysis of the above along-wind displacement time domain results in MATLAB,as shown in Fig.17.According to the spectrum, at different wind angles, the structure produces the largest vibration response near the first-order vibration type in the X direction, while other vibration types do not participate, i.e., the displacement response of the structure is dominated by the contribution of the first-order vibration type.Moreover, under different wind angles, the vibration response caused by the dominant vibration mode of the structure under the same wind speed is not the same.The mean value of its along-wind displacement response is positively correlated with the effective wind area of the supporting structure when it is subjected to wind load.The spectrum shows two peaks,where 0 Hz indicates the mean value of along-wind displacement, i.e., the along-wind response of the structure finally approaches stability here,and 1.094 Hz indicates the along-wind displacement response of the support structure under wind load conditions,which is dominated by the first-order vibration pattern.
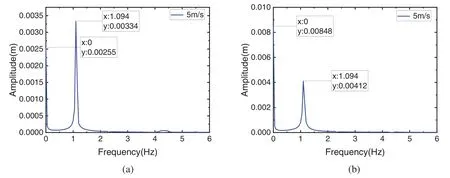
Figure 17:Frequency domain response of the structure at 5 m/s for different wind angles.(a) 30°;(b)270°
As can be seen from Fig.17,the vibration response values dominated by the first-order vibration pattern of the structure are sometimes higher than the mean response values under the same wind speed at different wind angles,which is due to the vibration instability generated by the structure at the initial stage of wind loading.This instability will cause the structure to produce a large displacement response in the initial stage of loading,and after the structural response is stabilized,its vibration will tend to level off.
The frequency-domain analysis of the displacement time range of the structure was carried out based on the continuous wavelet transform.The obtained wavelet transform time-frequency is shown in Fig.18.According to the time-frequency diagram of the wavelet transform,the vibration response of the structure in the time domain and frequency domain can be observed visually.Under the alongwind condition,the amplitude is larger when the structure is first subjected to the wind load,and the vibration response of the structure is dominated by the first-order model.
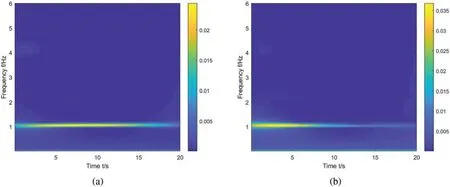
Figure 18:Frequency domain response of the structure based on wavelet transform for 5 m/s at different wind angles.(a)30°;(b)270°
Fig.19 represents the standard deviation of the along-wind displacement of the cantilevered traffic signal support structure at the top of the cantilever pole for four wind angles of 30°, 90°, 120°, and 270°.The along-wind vibration response of the structure is approximately proportional to the wind speed at the four wind angles.Under the four wind angles,the magnitude of the displacement response differs due to the difference in the effective wind exposure area of the structure.Under the same wind speed conditions,the vibration response will be more intense for a larger effective wind area.The 90°wind angle can be considered the incoming flow approaching the structure from the front side of the structure, and the 270° wind angle can be considered the incoming flow approaching the structure from the backside of the structure.At these two wind angles,the effective wind area of the structure is approximately similar.As indicated in Figs.19b and 19d,the response trend and response magnitude are approximately the same for both wind angles, but the overall response at the 90° wind angle is greater than that at the 270°wind angle.This is due to the difference in the shape of the front and back of the cantilever traffic signal support structure,so it can be assumed that the shape characteristics of the support structure have some influence on the vibration response of the structure.
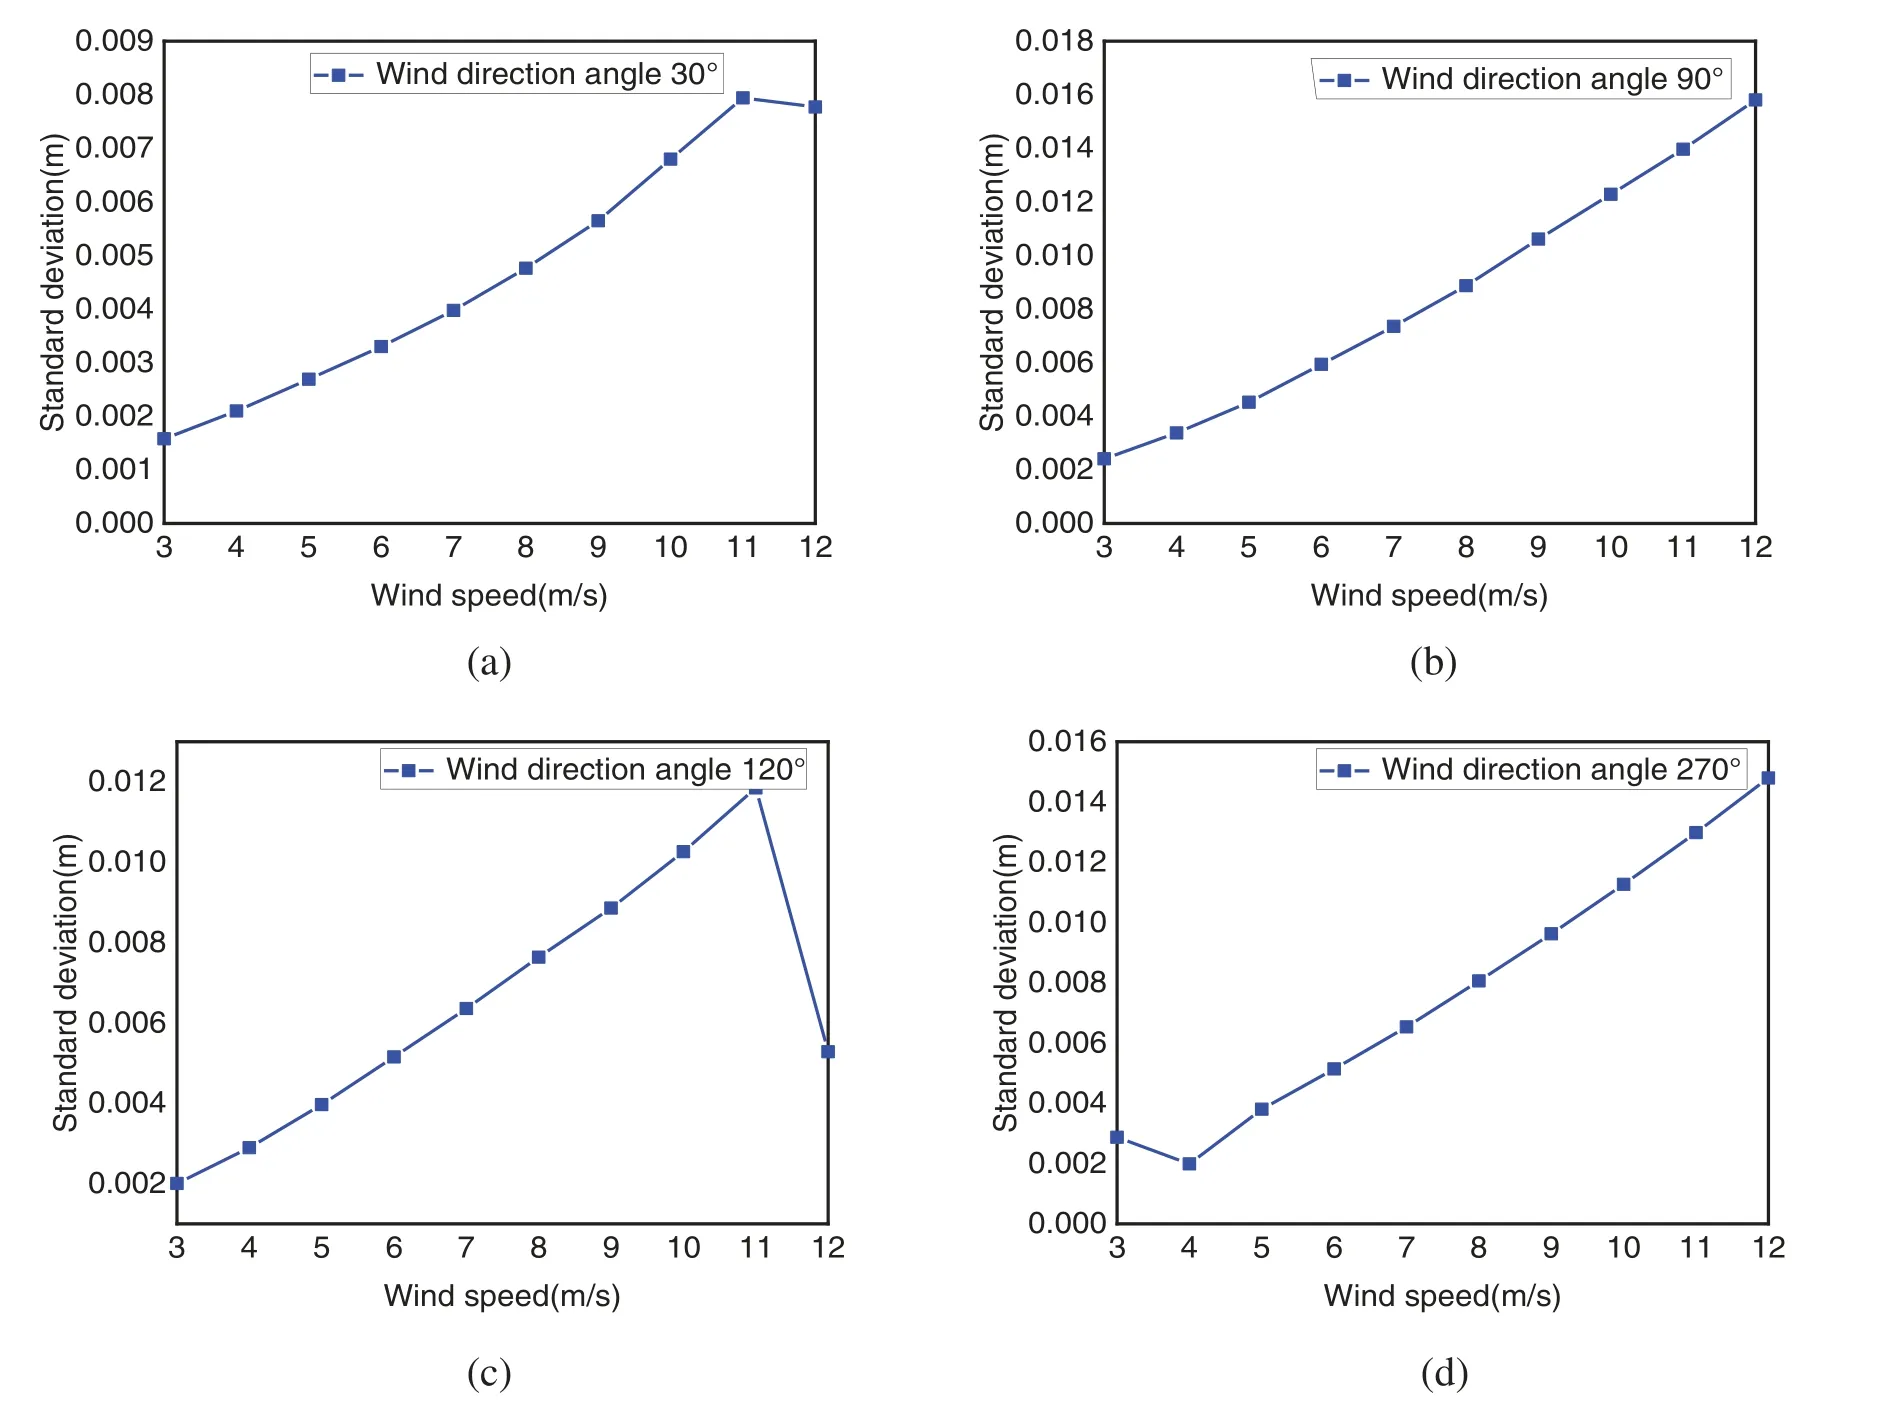
Figure 19:The standard deviation of the along-wind displacement of the structure at different wind angles.(a)30°;(b)90°;(c)120°;(d)270°
Table 8 shows the maximum values and standard deviations of the along-wind displacement response of the structure at two wind angles of 90°and 270°.According to the data pattern exhibited in Figs.19b and 19d,the along-wind displacement response increases with increasing wind speed,and the intensity of its response is also positively related to the wind speed.Table 8 shows that the maximum values of the displacement response at both wind angles are not very different at each wind speed,except for 4 m/s,and the maximum difference in displacement under other wind speed conditions is approximately 1–2 mm.This indicates that the along-wind displacement response of the structure is approximately similar when the incoming flow acts vertically on the structure from both the front and back sides.The maximum values of along-wind displacement of the structure at the maximum wind speed of 12 m/s were 104 and 104.6 mm for the two wind angles,respectively.
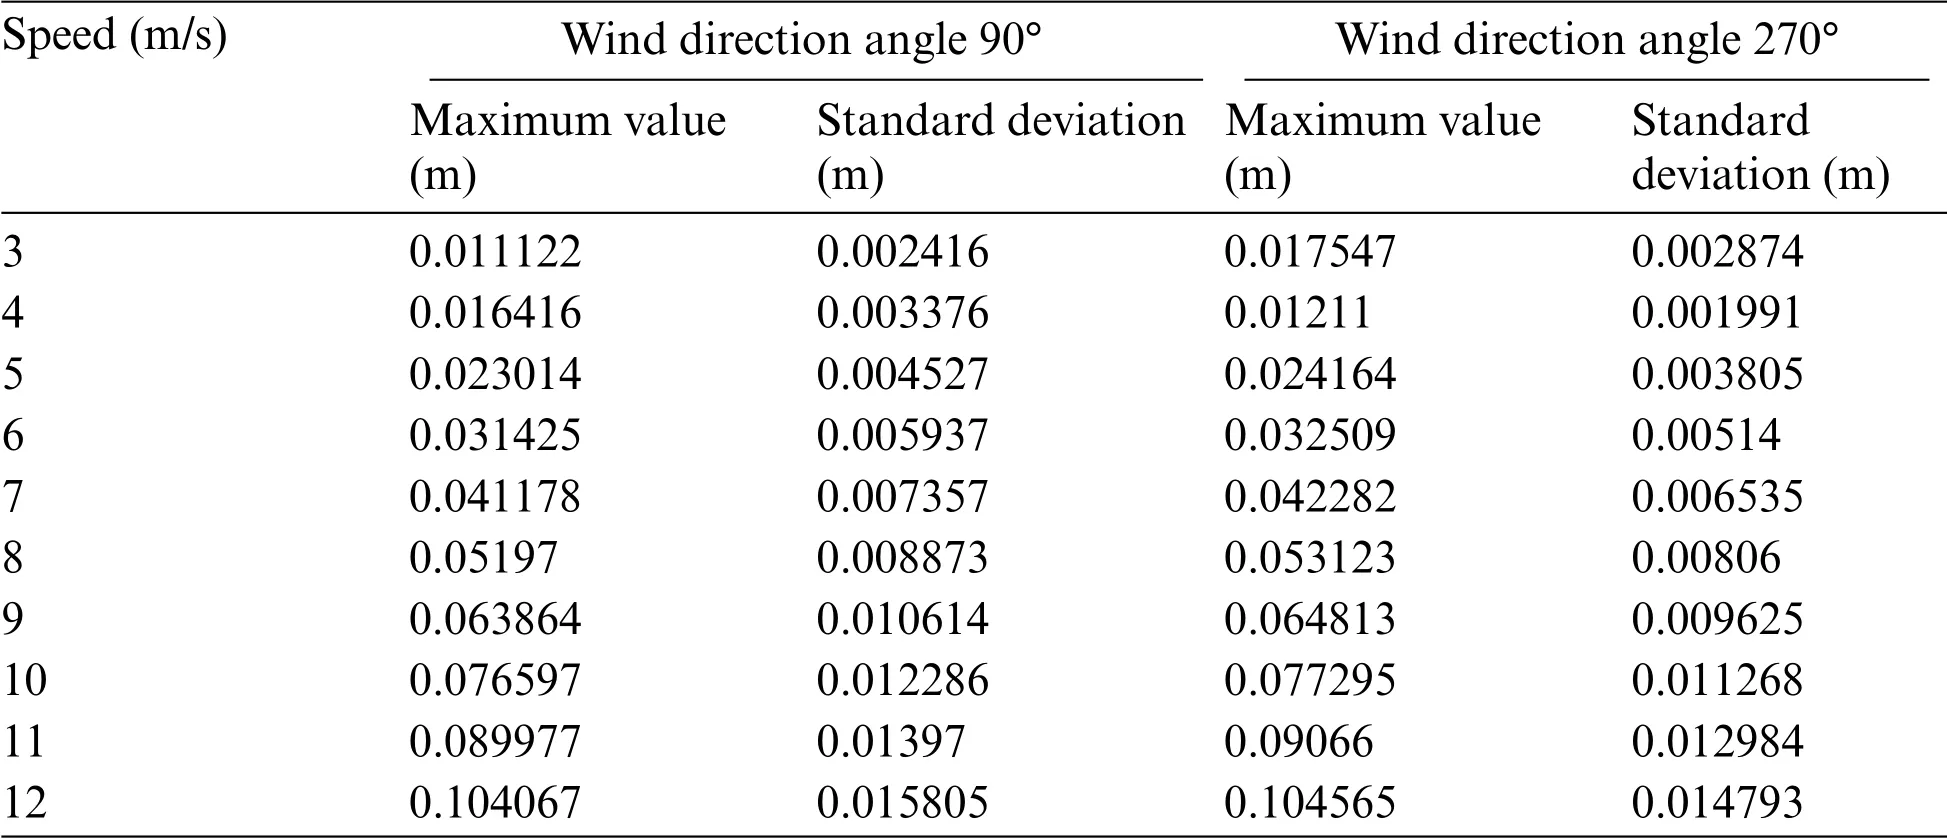
Table 8:Maximum and standard deviation of the structural along-wind displacement response
4.3 Numerical Results of Overall Structural Dynamic Response
The overall displacement response of the cantilevered traffic signal support structure can be understood based on the cross-wind displacement and along-wind displacement time course results in Sections 4.1 and 4.2.The displacement time course results for the cross-wind and along-wind displacements of the structure can be obtained from the displacement trace diagram of the top of the structural cantilever pole, as shown in Figs.20 and 21.The displacement traces of the structure under some working conditions are listed in the figures,and through the traces,we can understand the response characteristics and response law of the structure more intuitively.
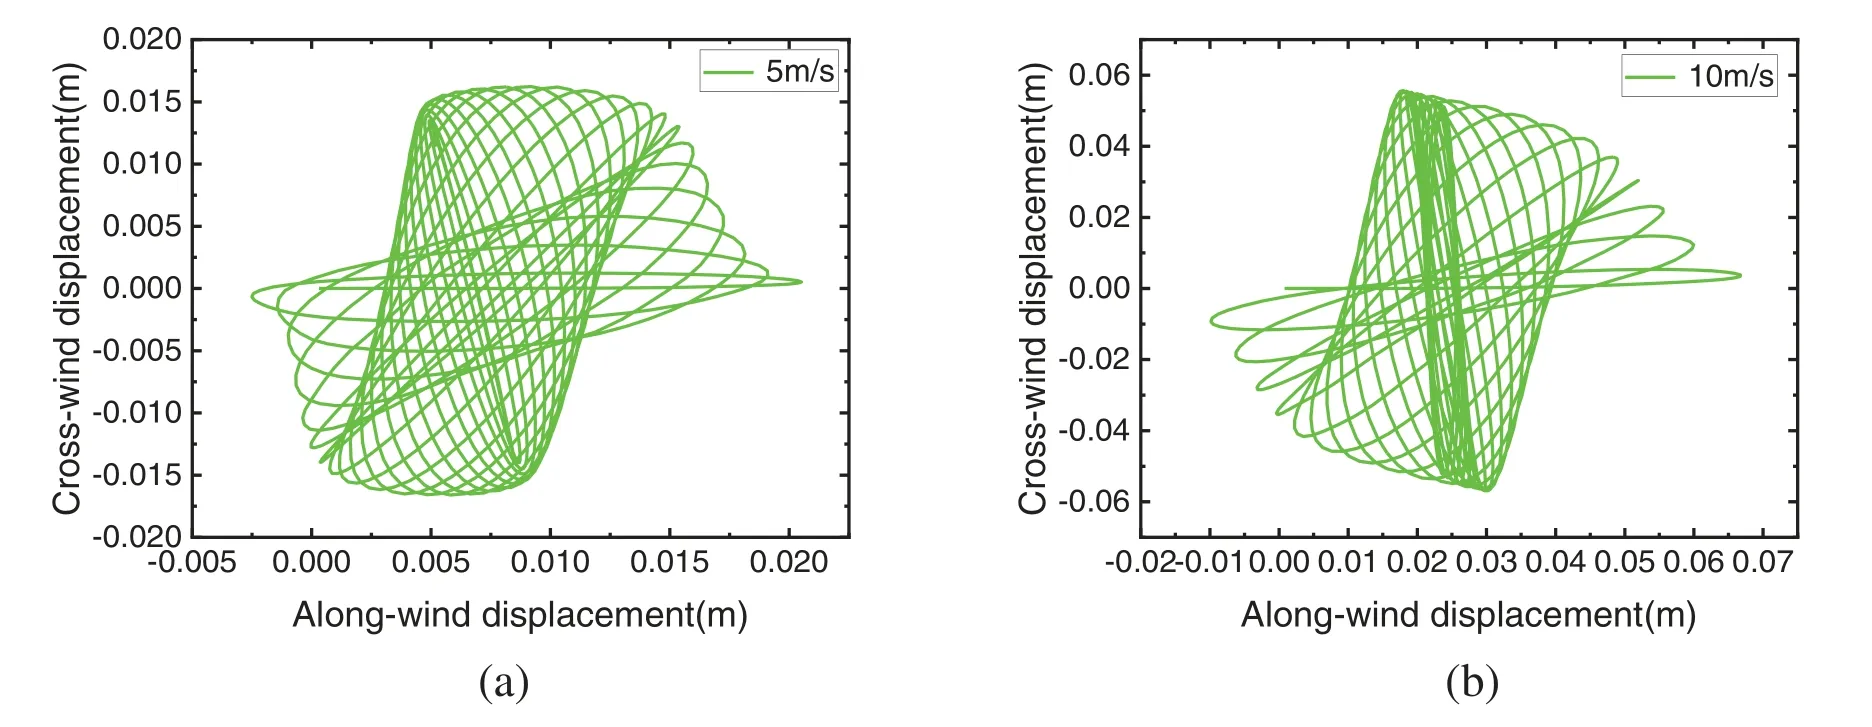
Figure 20:Displacement traces of the top of the cantilever pole at a 90° wind angle under different wind speeds.(a)5 m/s;(b)10 m/s
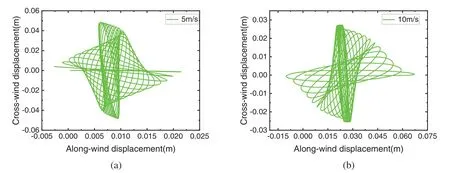
Figure 21:Displacement traces of the top of the cantilever pole at a 270°wind angle under different wind speeds.(a)5 m/s;(b)10 m/s
The relationship between the magnitude of along-wind displacement and crosswind displacement can be observed in Figs.20 and 21,and the displacement trajectory of the top of the cantilever pole of the cantilever traffic signal support structure under various operating conditions can be understood more clearly.From the figures,it can be seen that the response of the structure in the vibration steady state is greater in the cross-wind vibration than in the along-wind vibration.
5 Conclusions
In this paper,by establishing a finite element model of equal scale with the actual structure of the cantilever traffic signal and conducting the dynamic analysis of the structure and then numerically simulating the wind vibration response of the structure based on the two-way fluid-solid coupling method,the following conclusions are mainly obtained by analyzing the vibration characteristics of the structure in the cross-wind direction and along-wind direction when subjected to wind loads.
(1) Through the modal analysis of the cantilever traffic signal support structure,the self-vibration frequency and vibration type of the model established in this paper are obtained.The inherent frequency of the structure in the modal analysis is compared with the actual field measurement results of the structure in the literature, and the error is within the acceptable range, which shows the validity of the modeling.In the modal analysis,it can be observed that the maximum response position of the structure occurs at the top of the cantilever pole for each order of vibration mode.Therefore,in the wind vibration response analysis of the structure,the response at this location can be recorded to determine the vibration mode and the vibration degree of the structure under the wind load.
(2) The analysis of the dynamic response time data of the cantilever traffic signal support structure under different wind angle and wind speed conditions shows that the structure produces a larger cross-wind vibration response under wind angles of 90° and 270°.This is because the structure plane is perpendicular to the direction of wind flow when the effective wind area of the structure is the largest.Under the 90° wind angle, the maximum response of the structure gradually increases with increasing wind speed, showing a vibration dispersion state.From 6 m/s,the increase in the displacement response of the structure is approximately linear.According to the vibrationeq response characteristics under the wind angle,the response follows the vibration phenomenon of galloping.Under a wind angle of 270°, the maximum displacement response of the structure occurs at wind speeds of 5 and 6 m/s over the whole wind speed range.Based on the nature of the vibration response, it can be judged that the vibration generated by the structure at a wind speed of 5 m/s at a wind angle of 270°is vortexexcited vibration.
(3) In general, the along-wind displacement response of the cantilever traffic signal structure increases with increasing wind speed.Due to the different effective wind areas of the structure,the size of its displacement response also has some differences.When the effective wind area of the structure is the same,the shape characteristics of the structure will also have some influence on the vibration response of the structure.
(4) The wind vibration displacement of the cantilever traffic signal structure studied in this paper is similar to the vibration of the structure seen in actual engineering.The vibration mechanism of the structure obtained in this paper can provide a reference solution for the design optimization of the actual structure to design a safer structure with a longer service life.
Funding Statement:This research was funded by the National Natural Science Foundation of China(Grant No.51578512)and the Cultivating Fund Project for Young Teachers of Zhengzhou University(Grant No.JC21539028).
Conflicts of Interest:The authors declare that they have no conflicts of interest to report regarding the present study.
 Computer Modeling In Engineering&Sciences2023年1期
- Computer Modeling In Engineering&Sciences的其它文章
- A Fixed-Point Iterative Method for Discrete Tomography Reconstruction Based on Intelligent Optimization
- A Novel SE-CNN Attention Architecture for sEMG-Based Hand Gesture Recognition
- Analytical Models of Concrete Fatigue:A State-of-the-Art Review
- A Review of the Current Task Offloading Algorithms,Strategies and Approach in Edge Computing Systems
- Machine Learning Techniques for Intrusion Detection Systems in SDN-Recent Advances,Challenges and Future Directions
- Cooperative Angles-Only Relative Navigation Algorithm for Multi-Spacecraft Formation in Close-Range