
Process optimization, texture and microstructure of novel kelp tofu
2023-01-22 09:45XianjiangYeLiChenZhichenSuXiaojuanLinJichengChen
食品科学与人类健康(英文) 2023年1期
Xianjiang Ye, Li Chen, Zhichen Su, Xiaojuan Lin, Jicheng Chen*
College of Food Science, Fujian Agriculture and Forestry University, Fuzhou 350002, China
Keywords:Laminaria japonica Aresch Enzymatic hydrolysis Antihypertensive peptide Kelp tofu
A B S T R A C T Laminaria japonica Aresch as an edible and medicine dual-purpose marine algae, has been gradually accepted by people. Tofu was Chinese traditional food, combining kelp function ingredients with tofu has practical value. The extraction-optimization methodology and the sequences of kelp antihypertensive peptide (KAP)were investigated. The sensory, whiteness, water retention ability (WRA) and microstructure of KAP tofu were evaluated. The scanning electron microscope (SEM) results showed KAP addition (20%) significantly improved the tofu texture, with a denser network composed of relatively even pores. Compared with gypsum tofu and glucose-δ-interior fat (GDL) tofu, KAP tofu had significantly higher WRA (94.49 ± 0.49)% and sensory evaluation score value (92.54 ± 0.52), and a significantly lower IC50 value at (2.06 ± 0.04) mg/mL(P < 0.05). The maximum IC50 value (4.14 mg/mL) of kelp enzymatic hydrolysate was observed at enzyme (at an alkaline protease:trypsin ratio of 2:1) concentration 1.5%, temperature 55 °C and time 2 h. The sequences of 8 identified peptides were Lys-Tyr, Phe-Tyr, Gly-Lys-Tyr, Ala-Lys-Tyr, Ser-Lys-Thr-Tyr, Lys-Lys-Phe-Tyr, Lys-Phe-Lys-Tyr and Ala-Lys-Tyr-Ser-Tyr with IC50 values of 5.24, 4.83, 7.94, 7.52, 20.63, 15.33, 10.73 and 2.42 μmol/L, respectively. These results indicated the potential use of KAP tofu as a valuable resource for development of functional foods.
1. Introduction
Tofu was Chinese traditional food and first appeared in the Han dynasty more than 2100 years ago [1]. Conventional tofu is made by coagulating heated soy milk with a coagulant, followed by moulding and pressing the curd to draw the whey. Various coagulants, such as CaSO4, MgCl2, glucose-δ-interior fat (GDL) and microbial transglutaminase, have been used to prepare tofu [2]. The varieties of tofu cannot meet the rapidly growing consumer demand. In addition, the flavor of tofu is not accepted by western consumers [3,4].Therefore, using other active ingredients to make novel tofu products will be a promising way to solve these problems.
Laminaria japonicaAresch is a most common kelp and belongs to the family ofLaminaria. Itis an excellent source of dietary fiber,vitamins, minerals and protein and has been used as a nutritional dietary supplement [5,6]. Bioactive peptides of kelp are amino acid sequences encoded in proteins that can be released after enzymatic hydrolysis. In our previous studies, we found that active ingredients such as kelp antihypertensive peptide (KAP) in kelp can be used as functional food supplements to improve the quality and nutrition of noodles [7]. KAP can inhibit the activity of angiotensin-converting enzyme (ACE), so it is also known as angiotensin-converting enzyme inhibitor peptide. Antihypertensive peptides can competitively bind to the active site of Zn2+in ACE, resulting in inhibition of ACE activity [8].
Seaweed tofu stew as a delicious and healthy dish, is widely consumed in Asian countries and vegetarian diets. The iodine in kelp can make up for the lack of iodine caused by the saponin in tofu. Moreover, eating kelp and tofu together has the effect of losing weight, lowering blood pressure and blood lipi d. But these effects may not be significant enough, and scientific evidence is lacking.So far, there are few reports about making tofu after adding specific substances. Lee et al. found that fermentation of tofu with kimchi seasoning had higher antioxidant activities and free amino acids [9].Guo et al. confirmed the obtained peanut tofu after process optimization had the highest yield with an improved texture [10].Therefore, we intended to make novel kelp tofu to prove and strengthen the effect of eating kelp and tofu together, and improve the structure of tofu. To our knowledge, there are no systematic reports on functional kelp tofu and its characteristics.
The objectives of this research were to optimize kelp enzymatic hydrolysis to obtain KAP, evaluate the additions of antihypertensive peptides fromL. japonicaAresch on the quality of tofu. The related data from whiteness, sensory evaluation score, water retention ability (WRA), texture, ACE inhibitory activity and microstructure of tofu will be analyzed to obtain the optimal combined process parameters.
2. Materials and methods
2.1 Materials
Kelp and soybean were purchased from Yonghui Supermarket Fuzhou. Hip-His-Leu (HHL), trypsin, papain, alkaline protease,angiotensin converting enzyme (ACE), hippuric acid (HA), gypsum,glucose-δ-interior, etc. were purchased from Sinopharm Chemical Reagent Co., Ltd. HCl, Methanol, NaOH etc. solvents were of analytical grade.
2.2 Preparation of kelp crude protein
In this study, kelp was treated by optimized ultrasound-assisted acid hydrolysis [11]. In short, the kelp was degraded at the liquidsolid ratio of 20:1, ultrasonic temperature 50 °C, time 6 h, power 300 W, and the concentration of hydrochloric acid was 2 mol/L. Kelp ultrasonic assisted acid degradation solution was obtained and stored in 4 °C refrigerators.
2.3 Central composite design
In the current study, the effect of enzyme species (papain, alkaline protease, trypsin), the ratio of alkaline protease to trypsin (2:3, 3:2,1:1, 1:2, 2:1), enzyme concentration (0.5%, 1.0%, 1.5%, 2.0%, 2.5%,3.0%), temperature (30, 35, 40, 45, 50, 55, 60 °C), time (2, 4, 6, 8,10 h) and pH (7.0, 7.5, 8.0, 8.5, 9.0) changes to degree of hydrolysis(DH) and IC50of kelp hydrolysate were investigated. And the response surface method was used to predict the best IC50values of each factor.After the enzymatic hydrolysis reaction, the enzyme was inactivated with boiling water for 15 min and centrifuged at 10 000 r/min,4 °C for 15 min to get the supernatant fluid.
2.4 Evaluation of the DH
AnO-pthaldialdehyde (OPA) method was used to determine the content of free amino groups in soluble protein components in the kelp enzymatic hydrolysate [12]. The OPA reagent was prepared by combining the following reagents with water to a volume of 100 mL:75 mL of 0.2 mol/L sodium borate buffer (pH 9.5), 5 mL of 400 g/L SDS solution, 80 mg of OPA (in 1 mL medium methanol) and 0.4 mLβ-mercaptoethanol. The reagent was prepared daily and kept in the dark. Add 3 mL sample to 3 mL OPA reagent. The absorbance of the mixture was measured at 340 nm with an ultraviolet spectrophotometer (UV-2500PC; Shimadzu Corporation, Kyoto,Japan) and taken out after 5 min.L-leucine solution (20 mg/mL) was used as standard. The nitrogen content in enzymatic hydrolysate of kelp was determined by Kjeldahl method [13]. DH of soluble protein components was calculated according to the method reported by Adler-Nissen et al. [14].
2.5 Detection of ACE-inhibition activity
The ACE-inhibitory activity was measured by the HPLC according to our previous method [15]. The standard substance of ACE and HHL was diluted into 5 mmol/L and 0.1 U/mL by dissolving in 100 mmol/L borate buffer (pH 8.3) supplemented with 0.3 mol/L NaCl, respectively. Each peptides-containing sample(40 μL) was mixed with ACE diluent (10 μL) and incubated at 37 °C for 5 min to activate the ACE. The mixture was added with 50 μL of HHL and incubated at 37 °C for 30 min, then added with 200 μL of 1 mol/L HCl and centrifuged at 10 000 r/min for 5 min.The hippuric acid (HA) which transferred from HHL was detected by HPLC in the supernatant. The mobile phase of ultra-pure water(contained 0.05% TFA and 0.05% tri-ethylamine (pH 2.75–2.80)) and acetonitrile were used as the ratio of 85:15. The analyses were carried out at 0.5 mL/min and 35 °C with the column of Waters Xterra MSC18column (4.6 mm × 250 mm I.D., 5 μm). The ACE inhibition of the peptides was calculated according to the following equation:

WhereA1andA2were the peak areas of HA in blank and reaction samples. The IC50value was defined as the concentration of inhibitor required to inhibit 50% of the ACE activity.
2.6 Identification of peptides and sequence analysis
The molecular mass and sequencing of peptides isolated by RPHPLC inL. japonicahydrolysates according to our earlier method were determined by a triple-quadruple mass spectrometer (ABI/Sciex API 4000 + liquid chromatograph-mass spectrometer (LC/MS-MS) systems, Applied Biosystems, Carlsbad, CA) [15]. The sequences were determined according to the result of secondary ion mass spectrometry performed by the same system. Multiple reaction monitoring (MRM) scans for optimization of MRM Q1/Q3 ion pairs were conducted with both Q1 and Q3 set to unit resolution (0.6–0.8 Da full width at half-height) while the collision energy was ramped(5–120 V in 2 V increments). The collision energy of each small peptide was optimized using simple formulas that directly correlate collision energy voltages with precursorionm/z. The activities of known bioactive peptides were identified using bioactive database(http://www.uwm.edu.pl/ biochemia/index.php/pl/biopep) [16] and antihypertensive peptide database (http://crdd.osdd.net/raghava/ahtpdb/pepsearch.php). The identified peptides were chemically synthesized by GL Biochem (Shanghai, China). The purity of the synthesized peptides was greater than 97% as determined by HPLC and sequences were verified by analytical HPLC-MS/MS.
2.7 Preparation of tofu
In this study, we fabricated the tofu by following method of Wang et al. [17] with some modification. The soybeans (300 g) were washed and immersed in water for 12 h at room temperature. Drained the soaked beans and mixed with water in a blender (A76, Moulinex,Paris, France) for 10 min to obtain a water-to-dry bean ratio of 10:1(based on weight). With casional stirring, cooked the boiling material at boiling temperature for 15 min. The hot mash was then filtered through double cheesecloth and the soy milk was cooled to about 80 °C. Added the prepared KAP and coagulant. The coagulant should be dissolved with a small amount of water before being mixed into the soybean milk to avoid uneven. Mixed soy milk, KAP and coagulant and set at 80 °C for 20 min. Transferred the curd to a wooden box(13 cm × 9 cm × 7 cm) lined with cheesecloth and pressed for 30 min with a 1 kg weight placed on the top. Then took the tofu out of the box and immersed it in water. The effects of the ratio of gypsum to GDL, KAP concentration, the ratio of soybean to water and coagulant concentration on the texture, WRA, whiteness and sensory evaluation score of tofu were investigated in the production project.
2.8 Texture analysis of tofu
A texture analyzer (TA-XT PLUS, US) with operating software Texture Expert was used in texture analysis. The texture profile analysis (TPA) option applied in cheese analysis [18,19] was used with some modifications to monitor the physical characteristics of tofu. The following texture parameters were obtained or calculated from the TPA curve to describe the texture of the tofu: hardness,springiness, cohesiveness and chewiness. Before testing, all samples were kept at ambient temperature for 1 h. In sampling, a stainless steel core with an inner diameter of 23 mm was used. Cut the prepared sample to a height of 20 mm and placed it on the sample holder in the texture analyzer. An acrylic probe with a diameter of 10 mm was used in the analysis. In two consecutive compression cycles, each sample was axially compressed to 50% of its original height. The test speed, time, distance and trigger force were 1.0 mm/s, 5.0 s, 10.0 mm and 5.0 g, respectively. The number of samples analyzed was 6. The hardness,springiness, cohesiveness and chewiness were calculated by the software of the instrument based on the force-time curve generated.
2.9 Determination of WRA of tofu
WRA was determined according to a modification of the waterholding capacity method of Puppo et al. [20]. About 5 g (w1) tofu was placed on a cotton cloth membrane maintained in the middle position of a 250 mL centrifuge tube (62 mm × 120 mm). The sample weight was recorded after centrifugation at 120gfor 5 min at 15 °C (w2) and subsequent heating to a constant weight (w3) at 105 °C. The WRA of tofu was calculated as follows:

2.10 Determination of L*, a*, b* and whiteness
L* (lightness),a* (redness/greenness), andb* (yellowness/blueness) of tofu was determined by using automatic colorimeter(Model ADCI-60-C, Chentaike Instrument Technology Co., Ltd.,Beijing, China). Calibrated the colorimeter using black and white reference tiles. Cut the tofu into cubes (30 mm × 30 mm ×30 mm). The color value was measured using 3 cubes per batch and 3 measurements per cube (the reported average value). Use the following formula to calculate whiteness:

2.11 Sensory assessment
The tofu was cut into 30 mm × 30 mm × 30 mm blocks and served in Petri dishes with covers to evaluate their sensory attributes. Sensory evaluations were performed by 100 trained panelists who were graduate students (50 females and 50 males from 21 to 28) at Fujian Agriculture and Forestry University. They were all familiar with tofu products and employed three training sessions with commercial and experimental tofu. Each attribute was assessed by the panelist and consensus of the attribute was reached during the training. The special flavor and overall acceptability were selected as sensory criteria according to the method of Kim et al. [21]. In addition, color and luster, organization structure and mouthfeel were also used as sensory factors. The scores were analyzed using a percentage grading system, and the scoring criteria were shown in Table S1. During tofu product evaluation, talking among panelists was not allowed. A fork,a pencil, and a cup of spring water were prepared for each panelist.All tofu products were placed in random order and panelists had the freedom to evaluate the tofu products in the order they liked. Sample evaluations were repeated once at a different date. The average value was taken as the final result.
2.12 Microstructure examination
As mentioned earlier, scanning electron microscopes (SEM)were used for microstructure inspection [22]. Cut small pieces from different tofu samples. After fixation with 2% glutaraldehyde in 0.1 mol/L sodium phosphate buffer (pH 7.2) overnight, all samples were transferred to microporous specimen capsules (Plano, Wetzlar,Germany). Dehydration (in the graded ethanol and acetone series,respectively), the critical point of drying with liquid carbon dioxide,and gold plating in a sputter coater were also the same as the reference instructions. The sample was observed in the microscope chamber of a scanning electron microscope (S-3400N, Hitachi, Japan) using an acceleration voltage of 5.0 kV.
2.13 Preparation of tofu extract
The prepared tofu was extracted with ethanol/water-based extraction solvent with ethanol/water ratio of 4:6 according to the method of Hang et al. [23]. The extraction was carried out as follow:mixed 75 g tofu with 250 mL solvent in a plastic beaker at room temperature to obtain a weight (kg)-volume (L) ratio of 3:10 (m/V),using a homogenizer (model DS-1; Shanghai Jingke Co., Ltd.)homogenized at 10 000 r/min for 2 min, centrifuged at 4 000 ×gfor 20 min, and then filtered through filter paper (Whatman 40) to obtain a soluble extract. The extract was evaporated under vacuum at 50 °C to remove ethanol, and then reconstituted to 250 mL with water. The prepared solution was used to determine the ACE inhibitory activity.
2.14 Statistical analysis
The data of this experiment collected were analyzed with the Student’s t-test. The level of significance was established atP< 0.05.Each experiment was performed at least three times and the data were used for statistical purposes.
3. Results and discussions
3.1 Optimization of enzymatic hydrolysis conditions and statistical analysis
The sample hydrolyzed with alkaline protease or trypsin in the pretreatment solution of kelp had higher DH than papain in Fig. 1A.The hydrolysates of alkaline protease and trypsin had lower IC50and the alkaline protease was the lowest. A high DH may be associated with a low IC50value. This was because the ACE inhibitory peptides were mostly small molecule peptides, and the high DH may be necessary to obtain more hypotensive peptides [24,25].In this study,alkaline protease and trypsin were selected for enzymatic hydrolysis to obtain KAP. The DH and IC50were connected with the ratio of alkaline protease to trypsin. In Fig. 1B, when the ratio of alkaline protease to trypsin was 2:1, kelp enzymatic hydrolysate had the highest DH and the lowest IC50. In Fig. 1C, when the addition of mixed enzyme range from 0.5% to 2.0%, the DH showed positive correlation and IC50showed an opposite trend. When the amount of enzyme added was more than 2.0%, the DH was basically unchanged and IC50value was increased. In Fig. 1D, when the temperature was 50 °C, the hydrolysis degree and IC50value reached the maximum and minimum, respectively. As shown in Fig. 1E, when enzymatic hydrolysis time was 4 h, although DH is not the maximum, IC50had reached the lower limit. Enzymatic hydrolysis of proteins was a complex and dynamic process [26]. With the prolonging of enzymatic hydrolysis time, ACE inhibitory peptides produced in the enzymatic hydrolysis system may also be degraded to low-activity,inactive peptides and free amino acids, or some active groups may be destroyed, thereby reducing or losing the inhibition of ACE.This indicated that there was no correspondence between enzymatic hydrolysis time, DH and ACE inhibition rate. The high DH does not necessarily lead to high ACE inhibition activity, which was similar to the results report by Jamdar et al. [27]. Reports had found that the ACE inhibitory activity was not the strongest at the highest DH of peanut protein. Different types of enzymes have their own optimum pH. In this paper, alkaline protease and trypsin were mixed for enzymatic hydrolysis, so the optimal pH should be determined experimentally. In Fig. 1F, the pH come to 8.5, the DH reached a maximum value around 71.43% and the IC50reached a minimum value around 5.49 mg/mL. We chose pH 4.8 as the optimal condition for subsequent experiments.
In this study, factors C (enzyme concentration), D (temperature)and E (time) showed a better inhibition effect on ACE. To design the response surface experiment, the enzyme concentration, temperature and time were chosen to be influencing factors and the IC50of ACE inhibitory activity was response value (Table S2).
The multiple regression analysis of the experimental data showed that the response variable and the test variable were related through the following second-order polynomial equation:
Y(IC50) = 6.15 + 0.43 ×A- 0.14 ×B+ 0.34 ×C+ 0.15 ×A×B+0.073 ×B×C- 0.29 ×A2- 0.19 ×B2- 0.37 ×C2
The statistical significance of the regression model was checked byF-Test andPvalue. Table S3 showed the analysis of variance of the response surface quadratic model. The smallPvalue for the model implied the model was extremely significant (P< 0.000 1). ThePvalue for the “lack of fit” test was 0.174 8, which indicated that the quadratic model was adequate. Moreover, the determination coefficient (R2=99.59%), AdjR-squared (R2Adj= 99.92%) and coefficient of variance(CV = 0.46%) suggested that the model showed a fitting degree and small error, moreover, it’s also had good experimental stability.
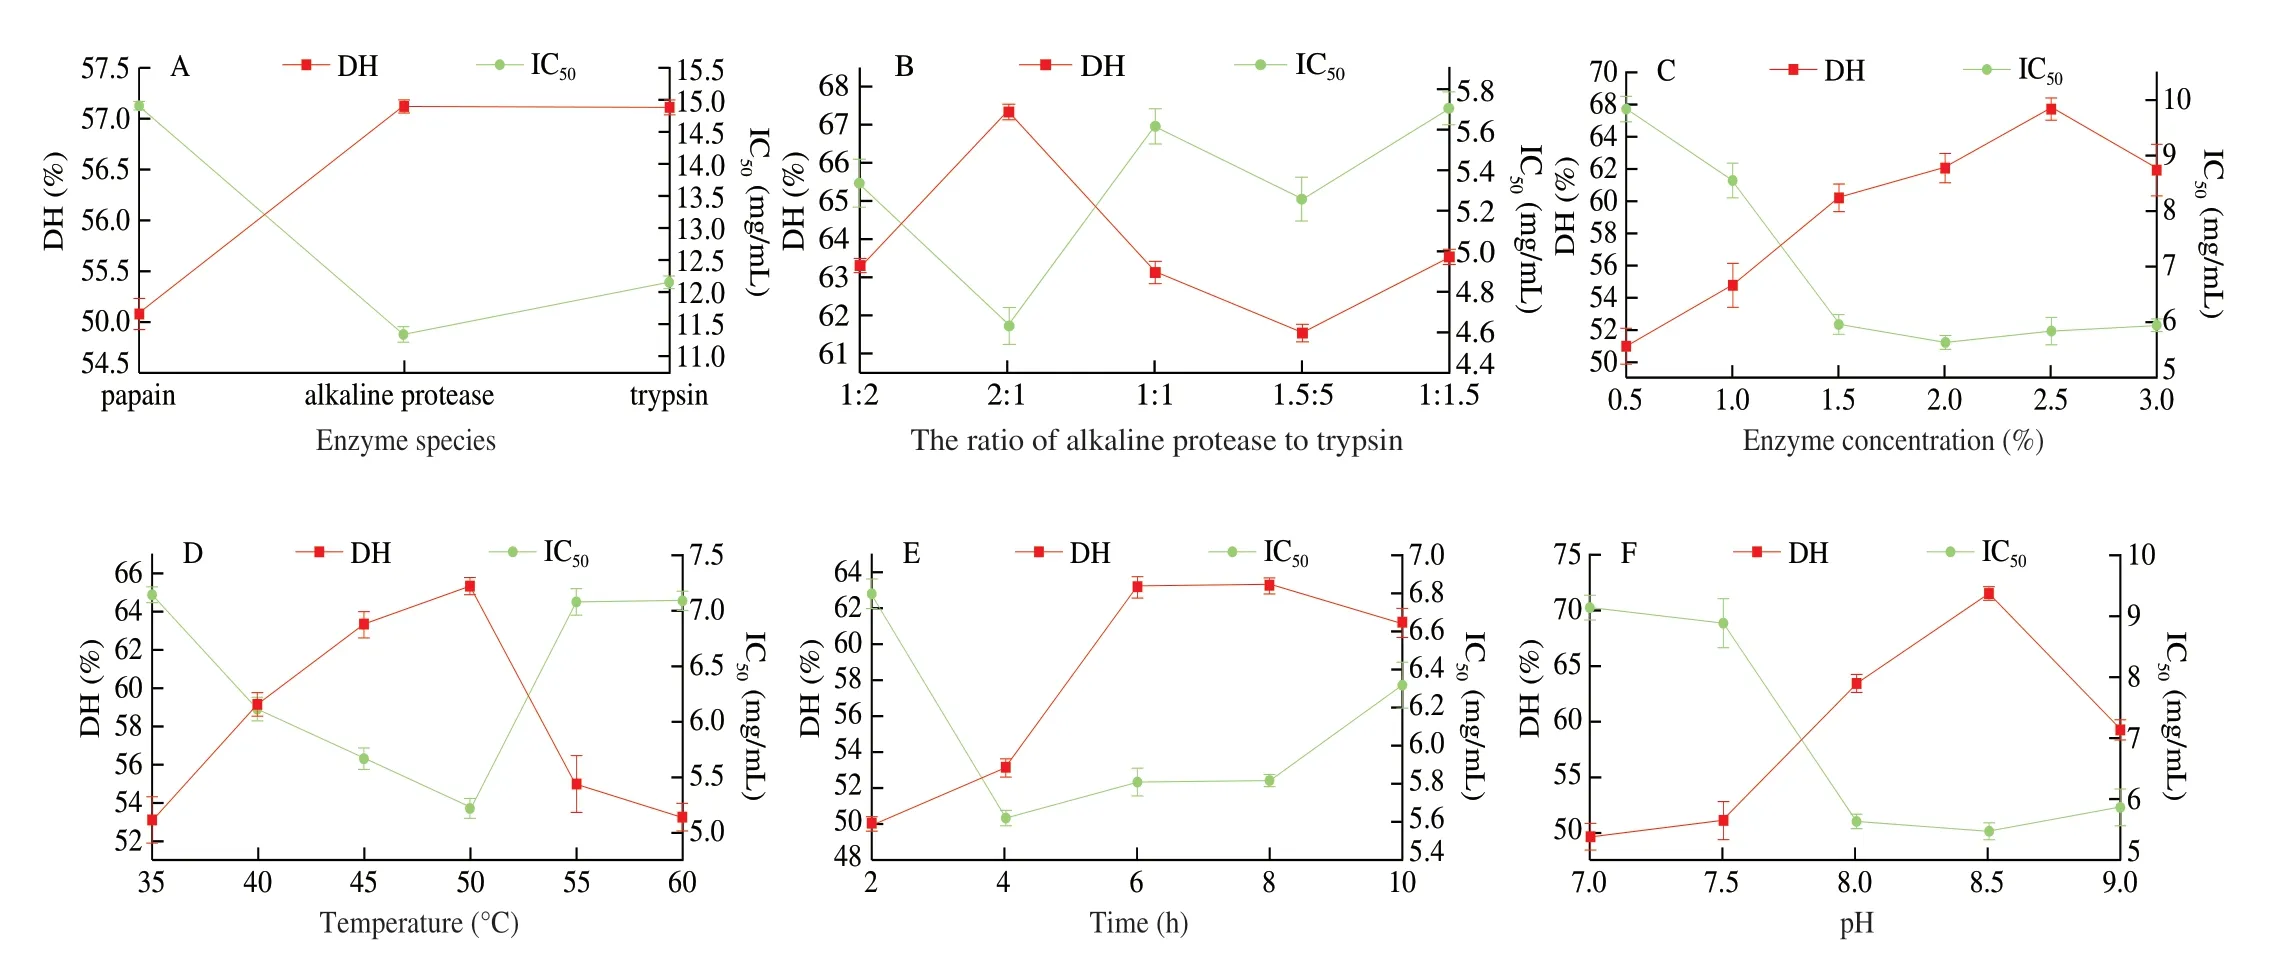
Fig. 1 Effects of enzyme species (A), the ratio of alkaline protease to trypsin (B), enzyme concentration (C), temperature (D), time (E), and pH (F) on DH and IC50 value of enzymatic hydrolysate.
The interaction coefficients AB was found to be extremely significant (P< 0.01) and BC was significant (P< 0.05) in Table S3.In order to better understand the predictive results of the models, the response surface diagrams of the IC50of enzymatic hydrolysate threedimensional graphs are shown in Fig. 2. The formed surface enzyme concentration and temperature were steep in Fig. 2A, moreover, in Table S3,P< 0.01, which indicated that the interaction was extremely remarkable. And the contour in enzyme concentration was denser,which indicated that enzyme concentration showed a high effect on IC50compared with temperature. In Fig. 2B, temperature and time formed a very steep surface, the interaction between those two poles was extremely significant (P< 0.01, Table S3). Time direction contour was intense, that time effect on IC50was greater than that of temperature. Enzyme concentration and time formed surface was relatively gentle showed in Fig. 2C, there was no significant interaction between them (P> 0.05, Table S3). Furthermore, enzyme concentration contour was intense, which informed that enzyme concentration dosage effect on IC50than time.
The optimal combination of enzymatic hydrolysis conditions was as follows: enzyme concentration was 1.5%, temperature was 55 °C, time was 2 h, respectively, and the optimal prediction IC50of enzymatic hydrolysate was 4.16 mg/mL. In order to verify the suitability of the model equation for predicting the optimum response values, three parallel experiments were tested using the recommended optimum conditions. The IC50of each enzymatic hydrolysate were determined. The mean experimental IC50was 4.14 mg/mL, and there was no significant difference between the results and the predicted value (P> 0.05), which indicated that the model was feasible.
3.2 Amino acid sequencing of KAP
The sequences of 8 small peptides were calculated based on molecular ion, quantitative fragments and qualitative fragment. The accurate relative molecular mass of the peptide, deduced from them/zvalue of (M + H)+by subtraction of one mass unit for the attached proton, were 309.5 (Fig. 3A) and 328 Da (Fig. 3B). The MS/MS spectrum of them/z310.55 peak and 329.24 peak were used to analyze the peptide sequence by de novo sequencing, and the dipeptide Lys-Tyr (KY) and Phe-Tyr (FY) were identified. KY and FY were synthesized and the IC50was determined to be 5.24 and 4.83 μmol/L. Similarly, the tripeptides Gly-Lys-Tyr (GKY) with a molecular weight of 366.5 Da (Fig. 3C) and Ala-Lys-Tyr (AKY)with a molecular weight of 380.5 Da (Fig. 3D) were identified,and the IC50value were 7.94 and 7.52 μmol/L, respectively. The tetrapeptides Ser-Lys-Thr-Tyr (SKTY), Lys-Lys-Phe-Tyr (KKFY)and Lys-Phe-Lys-Tyr (KFKY) were identified with a molecular weight of 497 (Fig. 3E), 584.94 (Fig. 3F) and 585 Da (Fig. 3G),respectively. The IC50value were 20.63, 15.33 and 10.73 μmol/L.In addition, a pentapeptide Ala-Lys-Tyr-Ser-Tyr (AKYSY) was isolated and identified from kelp enzymatic hydrolysate. Its molecular weight was 631 Da (Fig. 3H), which had the highest ACE inhibitory activity (IC50= 2.42 μmol/L). The data were similar to the IC50values of 4 tetrapeptides (Ala-Ile-Tyr-Lys, Tyr-Lys-Tyr-Tyr, Lys-Phe-Tyr-Gly and Tyr-Asn-Lys-Leu) reported by Suetsuna et al. [28].According to the structure of 8 small peptides, all of them are Tyr-terminated peptides. It has been reported that hydrophobic or aromatic amino acid residues or Pro (P) at the C-terminus and branched aliphatic amino acids at N-terminal positively contributed to the improvement of ACE inhibitory potency [29,30].
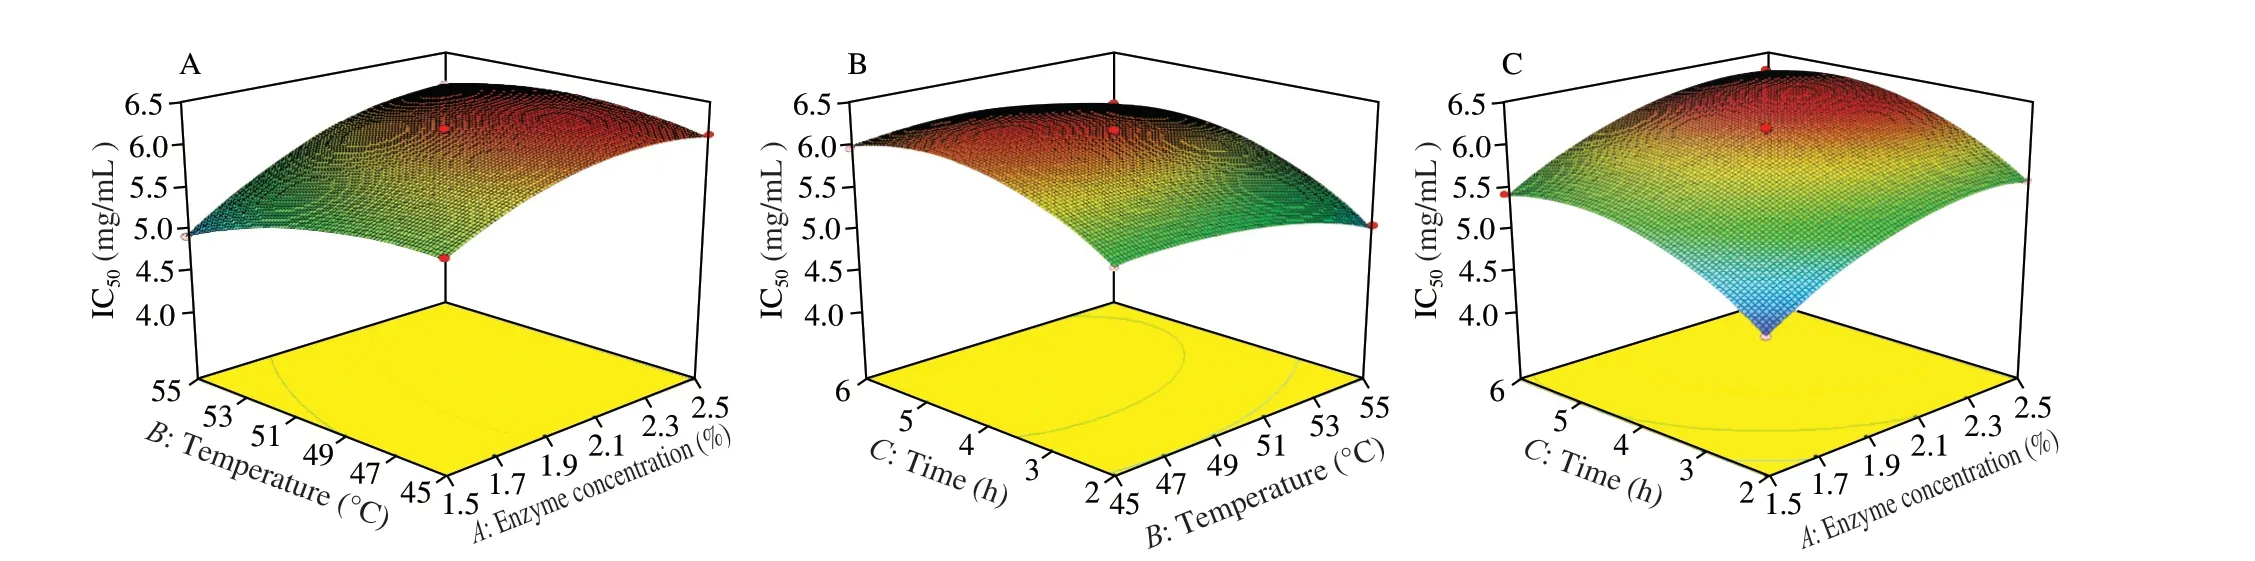
Fig. 2 3D response surface diagrams showing the effects of the mutual interactions between two independent variables. (A) Enzyme concentration and temperature; (B) temperature and time; (C) enzyme concentration and time.
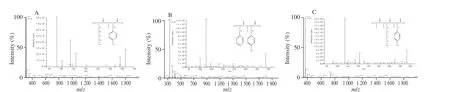
Fig. 3 The mass spectrogram of HPLC/ESI-MS and HPLC/ESI-MS/MS of peptides in kelp enzymatic hydrolysate. (A) KY; (B) FY; (C) GKY; (D) AKY;(E) SKTY; (F) KKFY; (G) KFKY; (H) AKYSY.

Fig. 3 (Continued)
3.3 Optimization of KAP tofu production process
The effects of different factors on the whiteness, sensory evaluation score and WRA of tofu were shown in Fig. 4. When the ratio of gypsum to GDL was 2:1, the WRA, sensory evaluation score,cohesiveness and chewiness of tofu were higher than other types in Fig. 4A and Table 1. Acid coagulant gluconic acidδ-lactone and salt coagulant gypsum were two different types of coagulants, which had different effects on the molding of tofu due to their different principles when added to soybean milk [31]. When soybean milk was heated,the GDL was broken down into gluconic acid, resulting in a decrease in the pH of the system. Protein molecules became facultative ions as acidity increases. Calcium ions could break the double electric layer of the protein and the membrane of hydration to make tofu solidify.
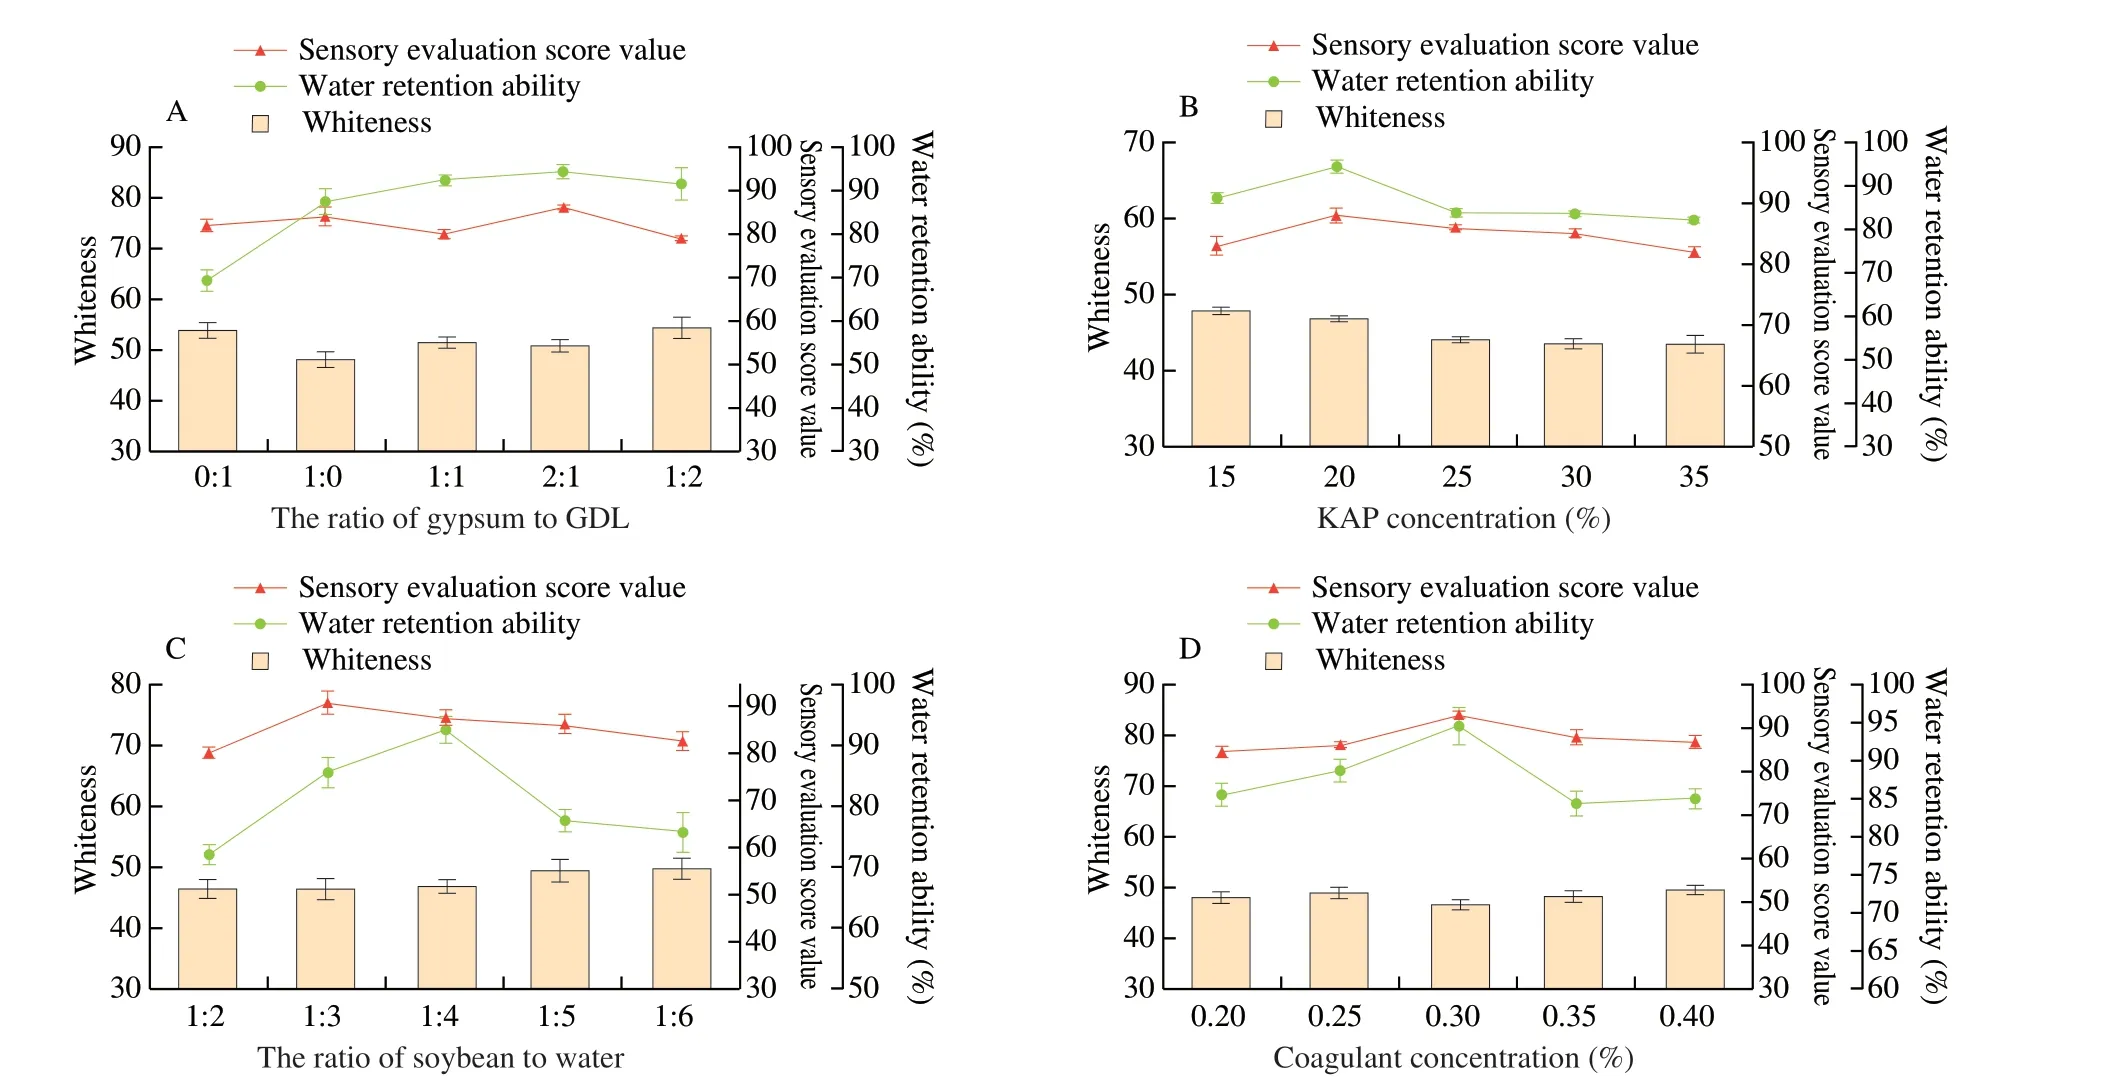
Fig. 4 Effects of different factors on the whiteness, sensory evaluation score and water retention ability of tofu. (A) The ratio of gypsum to GDL; (B) KAP concentration; (C) the ratio of soybean to water; (D) coagulant concentration.
When the addition of KAP range from 15% to 20%, the WRA and sensory evaluation score showed positive correlation with KAP concentration in Fig. 4B. At a concentration of 20% KAP,both of them reached a maximum. Meanwhile, KAP tofu also had good hardness, springiness and chewiness in Table 1. However, the whiteness of tofu decreased with the concentration of KAP. Under the condition of low concentration neutral salt, NaCl in KAP neutralized the charge in soybean milk and reduced the electrostatic repulsion between chains, thus forming a gel. However, with the increase of NaCl concentration, the reaction of hydration in proteins was intensified. That broke the secondary bonds of protein molecules in soybean milk, weakened the intermolecular coagulation, and reduced the hardness of tofu and other parameters.
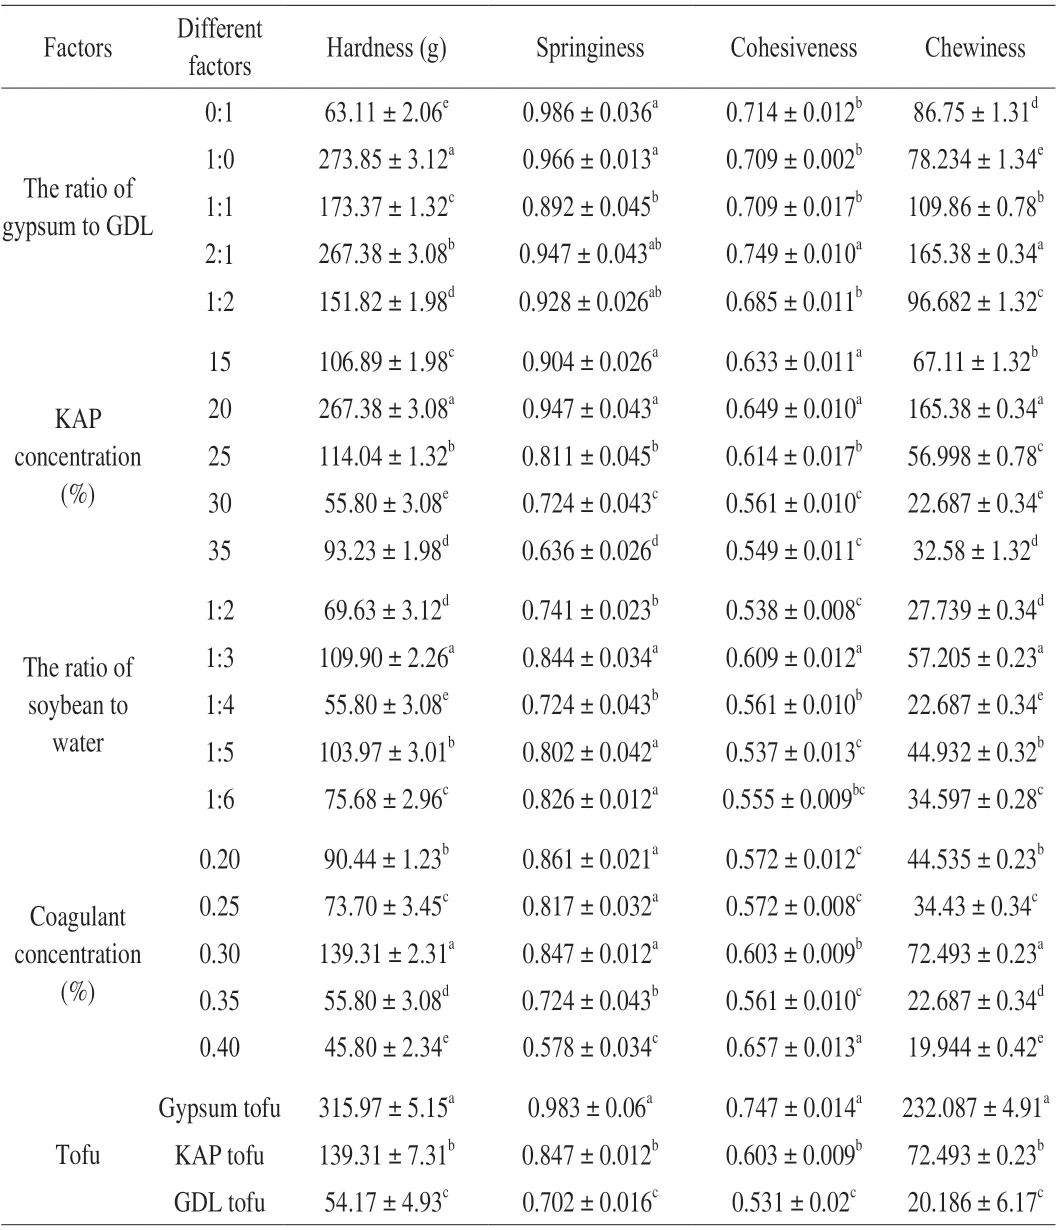
Table 1 Effect of different factors on the textural parameters of tofu.
With the decrease of ratio of soybean and water, the sensory evaluation score and WRA of tofu increased first and then decreased,while the whiteness increased continuously (Fig. 4C). The hardness,springiness, cohesiveness and chewiness degree of texture parameters were higher than other concentrations when the ratio of soybean and water was 1:3 (Table 1). This may be due to there was too much water at the beginning of the grinding process, the soybean could not fully touch blade and the grinding process was uneven, which resulted in low water retention rate and affected the texture of tofu. When the addition of water excessive, the soybean protein in the flocculation decreased due to the decrease of soybean milk concentration, which made texture of tofu heterogeneous.
In Fig. 4D, the WRA and sensory evaluation score were increased with the addition of coagulant (0.2%–0.3%) and the maximum WRA and sensory evaluation score reached to 94.5 and 92.5, respectively.When the addition of coagulant excessive, tofu became softer and result in bad chewiness. This was because the addition of the coagulant neutralized the negative charge on the surface of the protein and approached the isoelectric point, soybean milk turned into a gel [32].However, if the coagulant was too much, tofu was difficult to shape and loosed in structure.
3.4 Comparison of KAP tofu and commercial tofu
With the optimized conditions above, we made tofu and compared it with the tofu on the market to evaluate whether kelp tofu has market acceptability. The microstructure of gypsum tofu, GDL tofu and KAP tofu was examined by SEM technique. Scanning electron micrographs obtained were shown in Fig. 5, which revealed clearly microstructure differences. The protein network mesh of gypsum tofu was small and dense in Fig. 5A. The GDL tofu (Fig. 5B) existed as a typical protein network structure with more open space, and it had a looser microstructure than gypsum tofu. KAP tofu in Fig. 5C was prepared by combining two coagulants with KAP. Under the interaction of gypsum and GDL on the protein, the microstructure showed tofu had a compact and uniform structure after process optimization, combined with the characteristics of gypsum tofu and GDL tofu. The texture characteristics of gypsum tofu, GDL tofu and KAP tofu were quite different as shown in Table 1. Compared with gypsum tofu, the KAP tofu had lower hardness, springiness, cohesiveness and chewiness.However, the textural parameters of KAP tofu were significantly higher than that of GDL tofu. In Fig. 5D, the WRA and sensory evaluation score of KAP tofu were significantly higher than that of gypsum tofu and GDL tofu (P< 0.05). The gypsum tofu and GDL tofu used a single solidifying agent gypsum and formed the gel quickly,so the structure of gypsum tofu was rough and hard while inner fat bean curd was fragile. The IC50value of KAP tofu was significantly lower than that of the other two kinds of tofu (P< 0.05). Nishibori et al. found that soy pulp which was known as a by-product of the production of bean curd showed significant hypertensive activity [33].In addition, magnesium could enhance the inhibitory effect of ACE in tofu. Tofu contained active peptides from soy protein, and the addition of KAP increased the amount of ACE inhibitory peptides.The peptides we identified from KAP showed good activities, which made the hypotensive effect of KAP tofu more prominent.

Fig. 5 Scanning electron microscopy and properties of different tofu. (A) Gypsum tofu; (B) KAP tofu; (C) GDL tofu; (D) The water retention ability, sensory evaluation score, whiteness and IC50 of tofu. Different letters ‘A–C’ (water retention ability) and ‘a–c’ (sensory evaluation score value) represent significant differences. (P < 0.05). #P < 0.05 (whiteness) and *P < 0.05 (IC50) mean statistically significant difference compared to the KAP tofu.
4. Conclusions
The present work was conducted to develop food combining the kelp antihypertensive peptide with tofu. Results obtained that KAP,gypsum and GDL used together were helpful to enhance the quality of tofu including the WRA, sensory evaluation score and microstructure.Eight peptides were identified and synthesized to determine the IC50value from kelp enzymatic hydrolysate as Lys-Tyr (IC50: 5.24 μmol/L),Phe-Tyr (4.83 μmol/L), Gly-Lys-Tyr (7.94 μmol/L), Ala-Lys-Tyr(7.52 μmol/L), Ser-Lys-Thr-Tyr (20.63 μmol/L), Lys-Lys-Phe-Tyr(15.33 μmol/L), Lys-Phe-Lys-Tyr (10.73 μmol/L), Ala-Lys-Tyr-Ser-Tyr (2.42 μmol/L). The IC50of KAP tofu was (2.06 ± 0.04) mg/mL,lower than that of gypsum tofu and GDL tofu. The results of present study indicated that the active ingredients of kelp could be consumed as a functional food supplement to improve the quality and nutrition of tofu. In addition, this study can provide references for the preparation of functional foods.
Conflicts of interest
The authors declare that they have no known competing financial interests or personal relationships that could have appeared to influence the work reported in this paper.
Acknowledgments
This work was supported by the Natural Science Foundation of Fujian Province (2020J01558) and the Expert Workstation of Fuzhou Hailin Food Co., Ltd.
Appendix A. Supplementary data
Supplementary data associated with this article can be found, in the online version, at http://doi.org/10.1016/j.fshw.2022.07.029.
- 食品科学与人类健康(英文)的其它文章
- Wine, beer and Chinese Baijiu in relation to cardiovascular health:the impact of moderate drinking
- Comparative analysis of physicochemical properties, ginsenosides content and α-amylase inhibitory effects in white ginseng and red ginsen
- Monitoring and identif ication of spoilage-related microorganisms in braised chicken with modif ied atmosphere packaging during refrigerated storage
- Effect of cooking processes on tilapia aroma and potential umami perception
- Formation mechanisms of ethyl acetate and organic acids in Kluyveromyces marxianus L1-1 in Chinese acid rice soup
- Volatile prof ile and multivariant analysis of Sanhuang chicken breast in combination with Chinese 5-spice blend and garam masala