
Effect of ionic strength and mixing ratio on complex coacervation of soy protein isolate/Flammulina velutipes polysaccharide
2023-01-22 09:45JunmioZhngHengjunDuNingLeiZhongGoxingFeiPeiHuiChenQiuhuiHu
食品科学与人类健康(英文) 2023年1期
Junmio Zhng, Hengjun Du, Ning M, Lei Zhong, Goxing M,Fei Pei, Hui Chen,d, Qiuhui Hu,*
a Key Laboratory of Edible Mushroom Processing, Ministry of Agriculture and Rural Affairs, College of Food Science and Engineering,Nanjing University of Finance and Economics, Nanjing 210023, China
b Department of Food Science, University of Massachusetts, Amherst MA 01003, USA
c College of Food Science and Technology, Nanjing Agricultural University, Nanjing 210095, China
d Jiangsu Alphay Bio-technology Co., Ltd., Nantong 226009, China
Keywords:Soy protein isolate Flammulina velutipes polysaccharide Electrostatic interaction Complex coavervation Storage modulus
A B S T R A C T Soy protein isolate (SPI) is a commercial protein with balanced amino acids, while the poor solubility impedes its use in traditional foods. To overcome the problem, the complex coacervation of SPI/Flammulina velutipes polysaccharide (FVP) were investigated. Initial results revealed that the suitable amounts of FVP contributed to reducing the turbidity of SPI solution. Under electrostatic interaction, the formation of SPI/FVP coacervates were spontaneous and went through a nucleation and growth process. Low salt concentration (CNaCl = 10,50 mmol/L) led to an increase in the critical pH values (pHc, pHφ1) while the critical pH values decreased when CNaCl ≥ 100 mmol/L. The concentration of NaCl ions increased the content of α-helix. With the increase of FVP, the critical pH values decreased and the content of β-sheet increased through electrostatic interaction.At SPI/FVP ratio of 10:1 and 15:1, the complex coacervation of SPI/FVP were saturated, and the coacervates had the same storage modulus value. SPI/FVP coacervates exhibited solid-like properties and presented the strongest storage modulus at CNaCl = 50 mmol/L. The optimal pH, SPI/FVP ratio and NaCl concentration of complex coacervation were collected, and the coacervates demonstrated a valuable application potential to protect and deliver bioactives and food ingredients.* Corresponding author at: Key Laboratory of Edible Mushroom Processing, Ministry of Agriculture and Rural Affairs, College of Food Science and Engineering, Nanjing University of Finance and Economics,Nanjing 210023, China.
1. Int roduction
Protein/polysaccharide complexes and coacervates mostly originate from electrostatic interactions between oppositely charged macromolecules. Recently, protein/polysaccharide coacervates have been widely used in the food, cosmetic and pharmaceutical industries to protect and encapsulate bioactive compounds and odors [1,2].Among these applied f ields, an increasing interest about protein/polysaccharide complexes and coacervates is paid in the food because of the excellent structural and functional features, such as emulsion stabilizers, fat substitutes, and biodegradable packaging materials [3,4].
In order to make better use of protein/polysaccharide coacervates,it is necessary to fully understand the structural characteristics of the coacervates. And in recent years, the function, structure and conformation of protein/polysaccharide complexes have been studied by researchers with various spectral techniques. Li et al. [5] reported that with the content of theβ-sheet increased, rapeseed protein isolategum Arabic (GA) emulsions were more stable. The conformational switch ofβ-lactoglobulin-GA complexes were disclosed by circular dichroism [6]. Sugar beet pectin could change the secondary structure of SPI molecules and ultimately form the cross-linked interpenetrating gels with good mechanical properties [7]. Food is a complicated system and many factors influence the quality of foods, including composition and preparation conditions. Preparation conditions,including pH, ionic strength, the ratio of macromolecules, is crucial for the formation protein/polysaccharide coacervates [8,9]. Therefore,the comprehensive exploitation of the function and corresponding structure of protein/polysaccharide complex coacervation is vital for the design of new functional foods under different food processing surrounding.
Protein/polysaccharide solution could lead to the formation of soluble and insoluble complexes as a function of pH, resulting in the crease of turbidity value slightly [10]. Then the process of complex coacervation was elucidated by employing turbidity curve. In this case, critical pH values were determined by curves of the turbidity,including pHcrelated with the formation of soluble complexes, pHφ1associated with macroscopic changes and pHoptconcerned with the peak of turbidity [11]. Through critical pH values changes, the turbidity curve was often used to reveal the influence of different factors on protein/polysaccharide complex coacervation.
Soy protein isolate (SPI) is the most important plant-derived protein source owing to its well-balanced amino acid composition [12].However, the poor solubility of SPI limits its application in the traditional food industry. To overcome the problem, the complex coacervation of SPI/polysaccharide were considered to ameliorate SPI. And nowadays the complex coacervation of SPI/polysaccharide was reported and available in the food industry [13].Flammulina velutipes, one of the most common economic edible mushrooms,has been under large-scale artificial cultivation all over the world.As the major active component,F. velutipespolysaccharide (FVP)presented a variety of biological activities such as immune regulation,anti-inflammatory, anti-virus, and anti-tumor activities [14]. FVP have also widely been applied in the food industry for the outstanding functional properties. Chen et al. [15] reported nanoparticles of FVP as a stabilizer to prepare oil/water pickering emulsion , which partly replaced the original fat of typical emulsified sausage. The edible FVP film had the optimal mechanical property and good barrier property to water and oxygen [16]. Our previous work found that FVP has the optimal gelling property and higher charge density. The hydrogel of SPI/FVP coacervates had excellent water holding capacity and was used in culture cells [17]. However, the complex coacervation of SPI and FVP was unclear so that it is necessary to investigate different preparation conditions and corresponding structure of SPI/FVP complex coacervation.
In order to reveal the SPI/FVP complex coacervation, the turbidity, structure and the rheological property were determined with various techniques. Among these detection methods, the turbidity curve depicted phase behavior and critical pH values. Confocal laser scanning microscope (CLSM) observed the microscopic characteristics of SPI/FVP coacervates. The dynamic rheological properties reflected the macroscopic characteristics of SPI/FVP coacervates. Conformations of SPI/FVP complexes were measured by Fourier transform infrared spectroscopy (FT-IR). The information was useful to better prepare the SPI/FVP complexes or coacervates under an intricate food system. And structural characteristics of the SPI/FVP complexes or coacervates were also evaluated to provide the useful information for the development of traditional food.
2. Materials and methods
2.1 Materials
Soy protein isolate (SPI, S9510), purchased from Solarbio Science& Technology Co. Ltd. (Beijing, China), had a protein content of 87.5% (%N × 6.25, dry base), ash content of 5%.F. velutipesderived from Tianfeng Biological Technology Co., Ltd. (Nanjing,China). FVP was obtained from freshF. velutipesaccording to the method of Yang et al. with some modifications [18]. Briefly, 10 gF. velutipespowder was immerged into 200 mL deionized water at 80 °C. The water extract was centrifuged at 8 000 r/min for 10 min.The supernatant was mixed with 4-fold volume anhydrous ethanol(ethanol final concentration, 80%) for 4 h and centrifuged at 10 000 r/min for 30 min. The precipitate was washed with 95%ethanol and then filled in a 3 500 Da dialysis bag and dialyze for 2–3 days until the solution was uniform. Finally, the solution was lyophilized to yield FVP sample. FVP powder contains 89%carbohydrate, 1% protein (%N × 6.25) and 3% crude ash. All other reagents were of analytical grade and purchased from Solarbio Science & Technology Co. Ltd (Beijing, China).
2.2 Preparation of SPI/FVP aqueous complex
SPI and FVP stock solution (1%m/V) were obtained by dissolving powder in distilled water followed by stirring (800 r/min) at room temperature for 4 h and then overnight at 4 °C. Various weight ratios (r= 1:1, 4:1, 10:1, 15:1 and 20:1) of SPI/FVP aqueous solution were obtained by adding stock solutions, and the total content of biopolymers was fixed at 0.05% (m/V). Meanwhile, the effect of ionic strength on SPI/FVP complex formation (r= 4:1) was investigated by utilizing different concentrations of NaCl (CNaCl= 10, 50,100, 200 mmol/L).
2.3 Turbidity measurement
The intensity of light (I) that passes through SPI/FVP solution was determined with UV-vis spectrometer (UV-2000, Mapada Instruments Co., Ltd., Shanghai, China) under 600 nm. pH value of SPI/FVP solution was measured dynamically by a pH meter(STARTER5000, Science Instruments Co. Ltd, Suzhou, China). The measurement method was as follows: the initial pH value of SPI/FVP mixtures was adjusted to 7.0 ± 0.2 and then acidified by the titration of HCl solutions (0.1, 0.25, 0.5 mol/L). When the pH value changed by 0.05–0.2, 200 μL SPI/FVP solution was drew and the intensity of light of the solution was determined by UV-vis spectrometer. Repeat the above operation until the solution reached about pH 2.0. In order to ensure that the pH meter could accurately measure the dynamic changes of the pH of the SPI/FVP solution, the entire titration process was carried out under magnetic stirring (Heidolph Tec, Shanghai,China) at a speed of 200 r/min. All measurements were conducted at(25 ± 1) °C and repeated three times. Take distilled water as a blank control and set its transmittance to 100%, the turbidity value was defined as 100-T (%)
WhereIis the intensity of light that passes through a volume of SPI/FVP mixtures andI0is the incident light intensity.
2.4 ζ-Potential determination
ζ-Potential and the electrophoretic mobility of SPI, FVP and SPI/FVP solution (0.05%) with various pH values (2.0, 3.0, 4.0,5.0, 6.0 and 7.0, respectively) and various ionic strength (0, 10, 50,100 and 200 mmol/L, respectively) were measured by ZS Zetasizer Nano (ZS-90, Malvern Instruments, UK). All measurements were conducted at (25 ± 1) °C and repeated three times.
2.5 CLSM
The microstructure of SPI/FVP mixtures were observed with CLSM (Ultra VIEW Vox, PerkinElmer, USA). Before imaging,SPI/FVP solution was mixed with rhodamine B (50 μL, 0.5%(V/V)), and a drop of the stained mixture was placed on a concave slide, covered with a glycerol-coated cover slip. The wavelength of incident light was 488 nm. The images, acquired with a 1 024 × 1 024 pixel resolution, were analyzed by using Volocity Demo Software to determine the microstructure.
2.6 FT-IR measurements
Solutions of SPI, FVP and SPI/FVP with various pH values were prepared and freeze-dried to obtain the corresponding powder. FT-IR measurements were performed with an FT-IR GX System (Tensor 27,Bruker Optics Inc., Karlsruhe, Germany) [19]. The powder of samples was mixed with KBr (ratio = 1:100), in order to optimize the flake transmittance. All spectra were scanned 3 times at a resolution of 4 cm−1in the range of 500-4 000 cm−1under the room temperature.
2.7 Measurements of content of SPI in coacervate phase
Samples were obtained according to the method of Xiong et al.with some modifications [20]. Briefly, the stock solution of SPI (3%,m/V) and FVP (3%,m/V) was obtained with the method described above. Various weight ratios (r= 1:1, 4:1, 10:1, 15:1 and 20:1) of SPI/FVP aqueous mixture were blended by adding stock solutions,and the total biopolymer concentration was 3% (m/V) at pH 4.5.SPI/FVP coacervates were acquired after centrifuging at 4 500 ×gfor 30 min [21]. The centrifuged precipitate was collected and weighed(m1). The mass (m2) of SPI in SPI/FVP coacervates was determined by the Kjeldahl method (N × 6.25, dry base). The content of SPI in coacervate phase was calculated as:
2.8 Viscoelastic measurements
The dynamic rheological properties were measured by straincontrolled rheometer (AR2000ex, TA, USA) with parallel plate geometries (40 mm in diameter). The centrifuged precipitate of SPI/FVP coacervates was obtained and placed on the plate for 10 min [22].Mineral oil was daubed around the edge to prevent moisture loss.Strain sweep test was applying to determine the linear viscoelastic interval of samples. The frequency ranged from 0.1 rad/s to 100 rad/s were applied in the measurement of dynamic viscoelastic properties.The temperature of trangest was set at (25 ± 1) °C.
2.9 Statistical analysis
The results were expressed as the mean values ± standard deviation (SD) of triplicate experiments. One-way analysis of variance (ANOVA) with a 95% confidence interval was used to assess statistical significance using SPSS version 23 software for Windows (SPSS Inc., Chicago, IL, USA).P< 0.05 was considered as significance among the same groups and expressed as different lowercase letters.
3. Results and discussions
3.1 Phase behavior of SPI/FVP complex coacervation
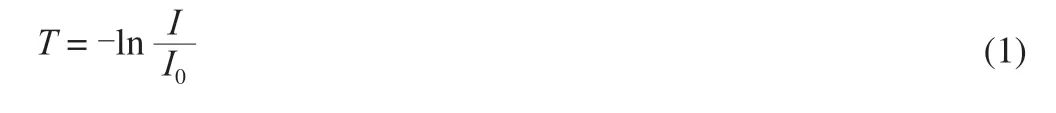
Relevant studies shown that electrostatic interaction was the main force for the formation of complex coacervation of protein/polysaccharides with opposite charges [23]. pH could affect the complex coacervation of SPI/FVP by changing the charge properties of protein [24]. Fig. 1A showed that the turbidity value of FVP solution was almost constant at different pH values, indicating that FVP was an acid-resistant polysaccharide. And FVP solution always remained cleared state at entire acidic conditions. The turbidity of SPI increased firstly and then decreased as pH ranging from 2.0 to 7.0 and reached the highest at pH 4.5. In the process of decreasing pH, the net charge of SPI gradually decreased, and the repulsive force between SPI molecules could not maintain the original equilibrium system, resulting in aggregation of SPI molecules and the increase in the turbidity of the solution. When the pH reached isoelectric point (pI)4.5 of SPI, the net charge of SPI was 0, and the aggregation and the turbidity reached the maximum. The result indicated that SPI was a protein that is highly dependent on pH, which was consistent with related research report [10].
The turbidity curve of SPI/FVP mixtures was similar to that of pure SPI, but critical pH transitions (pHc, pHφ1and pHφ2) were different. With the decrease of pH value, the turbidity of SPI/FVP solution increased slightly at pH 6.2 (pHc) (Fig. 1B) and soluble coacervates of SPI/FVP began to form. pHcof SPI/FVP was lower than SPI, resulting from the increase of the repulsive force with the addition of FVP (as shown in section 3.4). In general, protein/polysaccharide complex coacervations would at the isoelectric point of protein [25], However, SPI/FVP complex coacervation formed at pH 6.2 but not at pI 4.5 of SPI. This phenomenon might be explained with the composition of SPI. SPI was mainly composed ofβ-conglycinin (7S globulin) and glycinin (11S globulin). The pI of glycinin andβ-conglycinin were 6.4 and 4.8 respectively [8]. Complex coacervation firstly observed at pH 6.2 may form between glycinin and FVP. So the pHcwas tested over the pI of SPI. When pH continued to decrease to pH 5.5 (pHφ1),electrostatic attraction between SPI and FVP enhanced, resulting in the formation of more soluble coacervates. Then, the phase separation was initially visible. When pH decreased to 4.5, the net charge of the solution arrived to 0, and the accumulation of insoluble SPI/FVP coacervates reached the maximum, accounting for the highest turbidity of SPI/FVP complexes at pH 4.5 (pHopt). The conclusion was verified by the result that zeta potential of SPI/FVP was close to pH 4.5. With the decrease of pH from pHoptto pHφ2,the acidification of the solution further promoted the protonation of FVP carboxyl group, leading to the disassociation of insoluble coacervates and the decrease of turbidity of SPI/FVP. As seen in section 3.4, the apparent charge of the protonated FVP decreased and finally approached 0. The electrostatic interaction between SPI and FVP became weaker, which induced the disassociation of insoluble coacervates. Similar results were also observed in OVA-anionic polysaccharides system [8,26].
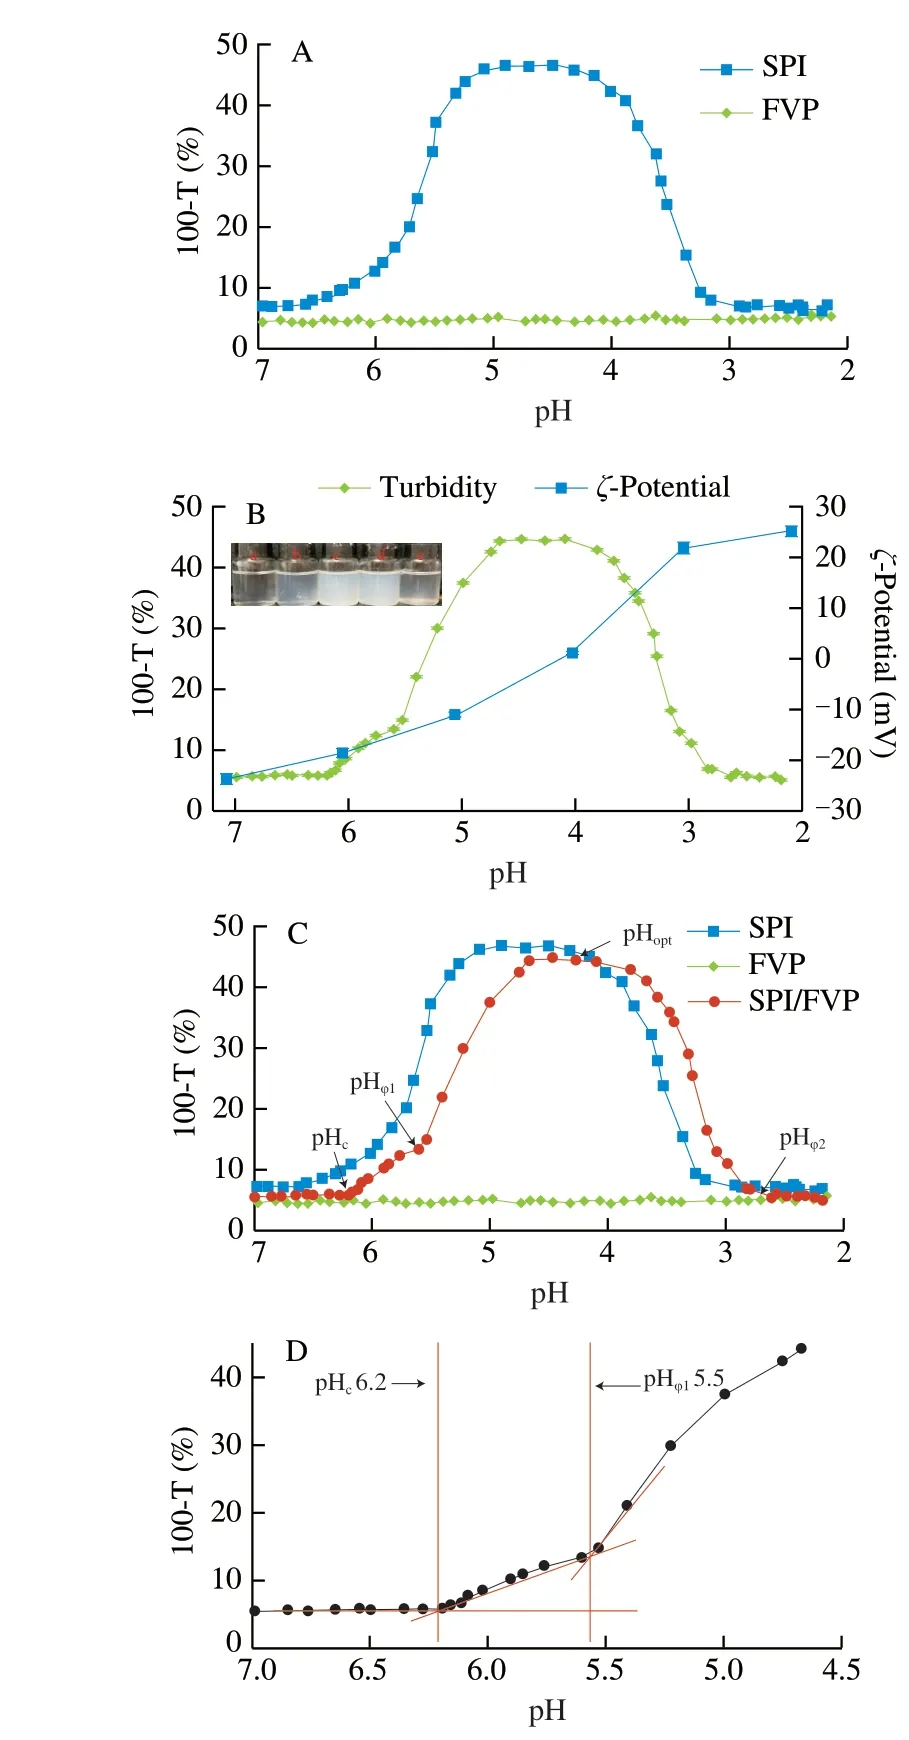
Fig. 1 Turbidity curve of SPI, FVP and SPI/FVP solution (A). Turbidity curve and ζ-potential of SPI/FVP solution (B). Solution statue of SPI/FVP at pH 7.0 (a), 6.5 (b), 5.5 (c), 4.5 (d), 3.5 (e). Selection criteria of critical pH values (pHc, pHφ1) (C). The method of critical pH selection (D).
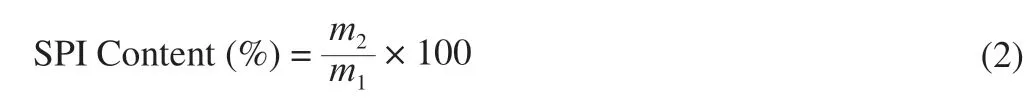
Accordingly, the microstructures of SPI/FVP complexes were investigated by CLSM as a function of pH [27]. The change of turbidity owed to the number and size of the biometric coacervates.In the progress of acidification, the turbidity curve of SPI/FVP solution was accordance with the microstructural change (Fig. 2). The SPI/FVP mixtures showed homogenized structure and less size at pH 7.0 over pI of SPI. Part aggregates were the accompaniment of the formations of soluble complexes (at pHc). The size and the number of complex coacervates grew up to the maximum at pHopt. Those results were consistent with the turbidity curves of SPI/FVP solution. The result shown that the formation of SPI/FVP coacervates went through a nucleation and growth process by electrostatic interactions between SPI and FVP [28].
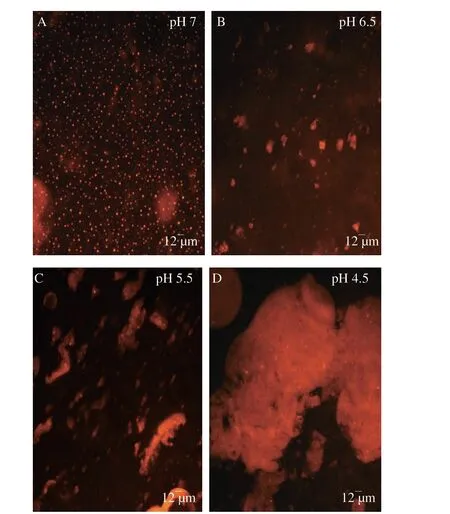
Fig. 2 Microstructure of SPI/FVP solution at pH 7.0 (A), 6.5 (B), 5.5 (C)and 4.5 (D) in absence of NaCl. Red color represented the protein phase in the CLSM image.
3.2 FT-IR of SPI, FVP and SPI/FVP
FT-IR spectrum was a common approach to illuminate the transformation of interactions formed by complexation at the molecular level. The accumulation of insoluble SPI/FVP coacervates reached the maximum at pH 4.5, so the study selected the pH to determine the FT-IR. FT-IR spectrum of SPI (Fig. 3) showed the absorption peak of typical bands of SPI, including the amide I (1 643 cm−1),the amide II (1 543 cm−1) and the amide III (1 395 cm−1) [29].FT-IR spectrum of FVP (Fig. 3) showed the band at 1 043 cm-1was attributed to the vibration of C-O-C stretching of glycosidic linkage and the peak at 1084 cm–1was related to the C-O stretching vibration.Other bands (1 637 cm–1and 1 403 cm–1) were observed and explained in some polysaccharides, which was the absorption peak of typical bands of polysaccharides [30]. The amide I and amide II band were associated with amino and carbonyl moieties. The slight enhancement and positional shift of the amide I and amide II proved that SPI/FVP complexes interacted mainly through electrostatic interactions between the amino groups of the FVP and the negatively charged carboxyl groups of SPI [31]. The same result was obtained in section 3.4, which presented the electrophoretic mobility of SPI,FVP and SPI/FVP solution. SPI solution showed a negative charge at pH 6.8, a positive charge at pH 2.7 and a point of zero charge around near 4.5 (pI). FVP solution showed negative charge but the electrophoretic mobility decreased from pH 7.0 to pH 2.4. The electrophoretic mobility of SPI/FVP solution fell in between SPI and FVP. As expected in a SPI/FVP blended system, the interaction between the positively charged SPI and the negatively charged FVP induced the formation of electrostatic complexes. The phenomenon also demonstrated that SPI and FVP interacted through electrostatic interactions. SPI, FVP and SPI/FVP complexes showed typical at nearly 3 400 cm-1caused by O-H stretching vibration, suggesting hydrogen bonding was one of interactional forces between two biopolymers [32]. It was inferred that the stronger intensity and wider band at 3 400 cm-1are related to the pretreatment of complete hydration.
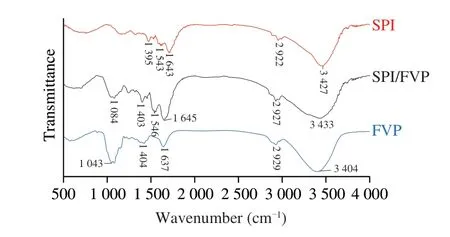
Fig. 3 The FT-IR spectra of SPI, FVP and SPI/FVP complexes at pH 4.5 without NaCl.
3.3 Effects of ionic strength on the SPI/FVP complex coacervation
Preliminary research revealed that electrostatic forces dominated the SPI/FVP complex coacervation. The salt ionic strength was investigated as an effect on SPI/FVP solution. Fig. 4A presented that the maximum of turbidity curve of SPI/FVP solution progressively reduced with the increase of NaCl concentrations from 50 mmol/L to 200 mmol/L. Fig. 4B showed that the pH range between the pHφ1and pHφ2increased firstly and then decreased asCNaClranging from 0 to 200 mmol/L and reached the highest atCNaCl= 50 mmol/L. With the increase of NaCl concentrations, electrostatic interaction got weaker,which resulted from high salt concentration shielded surface charges(Figs. 4C–D). In order to form the SPI/FVP coacervates, SPI needed more positive charges to enhance the interaction with FVP. And a more acidic environment could induce SPI to carry more net charges,which was the reason that critical pH values moved to a lower pH(Fig. 4B). Low NaCl concentration (CNaCl= 10, 50 mmol/L) promoted the complex coacervation of SPI/FVP and increased the critical pH values. Weinbreck et al. [33] observed similar result and explained that low salt concentration promoted the dissolution of SPI/FVP coacervates. Interestingly, the turbidity of SPI/FVP mixtures increased at pH region (from 6.5 to 4.5) (Fig. 4A), but SPI (pH > 4.5) carried negative charge and electrostatic forces between SPI and FVP were repulsive (Fig. 4C–D), which was contradictory with the conclusion above. The reason may be that the zeta potential detected charges of whole solution, but SPI was mainly composed of 7S globulin and 11S globulin.ζ-Potential of the solution was the sum of 7S globulin and 11S globulin at varying pH [34]. Complex coacervation could be formed between partly protein of SPI and FVP. Similarly, the pHcwas also observed at pH 6.2 not at pI 4.5.
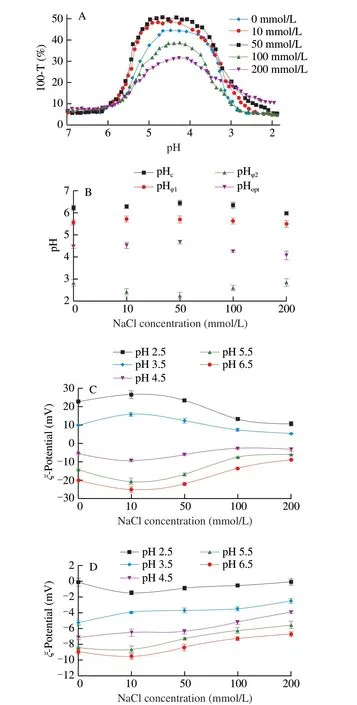
Fig. 4 Turbidity curves of SPI/FVP solution with different NaCl concentration (A). Changes of critical pH for SPI/FVP solution as a function of NaCl concentration (B). ζ-Potential of SPI (C), FVP (D) at various pH values and NaCl concentration.
3.4 The effects of mixing ratio on the SPI/FVP complex coacervation
The effect of varying SPI/FVP mixing ratios affected the charge balance, the strength and degree of binding capacity. With the decrease of mixing ratio from 20:1 to 1:1, the pH range from pHφ1to pHφ2and the maximum turbidity decreased even more together(Fig. 5A), indicating that the mixing ratio directly affected the kinetics of SPI/FVP complex formation. Fig. 5B showed the changes of critical pH (pHc, pHφ1and pHφ2) of complexes as a function of SPI/FVP ratios. The pHcand pHφ1increased as the ratio of SPI/FVP from 1:1 to 20:1. The mixing ratio of protein and polysaccharide would change the charge balance of the SPI/FVP complex to affect the formation of the coacervation. As seen as Fig. 5C, the electrophoretic mobility of SPI/FVP solution fell in between SPI and FVP. At a high ratio, per FVP chain was satisfied with enough aggregates of the amount of SPI molecules available. With the change of the proportion from 20:1 to 15:1, the SPI aggregates did not meet the requirement of FVP chain, which exhibited that the turbidity, pHoptand pHcincreased [33]. It was worth noting that pHφ1at ratios (r=10:1, 15:1) changed lightly but showed no significance. Niu et al. [35]reported the similar phenomenon and explained the reason that polysaccharide chain reached a saturated state and the number of soluble complexes was invariant. As SPI/FVP ratio increased from 10:1 to 1:1 and pH of solution decreased, the aggregates of SPI began to twist of the molecule and expose of their loads to form more complex coacervation [36], which explained that pHφ1shifted to acidity with the decrease of proportion.
3.5 The second structure of SPI/FVP complex coacervation
In order to gain insight into the structural changes of SPI and SPI/FVP coacervates, the secondary structure (Table 1) was measured by the FT-IR curve fitting method (Peakfit V 4.12.1). According to previous research, the corresponding structure information of the peaks wereα-helix (1 650-1 660 cm-1),β-sheet (1 610-1 640 cm-1),β-turn (1 660-1 700 cm-1), and random coil (1 640-1 650 cm-1) [37,38].In theα-helix structure, stability mainly relied on inter- or intrahydrogen bonds between the carbonyl oxygen (-CO) and amino hydrogen (NH-). The stability ofβ-sheet mostly depended on carbonyl oxygen (-C=O) and hydrogen (-CONH-) groups [5,26]. Table 1 showed thatα-helix andβ-turn appeared to be undisrupted with pH-shifting treatments, a similar phenomenon was observed ,associated with proteins in the molten globule state [39]. The level ofβ-sheet in the complex increased all the way, indicating that the changes in hydrogen bonding occurred with pH-shifting [40].The content of random coil reached the peak at pH 4.5, which corresponded to the max turbidity value of SPI/FVP complexes. The effects of ionic strength on second structure of SPI/FVP complex coacervation were investigatedat Table 1. The results illustrated that ionic strength induced the increase ofα-helix and decrease ofβ-sheet.Salt ions could induce the hydrophobic environment of the solution and shield the charges. The hydrophobic environment was beneficial to the formation ofα-helix, but shielding the charges was not conductive to the formation ofβ-sheet [7].In this case, NaCl concentration was conductive to the formation ofα-helix but not to the formation ofβ-sheet. With the increase of FVP content,α-helix and random coil kept constant,β-sheet increased all the time butβ-turn decreased. The similar phenomenon were observed in SPI-egg white complex [41].The addition of FVP could change the charges of SPI and the formation of coacervates by increasing hydrogen bond stability.The changes in electrostatic interactions could, in turn, contribute to the increase ofβ-sheet content under acidic conditions [42].Meanwhile, the decrease of content ofβ-turn induced the formation of stereospecific blockade between rigid positive SPI and flexible negative FVP [43], thereby forming a solid and massive sphere.
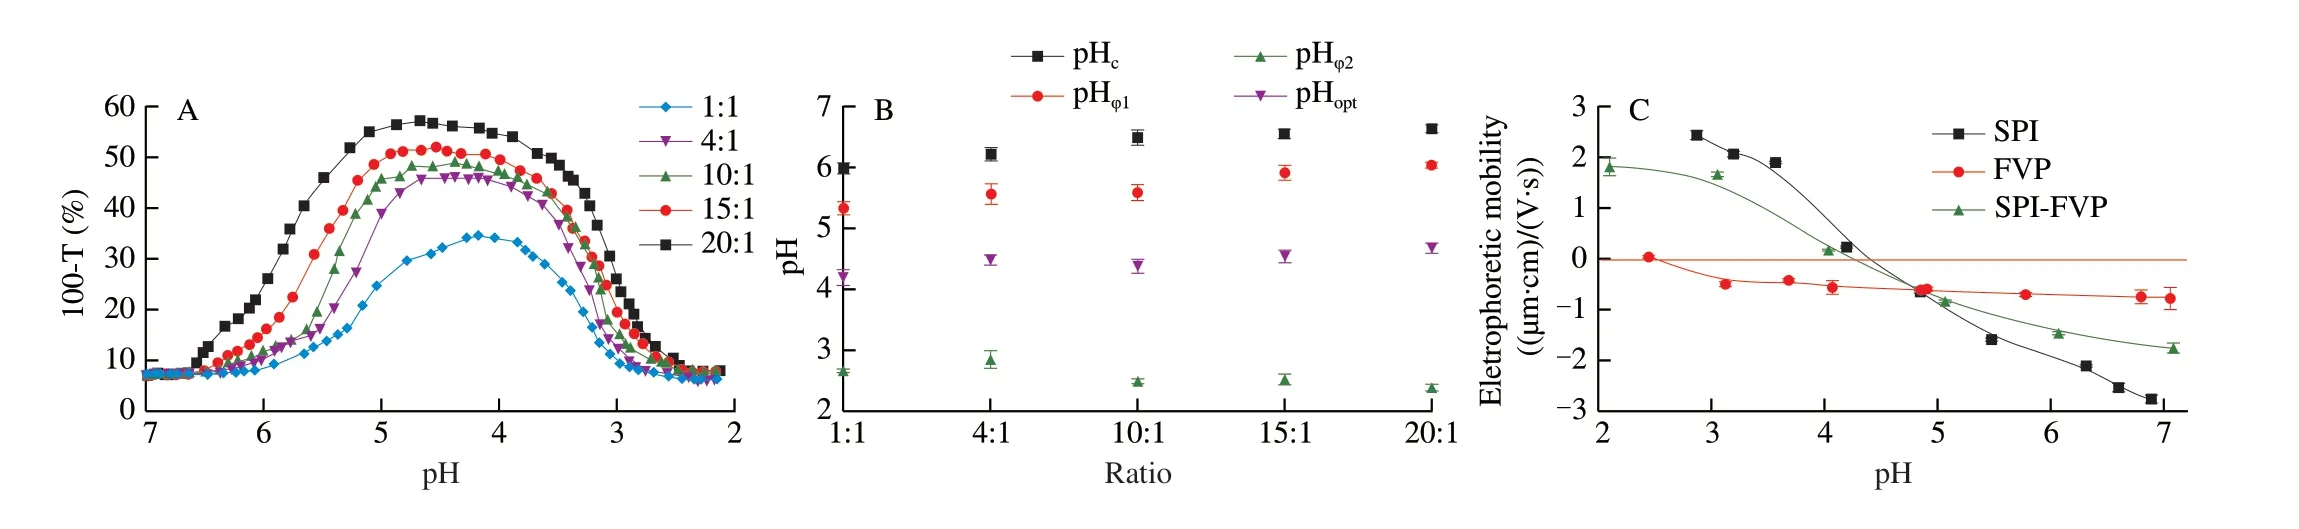
Fig. 5 Turbidity curves of SPI/FVP solution as a function of initial SPI/FVP ratios (A). Changes of critical pH for initial SPI/FVP ratios (B). The electrophoretic mobility of SPI, FVP and SPI/FVP solution as a function of pH (C).
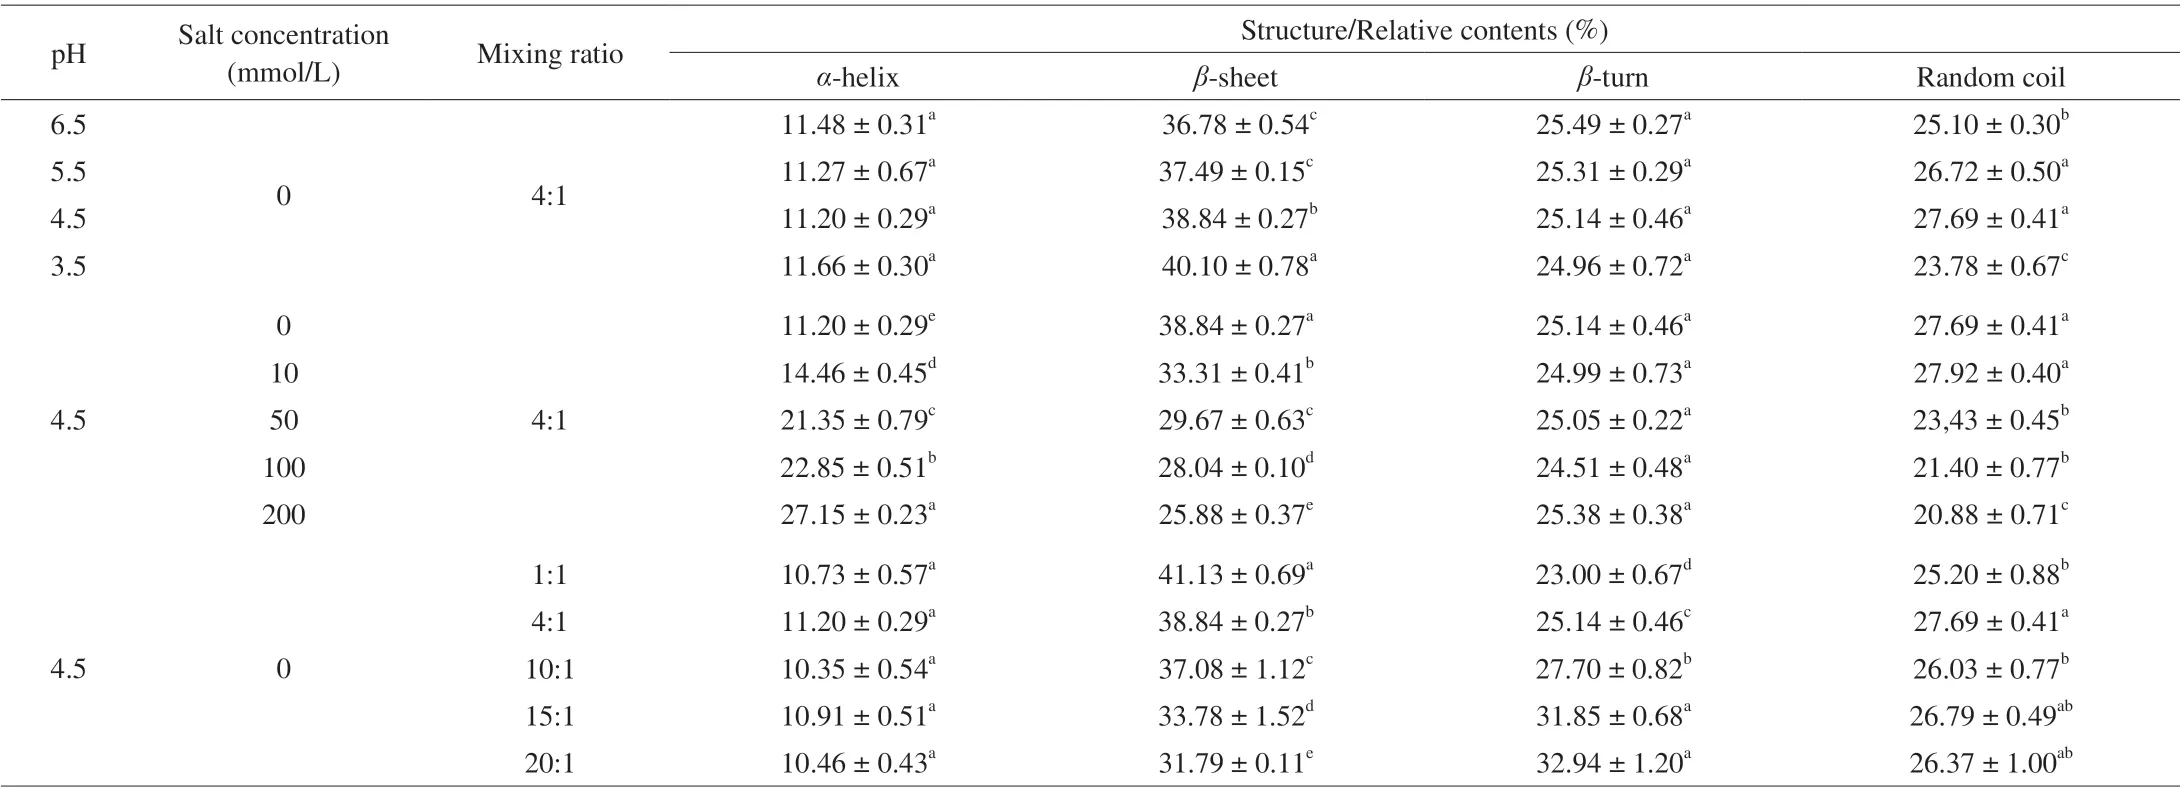
Table 1 The content of the secondary structure of SPI/FVP complexes.
3.6 The content of SPI in coacervate phase
The centrifuged precipitate and the content of SPI in SPI/FVP coacervates were shown in Table 2. With the increase ofCNaCl,the centrifuged precipitate of SPI/FVP coacervates increased and reached the peak at 200 mmol/L. It was noticed that the centrifuged precipitate at 100, 200 mmol/L was no statistical difference observed(P> 0.05). But, the content of SPI decreased asCNaClincreased,which was explained by the reason thatCNaClshielded charge of SPI molecules and made against the formation SPI/FVP coacervates by the electrostatic interactions [13]. When the mixing SPI/FVP ratio decreased from 20:1 to 1:1, the content of SPI always increased and The maximum was (92.92 ± 1.80)% at ratio of 1:1. When initial SPI was sufficient at 10:1, 15:1 and 20:1, the content of SPI in SPI/FVP coacervates was not significantly different (P> 0.05). The result could be explained by the comment that at a high ratio, per FVP chain was satisfied with enough aggregates of the amount of SPI molecules available [44].
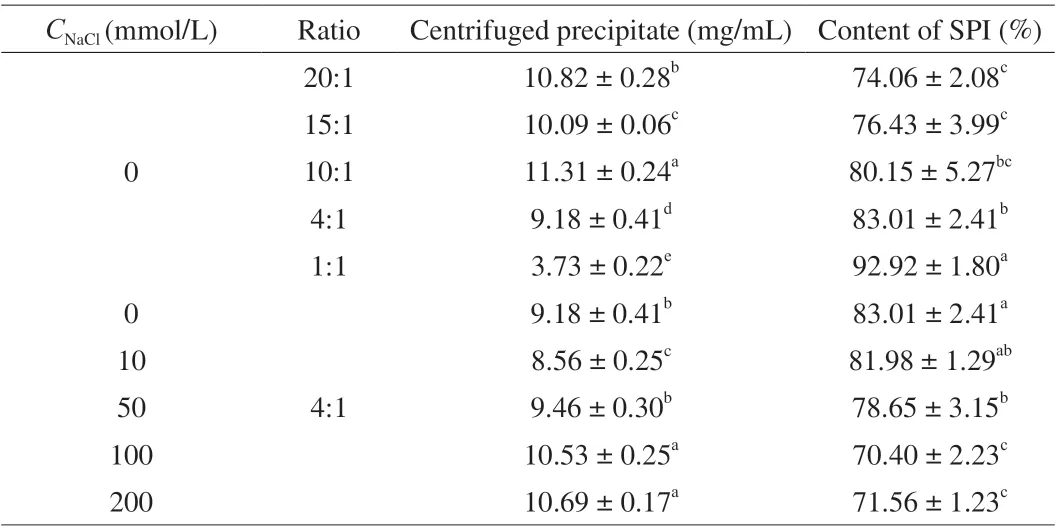
Table 2 The content SPI in SPI/FVP coacervate with various NaCl concentrations and various initial SPI/FVP ratios.
3.7 The rheological properties of SPI/FVP complex coacervation
The dynamic rheological properties were surveyed to reflect the macroscopic characteristics of SPI/FVP coacervates [45]. Fig. 6 illuminated that the storage modulus values (G′) was higher than the loss modulus (G″) values for all of the sample, reflecting that the SPI/FVP coacervates exhibited solid-like properties. When NaCl concentration was 10 and 50 mmol/L,G′ andG″ values of SPI/FVP coacervates became higher compared with the level at 0 mmol/L NaCl. On the contrary, the high concentration at 100 and 200 mmol/L resulted in the decrease ofG′ andG″ values of SPI/FVP compared with 0 mmol/L NaCl. (Figs. 6A–B). Then, the environment of low NaCl concentration was beneficial to form the closer structure of SPI/FVP coacervates, mainly due to the enhance of electrostatic interaction [46]. The environment of high NaCl concentration shielded charge of FVP chain and SPI molecules and led to a looser coacervate structure [47]. Figs. 6C–D presentedG′ andG″ values at different mixing ratios. With the increase of FVP addition, theG′andG″ values of SPI/FVP coacervation decreased with the frequency range from 0.1 rad/s to 100 rad/s. The addition of FVP caused the decrease ofG′ andG″, the lowerG′ value represented the poorer network structure of SPI/FVP coacervates. TheG′ of SPI/FVP coacervates were almost equal atr= 10:1 and 15:1. The similar phenomenon was discussed in the section of 3.4, Chai et al. [48]reported that the phenomenon was related to a saturated state of SPI/FVP complex coacervation.
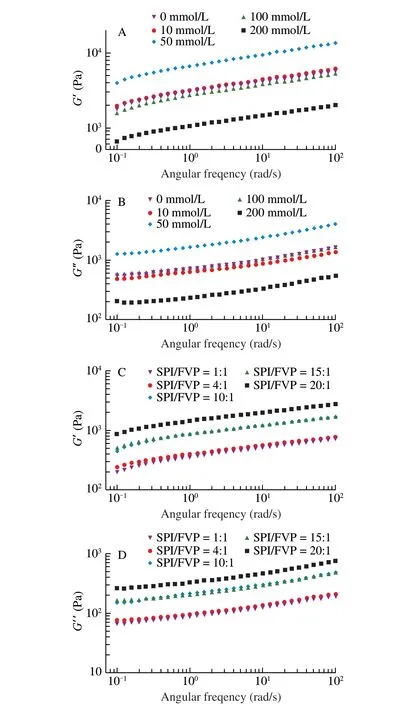
Fig. 6 The storage modulus of SPI/FVP coacervates (A, C) and the loss modulus of SPI/FVP coacervates (B, D).
3.8 Schematic illustrations
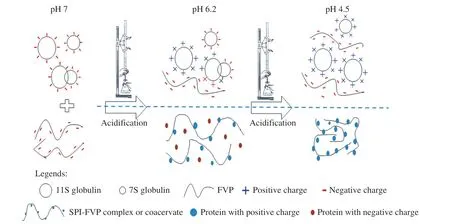
Fig. 7 Schematic illustration of the formation of SPI/FVP complexes or coacervates.
From the results above, a schematic illustration for the formation of SPI/FVP coacervates was proposed in Fig. 7. At pH 7.0, SPI and FVP were negatively charged, and the solution was homogeneous due to electrostatic exclusion. With the process of acidification, the pH of the solution first reached the isoelectric point of 11S globulin(pI 6.4), resulting in the fact that 11S globulin had positive charge.Electrostatic interaction between 11S globulin and FVP caused the formation of soluble complexes and changed the turbidity of the solution. The pH of the solution reduced to the isoelectric point of the 7S globulin (pI 4.8) accompanied by the acidification. 7S globulin joined in the formation of coacervates with FVP and the unit of polysaccharide had more variable protein to form coacervates,followed by turbidity reached the maximum.
4. Conclusion
The current study evaluated the phase separation behavior,viscoelastic properties and conformational transition of SPI/FVP complex coacervation. SPI/FVP complex coacervation yielded a biopolymer rich phase and a polymer poor region as a function of pH.Under the electrostatic interaction, SPI and FVP could spontaneously form insoluble coacervates through a nucleation and growth process at over isoelectric point of SPI. The addition of FVP could change SPI net charges and increase the content of theβ-sheet through electrostatic interaction. Low NaCl concentration (< 50 mmol/L) was beneficial to form the dense structure of SPI/FVP coacervates. While the high NaCl concentration (≥ 100, 200 mmol/L) was conductive to the formation ofα-helix but not to the formation ofβ-sheet. SPI/FVP coacervates exhibited solid-like properties and presented the strongest storage modulus atCNaCl= 50 mmol/L. This study provides useful information for obtaining complex coacervation of SPI and FVP,including optimal pH, SPI/FVP ratio and NaCl concentration. The addition of FVP could improve the physical properties of SPI. Well structure and rheological properties presented by SPI/FVP coacervates has the application potential for the development of traditional foods.
Conflict of interest
The authors declare there is no conflict of interest.
Acknowledgements
This work was supported by the National Key R&D Program of China (2017YFD0400205), and Postgraduate Research & Practice Innovation Program of Jiangsu Province (KYCX19_1402).
- 食品科学与人类健康(英文)的其它文章
- Wine, beer and Chinese Baijiu in relation to cardiovascular health:the impact of moderate drinking
- Comparative analysis of physicochemical properties, ginsenosides content and α-amylase inhibitory effects in white ginseng and red ginsen
- Monitoring and identif ication of spoilage-related microorganisms in braised chicken with modif ied atmosphere packaging during refrigerated storage
- Effect of cooking processes on tilapia aroma and potential umami perception
- Formation mechanisms of ethyl acetate and organic acids in Kluyveromyces marxianus L1-1 in Chinese acid rice soup
- Volatile prof ile and multivariant analysis of Sanhuang chicken breast in combination with Chinese 5-spice blend and garam masala