
The mechanisms of melanogenesis inhibition by glabridin:molecular docking, PKA/MITF and MAPK/MITF pathways
2023-01-22 09:45ChunxingPnXioyingLiuYtingZhngZjunZhngYonglingLiBioChGungrongLiuLnyuZhngChngzhiDongHjiAkrAisZhiyunDuZhngqingYun
食品科学与人类健康(英文) 2023年1期
Chunxing Pn, Xioying Liu, Yting Zhng, Zjun Zhng, Yongling Li, Bio Ch,Gungrong Liu, Lnyu Zhng, Chngzhi Dong, Hji Akr Ais, Zhiyun Du,*, Zhngqing Yun,*
a School of Biomedical and Pharmaceutical Sciences, Guangdong University of Technology, Guangzhou 510006, China
b Inf initus(China) Company Ltd., Guangzhou 510663, China
c Foshan Allen Conney Biological Technology Co., Ltd., Foshan 528225, China
d Université Paris Diderot, Sorbonne Paris Cité, ITODYS, UMR 7086 CNRS, France
e The Key Laboratory of Plant Resources and Chemistry of Arid Zone, Xinjiang Technical Institute of Physics and Chemistry, Chinese Academy of Sciences, Ürümqi 830011, China
Keywords:Glabridin Melanogenesis Molecular docking PKA/MITF pathway MAPK/MITF pathway
A B S T R A C T Glabridin is the main ingredient of hydrophobic fraction in licorice extract and has been shown to have antimelanogenesis activity in skins. However, the underlying mechanism(s) remain not completely understood.The aim of this study is thus to elucidate the possible mechanisms related to the melanogenesis suppression by glabridin in cultured B16 murine melanoma cells and in UVA radiation induced hyperpigmentation model of BALB/c mice as well. Molecular docking simulations revealed that between catalytic core residues and the compound. The treatment by glabridin significantly downregulated both transcriptional and/or protein expression of melanogenesis-related factors including melanocyte stimulating hormone receptor (MC1R),microphthalmia-associated transcription factor (MITF), tyrosinase (TYR), TYR-related protein-1 (TRP-1)and TRP-2 in B16 cells. Both PKA/MITF and MAPK/MITF signaling pathways were found to be involved in the suppression of melanogenesis by glabridin in B16 cells. Also in vivo glabridin therapy signif icantly reduced hyperpigmentation, epidermal thickening, roughness and inflammation induced by frequent UVA exposure in mice skins, thus benef ciial for skin healthcare. These data further look insights into the molecular mechanisms of melanogenesis suppression by glabridin, rationalizing the application of the natural compound for skin healthcare.
1. Introduction
Melanogenesis has been of great interest in researches for decades. Melanin, synthesized in the unique melanosomes of melanocytes, is the end product of melanogenesis that determines the color of mammalian skin, hair and eyes. The synthesized melanin would be transported to the nearby keratinocytes through the dendrites of melanocytes and then spread in the epidermis [1].
The melanosomes have a battery of mechanisms for regulation of melanin synthesis, of which the “three-enzyme theory” in the initiation of melanogenesis is widely accepted. The “three enzymes”refer to tyrosinase (TYR), tyrosinase-related protein-1 (TRP-1)and tyrosinase-related protein-2 (TRP-2), among which TYR is the critical enzyme to orchestrate melanogenesis. During melanogenesis,L-tyrosine is first hydroxylated toL-hydroxyl phenylalanine(L-DOPA) by TYR and L-DOPA is then oxidized into correspondingO-quinone. Subsequently,O-quinone is oxidized into DOPA chrome,and DOPA chrome can be catalyzed into 5,6-dihydroxyindole-2-carboxylic acid (DHICA) by the DOPA chrome tautomerize TRP-2.Finally, TRP-1 oxidizes DHICA to a carbonylated indole-quinone and produces melanin [2].
Various extracellular stimuli, including UV radiation, 3-isobutyl-1-methylxanthine (IBMX), alpha-melanocyte-stimulating hormone(α-MSH), Wnt-3a, and stem cell factor (SCF), can enhance melanin synthesis through some signaling pathways, like cAMP/PKA/MITF and p38 MAP kinase signaling pathways [3]. For instance,α-MSH stimulates the melanocortin 1 receptor (MC1R) and subsequently activates adenyl cyclase to increases cAMP production, which triggers activation of cAMP-dependent protein kinase A (PKA) and several regulatory proteins as well [4]. Phosphorylated PKA activates the cAMP response element-binding protein (CREB) that binds to the cAMP response element (CRE), leading to the upregulated expression of microphthalmia-associated transcription factor (MITF) gene, which controls the expression level of TYR and tyrosinase-related proteins(TRPs) [5,6]. Additionally, the MAPK family proteins, such as p38,extracellular signal regulated kinase (ERK) and C-Jun, N-terminal kinase (JNK), have been reported to be activated by many extracellular stimuli and play critical roles in the synthesis of melanin [7].For example, phosphorylated ERK inhibits the expression of MITF and thereby reduces melanin synthesis, while phosphorylation of p38 and JNK can increase melanin synthesis by activating MITF [8].
The therapeutic efficacy of extracts fromGlycyrrhiza glabraL.has been studied for years. There are many active ingredients inG. glabraextract, such as glycyrrhizin and glycyrrhetinic acid,which are hydrophilic anti-inflammatory drugs [9]. According to previous studies, the inhibitory effect of the hydrophobic flavonoids fraction fromGlycyrrhiza uralensisextracts on melanin synthesis is due to its ability to inhibit the activities of tyrosinase [10] and downregulate the expression of melanogenesis-related factors including MITF, TYR, TRP-1 and TRP-2 [11]. Glabridin, which is the main hydrophobic component of the flavonoid extract ofG. uralensis, is well known to have a potent inhibitory activity on melanogenesis [9]. Glabridin has been shown to have potent inhibitory effect on tyrosinase activity (IC50: 0.43 μmol/L) [10]. By molecular docking to simulate the binding mode and sites between glabridin and tyrosinase, it is speculated that the natural inhibitor binds to tyrosinase mainly through the formation of hydrogen bonds [10]. Although glabridin has been found to down-regulate the protein expression of TYR, MITF, TRP-1, and TRP-2 in B16 cells [12], the upstream inhibition mechanism of melanin production by glabridin remains unclear [13]. This study aims to clarify the regulation mechanism of glabridin in the biosynthesis of melanin. Melanogenesis related cAMP/CREB/PKA/MITF and p38 /MAPK/MITF signaling pathways were examined to reveal any possibly correlated mechanisms. Both B16 cellular model and UVA-induced skin hyperpigmentation BALB/c mice model were used to test the therapeutic efficacy of glabridin on reducing melanogenesis.
2. Materials and methods
2.1 Molecular docking
The molecular docking was performed based on the previous description [25] with some modifications. The molecular docking program AutoDock (4.2.6) was used to examine the possible interactions of glabridin with TYR and MITF. Structures of glabridin andα-arbutin were downloaded from the Zinc (zinc.docking.org)as mol2 files, and the crystal structures of TYR (PDB ID:2y9x) and MITF (PDB ID:4ati) were directly downloaded from the RCSB protein data bank (https://www.rcsb.org/). AutoDock Tools 1.5.4 package was used to prepare all input files. To carry out docking simulations, a grid box was defined to enclose the active site with dimensions of 88 Å × 76 Å × 106 Å and a grid spacing of 0.375 Å.Molecular docking of each ligand was performed with a Lamarckian genetic algorithm. The parameters were set as following: population size of 150, 250 000 energy evaluations, a mutation rate of 0.02,crossover rate of 0.80, and 100 independent docking simulations. The docking mode is semi-flexible docking. A cluster tolerance of 2.0 Å in positional root-mean square deviation (RMSD) was used to cluster the docking results. The binding position prediction is regarded to be accurate when the produced RMSD is below 2.0. The ligand with the lowest free docking energy was regarded as the best matching ligand for a target protein. Redocking and cross-docking were carried out for validation of docking methods and parameters. The redocking protocols are regarded as valid when the RMSD value is less than 2 Å. The docking energy of a ligand is then compared with that of the native ligand of TYR,tropolone [26]. Docking figures were produced by using the PyMOL molecular graphics system (http://www.pymol.org).
2.2 Cell culture
B16 cells were cultured on tissue culture flask in RPMI 1640 medium (Gibco, USA) supplemented with 10% (V/V) heatinactivated fetal bovine serum (FBS, Gibco, USA) and antibiotics(100 U/mL penicillin, 100 mg/mL streptomycin, Gibco, USA). Cells were cultured at 37 °C in a humidified incubator with 5% CO2.
2.3 Antibodies and reagents
Both glabridin (Analytical standards, ≥ 99%) andα-arbutin(Analytical standards, ≥ 98%) were purchased from Aladdin Biochemical Technology Co., Ltd. (Shanghai, China), 3-(4,5-dimethyl-2-thiazolyl)-2, 5-diphenyltetrazoliumbromide (MTT),2-mercaptoethanol, dimethyl sulfoxide (DMSO), mushroom tyrosinase,L-tyrosine and L-DOPA were obtained from Sigma (St.Louis, MO, USA). Alpha-MSH and antibodies against TYR, TRP-1,TRP-2, MITF, CREB, phospho-CREB (p-CREB), p38, phospho-p38(p-p38), ERK, phospho-ERK (p-ERK), JNK, phospho-JNK (p-JNK),andβ-actin were all purchased from Abcam (Cambridge, MA,USA). The anti-PKA antibody was purchased from Cell signaling Technology (Danvers, MA, USA), and anti-phospho-PKA was purchased from Affinity Biosciences Ltd. (OH, USA), Antirabbit IgG-HRP was purchased from Beijing Solarbio Science &Technology Co., Ltd. (Beijing, China). The cAMP enzyme linked immunosorbent assay (ELISA) Kit was purchased from Jiangsu Meibiao Biological Technology Co., Ltd. (Jiangsu, China).
2.4 Activity assay of mushroom-derived tyrosinase
The activity of tyrosinase (TYR) was determined as described in the previous studies [8,27]. Glabridin,α-arbutin was dissolved in dimethyl sulphoxide at 10.0 mmol/L, 1.0 mol/L and diluted forin vitrodosage experiments.L-tyrosine was used as a substrate for TYR monophenolase activity assay and L-DOPA was used as a substrate for TYR diphenolase activity assays. 100 μL of glabridin (0.5, 2.5, 5.0,15.0 and 25.0 μmol/L) orα-arbutin (250.0, 500.0, 1 000.0, 2 000.0,3 000.0, 4 000.0 and 5 000.0 μmol/L) was mixed with 100 μL of the aqueous solution of mushroom-derived TYR (200 U/mL) in a 96-well plate and pre-incubated at 25 °C for 10 min. Then 1.0 mmol/L L-DOPA solution or 2.0 mmol/LL-tyrosine was added to the mixture and incubated for 25 min at 25 °C. The optical absorbance at 475 nm was measured for quantification using a Microplate reader (Thermo Scientific Multiskan FC, Thermo, USA).
2.5 Cell viability assay
Cytotoxicity of glabridin on B16 cells was assessed by using the colorimetric MTT agent (3-(4,5-dimethylthiazol-2-yl)-2,5-diphenyltetrazolium bromide) (Sigma Aldrich, Shanghai) according to the manufacturer’s instruction. Cells were seeded in 96-well plates (5 × 10³cells/well) and incubated for overnight first. Then the cells were treated by vehicle or glabridin at various concentrations(5.0, 15.0, 20.0, 25.0, 30.0, 35.0, 40.0 and 55.0 μmol/L) for 48 h,respectively, followed by cell proliferation and viability assessment by MTT assay. Assays were performed in triplicate and repeated for 3 times. Spectrophotometric absorbance at 570 nm was measured using a microplate reader (model 2300, PerkinElmer, Boston, MA, USA), and the percentage of surviving cells is calculated according to the equation:viability of cells (%) = (Asample-Ablank) / (Acontrol-Ablank) × 100.Asample,AblankandAcontrolrepresent UV absorption at 570 nm for cells treated by glabridin, culture medium, or vehicle, respectively. Data were presented as mean ± SEM.
2.6 Melanin content assay
The amount of melanin in B16 cells was measured as described previously [14]. Cells (5 × 10⁴) were seeded into 35 mm culture dish (Corning, USA) and cultured for 24 h first. Then cells were pretreated with glabridin (5.0 and 30.0 μmol/L) andα-arbutin(1.0 mmol/L) for 12 h, followed by stimulation with 1.0 μmol/L ofα-MSH for additional 36 h and cell harvesting by trypsinization.Treated cells were dissolved in 100 μL of 1 mol/L NaOH containing 10% DMSO for 30 min at 80 °C and then transferred into a 96-well plate. The solubilized melanin content was determined by measuring spectropho tometric absorbance at 570 nm using a microplate reader (model 2 300, PerkinElmer, Boston, MA, USA). Also treated cells were examined and imaged to show melanin production and deposition within cells by phase-contrast microscopy.
2.7 B16 cellular TYR activity assay
The detection of tyrosinase activity in B16 cells is modified from the previous report [15]. In brief, 5 × 10⁴cells were seeded into 35 mm culture dishes (Corning, USA) and cultured overnight (12 h).B16 cells were pretreated with various concentrations of glabridin(5.0 and 30.0 μmol/L) andα-arbutin (1.0 mmol/L) for 12 h, and then stimulated with 1 μmol/L ofα-MSH for additional 36 h. At the end of treatment, cells were harvested, washed and lysed with RIPA lysis buffer (Beyotime, Shanghai, China) containing 1 mmol/L PMSF.Cell lysates were centrifuged for 15 min at 13 000 r/min at 4 °C, and the produced supernatant was used as the source of tyrosinase. The lysate protein concentration was determined by using a BCA assay kit(Thermo Fisher Scientific, USA). Then 40 μL of tyrosinase solution was mixed with 200 μL of 10.0 mmol/L L-DOPA in 96-well plate and incubated for 30 min at 37 °C. The spectrophotometric absorbance of reaction at 405 nm was measured by a microplate reader (Thermo Scientific Multiskan FC, Thermo, USA) and used for the relative quantification of cellular TYR activity.
2.8 Measurement of cAMP level in B16 cells
B16 cells were seeded into a 100 mm culture dishes (Corning,USA) at a density of 1 × 10⁶per dish and cultured for 24 h. Cells were then pretreated with two concentrations of glabridin (5.0 and 30.0 μmol/L) andα-arbutin (1.0 mmol/L) for 12 h, and followed by stimulation with 1 μmol/L ofα-MSH for additional 36 h. Then treated cells were harvested and cell lysate prepared using RIPA buffer. The cAMP level in lysate was measured using a cAMP-specific ELISA kit.
2.9 Western blotting
B16 cells were dissolved in RIPA cell lysis buffer containing 1 mmol/L PMSF to prepare protein samples for Western blotting analyses. Determination of protein concentration was carried out by using BCA Protein Assay kit (Thermo Fisher Scientific, USA).Proteins were separated by SDS-PAGE and transferred to PVDF membranes (Millipore, USA). Membranes were blocked with 5%bovine serum albumin (BSA) for 1 h. The membranes were incubated with primary antibodies at 4°C for overnight. Primary antibodies were used to against the following proteins: p-PKA (AF7246, 1:1000 dilution, Affinity, USA), PKA (#5842, 1:1000 dilution, CST, USA),p-CREB (ab32096, 1:5000 dilution), CREB (ab32515, 1:1 000 dilution), p-ERK (ab214036, 1:1 000 dilution), ERK (ab184699,1:10 000 dilution), TYR (ab180753, 1:1 000 dilution), p-p38(ab4822,1:1 000 dilution), p38 (ab170099, 1:1 000 dilution), TRP-1 (ab235447,1:1 000 dilution), p-JNK (ab124956, 1:1 000 dilution), JNK(ab179461, 1:1 000 dilution), TRP-2 (ab74073, 1:1 000 dilution),MITF (ab140606, 1:200 dilution) andβ-actin (ab8227, 1:1 000 dilution, Abcam, UK). Theβ-actin was used as an internal reference protein for loading control. Subsequently, the membrane was washed and incubated with the horseradish peroxidase conjugated anti-rabbit second antibodies (SE134, dilution 1:2 000, Solarbio, Beijing, China)at room temperature for 1 h. Finally, the membrane was washed,developed for chemiluminescence with the ECL detection reagents(Merck Millipore) and photographed by chemiluminescence gel imaging system (Peiqing Science & Technology Co., Ltd, Shanghai,China). Western blotting bands were semi-quantified by using the Image J software (National Institutes of Health, Bethesda, MA, USA) and normalized withβ-actin as an internal loading control. Protein expression level is shown relative to Ctrl, the value for which was set to 1.
2.10 Quantitative real-time PCR
Gene transcription was detected and compared by quantitative real-time polymerase chain reaction (PCR). In brief, total B16 cellular RNAs were isolated using RNA simple Total RNA Kit (Qiagen,China) and reverse-transcribed into first-stranded cDNA using the Super Script®VILO™ cDNA Synthesis Kit (Thermo, USA). Then cDNAs were used for real-time PCR analysis in an ABI Prism 7500 Sequence Detection system (Applied Biosystems, USA) with the use of FastStart Universal SYBR Green PCR Master Mix (Roche,Switzerland) according to the manufacturer’s instructions. The primer sequences for real time-PCR were shown in Table 1. Data were normalized to the expression levels of GAPDH and analyzed using the previously described 2-ΔΔCtmethod [28].
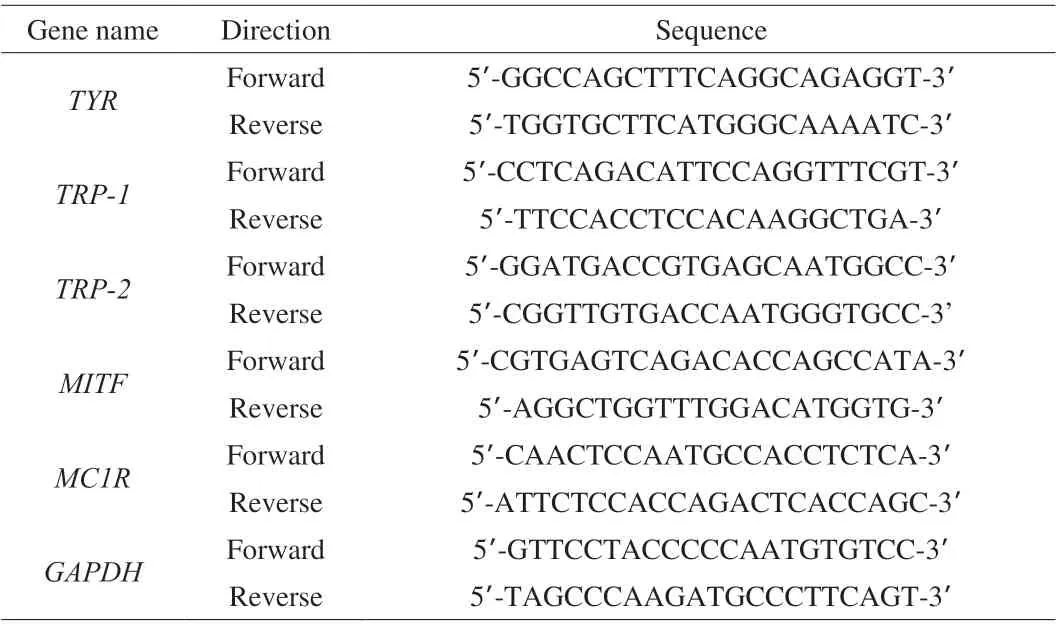
Table 1 Sequences of the primers used for real-time PCR.
2.11 Animal experiment
Thein vivodepigmentation efficacy of glabridin was assessed in animal experiments. A total of 24 6-week-old BALB/c mice were purchased from Sun Yat-Sen University Laboratory Animal Center.Before the UVA treatments, the animals were maintained on a standard laboratory animal chow and water. They were housed in a controlled room at (23 ± 1) °C, (55 ± 5)% humidity, 12 h light/dark cycle. All procedures used in the present study followed the relevant practice and institutional guidelines. The mice were treated according to the Ethical Guidelines of the Animal Center. All 24 mice were randomly grouped into 4 groups with 6 mice per group as following:control group (N), without UVA treatment; UVA group (M), with UVA radiation only; positive control group (PC), topically treated byα-arbutin (1.0 mg/(kg·day)) + UVA on skins; low dose of glabridin therapy group (L), topically treated by glabridin (10.0 μg/(kg·day)) +UVA; high dose of glabridin therapy group (H), topically treated by glabridin (100.0 μg/(kg·day)) + UVA. Animals were daily exposed to UVA radiation at 6 J/cm2for 60 min in a Bio-Sun system illuminator(Vilber Lourmat). Glabridin was diluted to 2.0 μg/mL or 20.0 μg/mL using butanediol, respectively, andα-arbutin was diluted to 200.0 μg/mL using butanediol, and 100 μL of therapeutic agent solution was topically applied to the dorsal skin of mice every day. Animals were culled at the end ofin vivoexperiment and dorsal skins were collected for further cAMP detection and pathological analyses.
2.12 Histology and immunohistochemistry
Collected skin tissues were first fixed in 4% formaldehyde and then embedded in paraffin, sectioned and stained with hematoxylineosin. The Fontana-Masson stain of melanin was performed by the use of a Fontana-Masson staining kit according to the manufacturer’s instructions. Examination and imaging were carried out using the Eclipse E600 microscope (Nikon, Tokyo, Japan) and the Aperio Scan Scope XT systems (Aperio Technologies, Germany).
2.13 Statistical analysis
All values are shown as mean ± SEM. Statistical analyses were conducted using GraphPad Prism 5 for Windows. Differences between groups were analyzed by using Student’sttest. Comparison of more than two groups was made with one-way analysis of variance(ANOVA) with post-hoc Tukey-Kramer multiple comparison test.Significant probability values are denoted as *P< 0.05, **P< 0.01,***P< 0.001,#P< 0.05 and###P< 0.001.
3. Results
3.1 In vitro cytotoxicity of glabridin on cultured B16 cells
MTT assay was performed to investigate thein vitrocytotoxic effect of glabridin on B16 cells. As shown in Fig. 1, glabridin did not affect the viability of B16 cells at lower concentrations up to 30 μmol/L, whilst it did do so at higher treatment concentrations(35, 40 and 55 μmol/L). These results indicate that glabridin is not cytotoxic to B16 cells at concentrations not higher than 30 μmol/L.Therefore, the concentrations of 5 and 30 μmol/L were chosen in the following experiments with B16 cells.
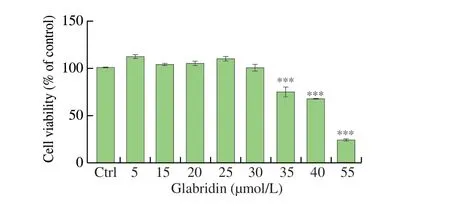
Fig. 1 Cytotoxicity of glabridin on murine B16 melanoma cells. B16 cells were seeded at a density of 5 × 10³ cells/well in 96-well tissue culture plates and cultured for overnight. Then, cells were treated with various concentrations of glabridin (5, 15, 20, 25, 30, 35, 40 and 55 μmol/L) for 48 h, then assessed for cell viability by MTT assay. The viability of treated cells was calculated as percentage of that of untreated “control” cells, set as 100%. Ctrl, control. All values are shown as mean ± SEM (n = 3). *** P < 0.001 vs Ctrl, by Student’s t test.
3.2 Molecular docking simulations of glabridin interaction with TYR and MITF
Molecular docking was performed to identify the potential interactions of glabridin with TYR and MITF. Tropolone, as a native inhibitor of TYR, is predicted by docking simulation to bind with TYR through forming a hydrogen bond with Asn260 residue and two non-hydrogen bonds with 2 copper ions in the active site (Fig. 2a).The docking RMSD for tropolone and TYR was determined as 0.46 that is below 2.0, indicating the accuracy and reliability of the herein used docking procedure. Theα-arbutin is predicted to bind to TYR through forming hydrogen bonds with Asn260 and Met280 residues and also forming a non-hydrogen bond with one copper ion in the catalytic site (Fig. 2b). As shown in Fig. 2c, glabridin is predicted by docking simulation to bind to the active site of TYR through forming hydrogen bonds with Met319 and Glu322 residues.Glabridin may bind to MITF as well through forming hydrogen bonds with Arg216 and Asn219 residues in the DNA binding site of MITF, indicating its possible direct inhibition on MITF transcriptional activity (Fig. 2d).
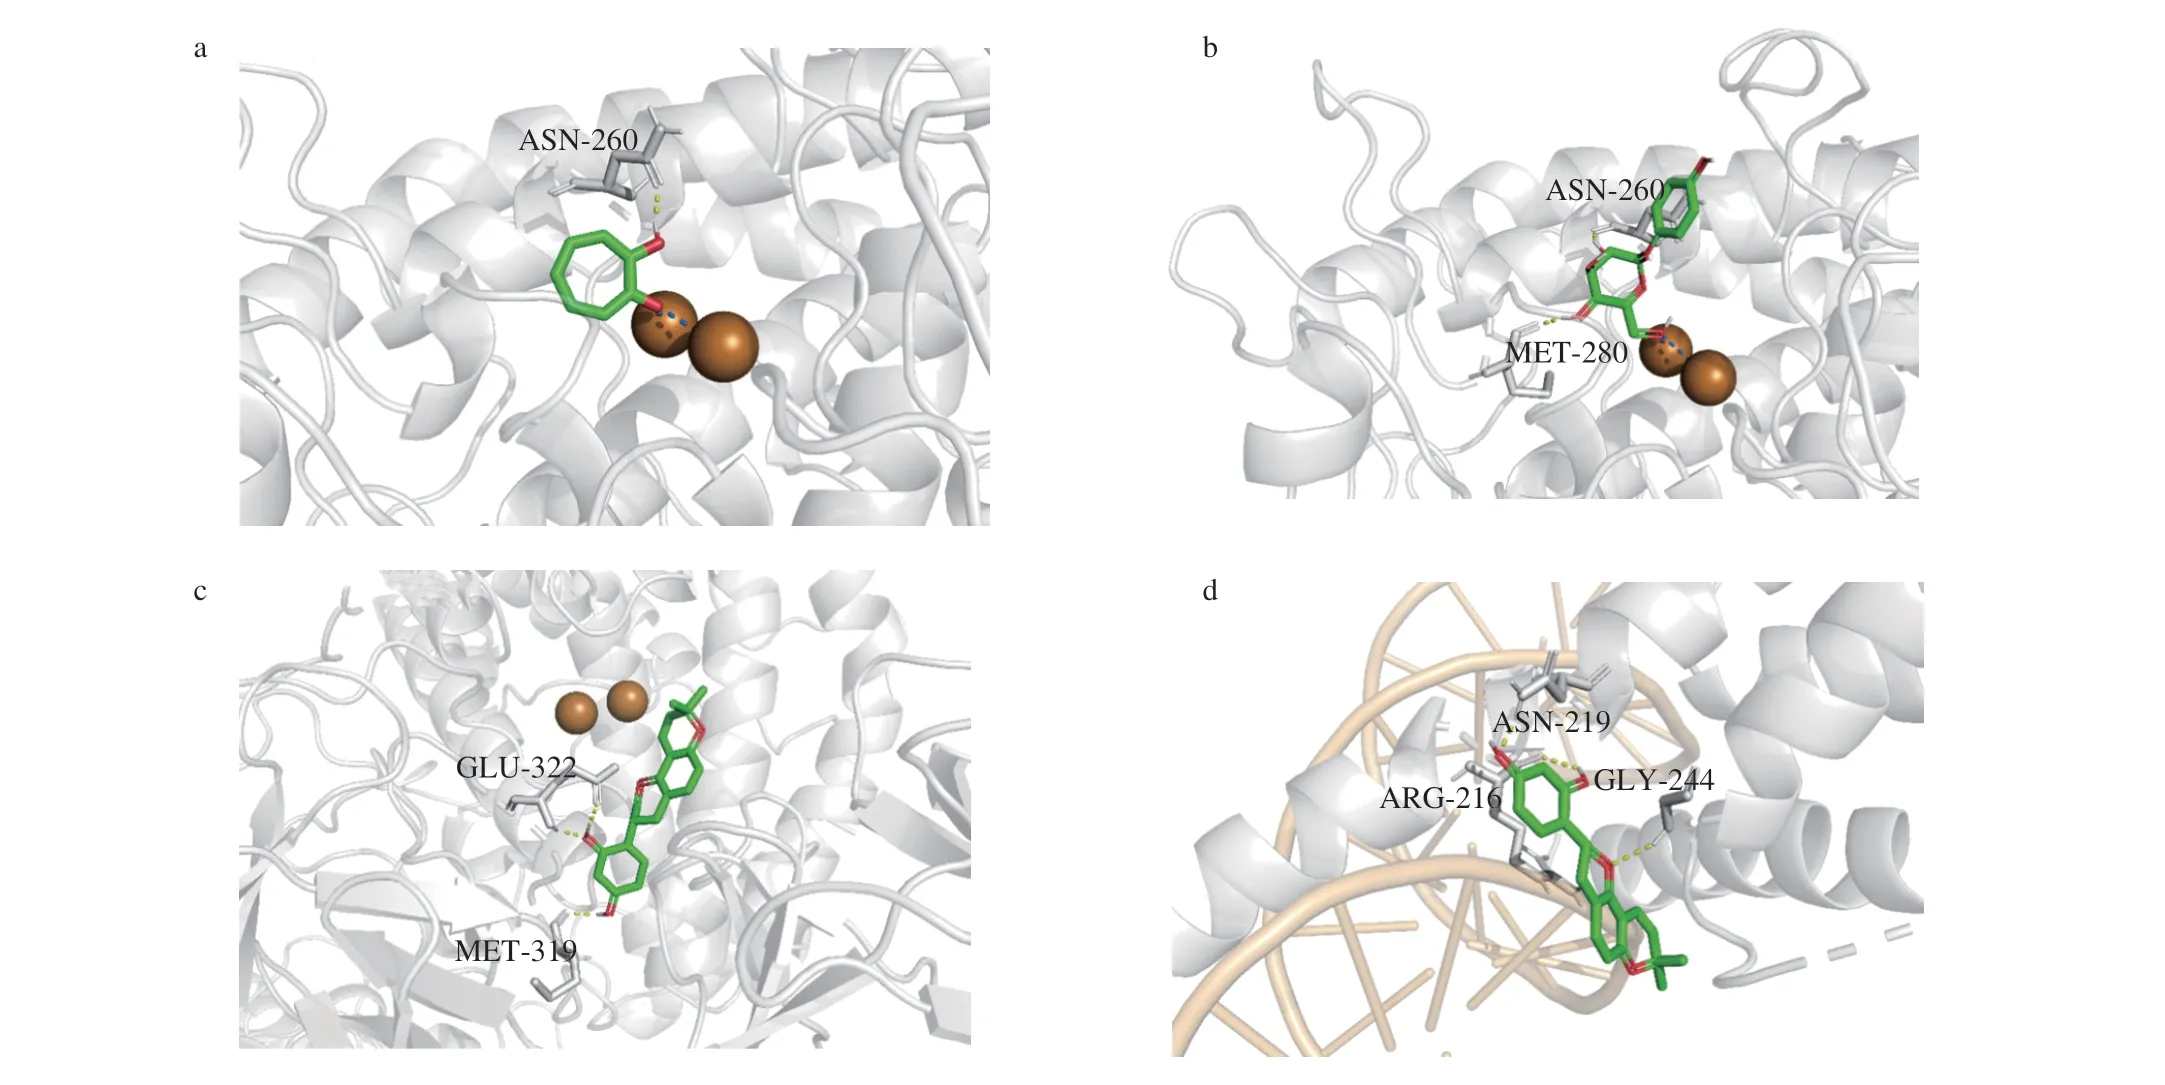
Fig. 2 Molecular docking simulation of interactions between TYR, MITF and compounds. The computed surface structure of TYR interacting with (a) tropolon, (b)α-arbutin, (c) glabridin, (d) glabridin. The grey stick parts show the catalytic core residues of TYR, where two Cu ions in golden are also situated. The tropolone,α-arbutin, glabridin, and glabridin are presented mainly as green coarser stick structure and situated in the catalytic core domain of TYR. The dashed blue line represents coordination bond. The dashed yellow line represents hydrogen bonding. The yellowish helix structure in (d) represents DNA.
Docking energy is a parameter for estimating the interaction between a ligand and its receptor. As shown in Table 2, the docking energy of glabridin with TYR and MITF was –7.16 and –6.67 kcal/mol,respectively. In contrast the known TYR inhibitorsα-arbutin and tropolone showed TYR docking energy of –4.37 and –4.89 kcal/mol,respectively. This indicates that glabridin can bind to TYR and MITF and form stable complexes. Glabridin may have higher TYR binding affinity thanα-arbutin and tropolone considering its lower docking energy. Collectively, these above data suggest that glabridin can bind to both TYR and MITF to regulate their functions.
3.3 Assessment of inhibition of tyrosinase activity and melanogenesis by glabridin in vitro
There have been some reports that glycyrrhizin is a potent tyrosinase inhibitor [9-11]. The activities of TYR include monophenolase and diphenolase to catalyze the conversion ofL-tyrosine to L-DOPA first and then to dopaquinone. To check the inhibitory effect of glabridin on TYR, the activity inhibition on both TYR monophenolase and diphenolase was evaluated, respectively,using the mushroom-derived tyrosinase in the presence of glabridin orα-arbutin, a known inhibitor of TYR. As shown in Fig. 3a,α-arbutin produced TYR activity inhibition rates of 60.49% at 5 000.0 μmol/L in the monophenolase activity assay. The obtained IC50is 4 164.48 μmol/L forα-arbutin. By contrast, glabridin demonstrated TYR activity inhibition of 73.32% and 97.1% at 5.0 μmol/L and 25.0 μmol/L,respectively, showing an IC50of 4.33 μmol/L, which is 961.66-fold lower than that ofα-arbutin. In diphenolase activity assay,α-arbutin produced TYR activity inhibition of 44.52% and 57.12% at 1 000.0 μmol/L and 2 000.0 μmol/L, respectively. The obtained IC50is 962.60 μmol/L forα-arbutin. By contrast, glabridin demonstratedTYR activity inhibition rates up to 68.07% and 92.11% at 5.0 μmol/L and 25.0 μmol/L, respectively, showing an IC50of 1.09 μmol/L, which is 883.12-fold lower than that ofα-arbutin. These data revealed that glabridin is much more potent thanα-arbutin on the inhibition of tyrosinase activity.
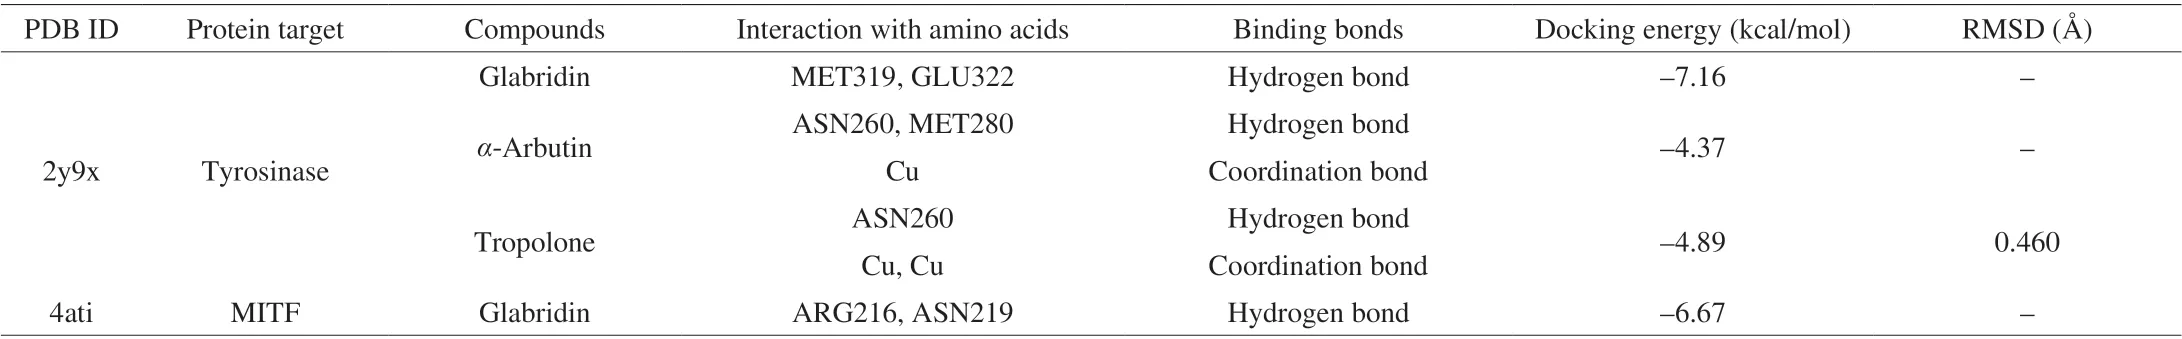
Table 2 The docking results of glabridin on tyrosinase and MITF.
To further examine the inhibitory effect of glabridin on tyrosinases,B16 murine melanoma cells were used for cellular TYR activity assay. B16 cells were first pretreated withα-arbutin or glabridin for 12 h, then stimulated for melanogenesis byα-MSH treatment for 36 h.Subsequently, the activity of TYR in B16 cells lysates was measured using L-DOPA as the substrate. As shown in Fig. 3b, after treatment withα-MSH, B16 cells showed tyrosinase activity of 123.15% relative to that of control cells treated by vehicle only (100%). By contrast,when cells pretreated with 1.0 mmol/Lα-arbutin, cellular TYR activity significantly dropped to 97.43% (P< 0.001). Notably, after pretreatment with glabridin at 5.0 and 30.0 μmol/L, the TYR activity of B16 cells significantly dropped to 88.38% and 43.81% comparing with control,respectively. These data suggest that glabridin is more efficient for inhibition of L-DOPA oxidation thanα-arbutin.
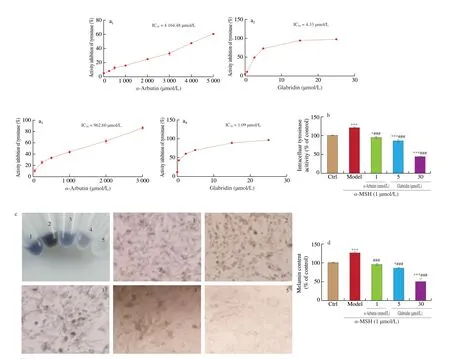
Fig. 3 Inhibition effects of glabridin on mushroom tyrosinase, intracellular tyrosinase, and melanogenesis. (a) Determination of inhibitory effects of glabridin (0.5,2.5, 5.0, 15.0 and 25.0 μmol/L) and α-arbutin (250.0, 500.0, 1 000.0, 2 000.0, 3 000.0, 4 000.0 and 5 000.0 μmol/L) on mushroom tyrosinase activity, respectively.(b) Tyrosinase activity was determined in B16 cells in the absence or presence of α-MSH (1.0 μmol/L). B16 cells were pretreated with two different concentrations of glabridin (5.0 and 30.0 μmol/L) and α-arbutin (1.0 mmol/L) for 12 h, respectively, and then stimulated with 1.0 μmol/L of α-MSH for additional 36 h. (c) Tube labeling 1-5 represent the treatment by vehicle (Ctrl), 1.0 μmol/L α-MSH (Model), 1.0 mmol/L α-arbutin, 5.0 μmol/L glabridin or 30.0 μmol/L glabridin, respectively and the imaging of the cell contents in each tube after magnification under the microscope. Magnification: 200×. (d) After harvesting cells, cellular melanin content was determined with same number of cells. All values are shown as mean ± SEM (n = 3) . * P < 0.05, ** P < 0.01 and *** P < 0.001 versus Ctrl, by ANOVA/Tukey-Kramer multiple comparison test. ## P < 0.01 and ###P < 0.001 compared with α-MSH treatment only, by ANOVA/Tukey-Kramer multiple comparison test.
Having known that glabridin is a potent inhibitor of TYR that is crucial for melanin biogenesis, we next assessed the effect of glabridin on melanin biosynthesis in B16 cells. The obtained results were shown in Figs. 3c–d. Comparing with control cells whose melanin content was set as 100%, stimulation withα-MSH significantly increased melanin production to 126.75% in B16 cells. However,pretreatment of cells with 1.0 mmol/Lα-arbutin, 5.0 μmol/L or 30.0 μmol/L glabridin beforeα-MSH stimulation resulted in significantly reduced melanogenesis showing 95.81%, 86.22%and 50.03% production of melanin relative to control (100%),respectively. These data demonstrate that glabridin is more effective thanα-arbutin for the suppression of melanogenesis in cells.
3.4 The mechanism of melanogenesis regulation by glabridin in B16 cells
3.4.1 Glabridin treatment downregulated both transcript and protein expressions of melanogenesis-related factors
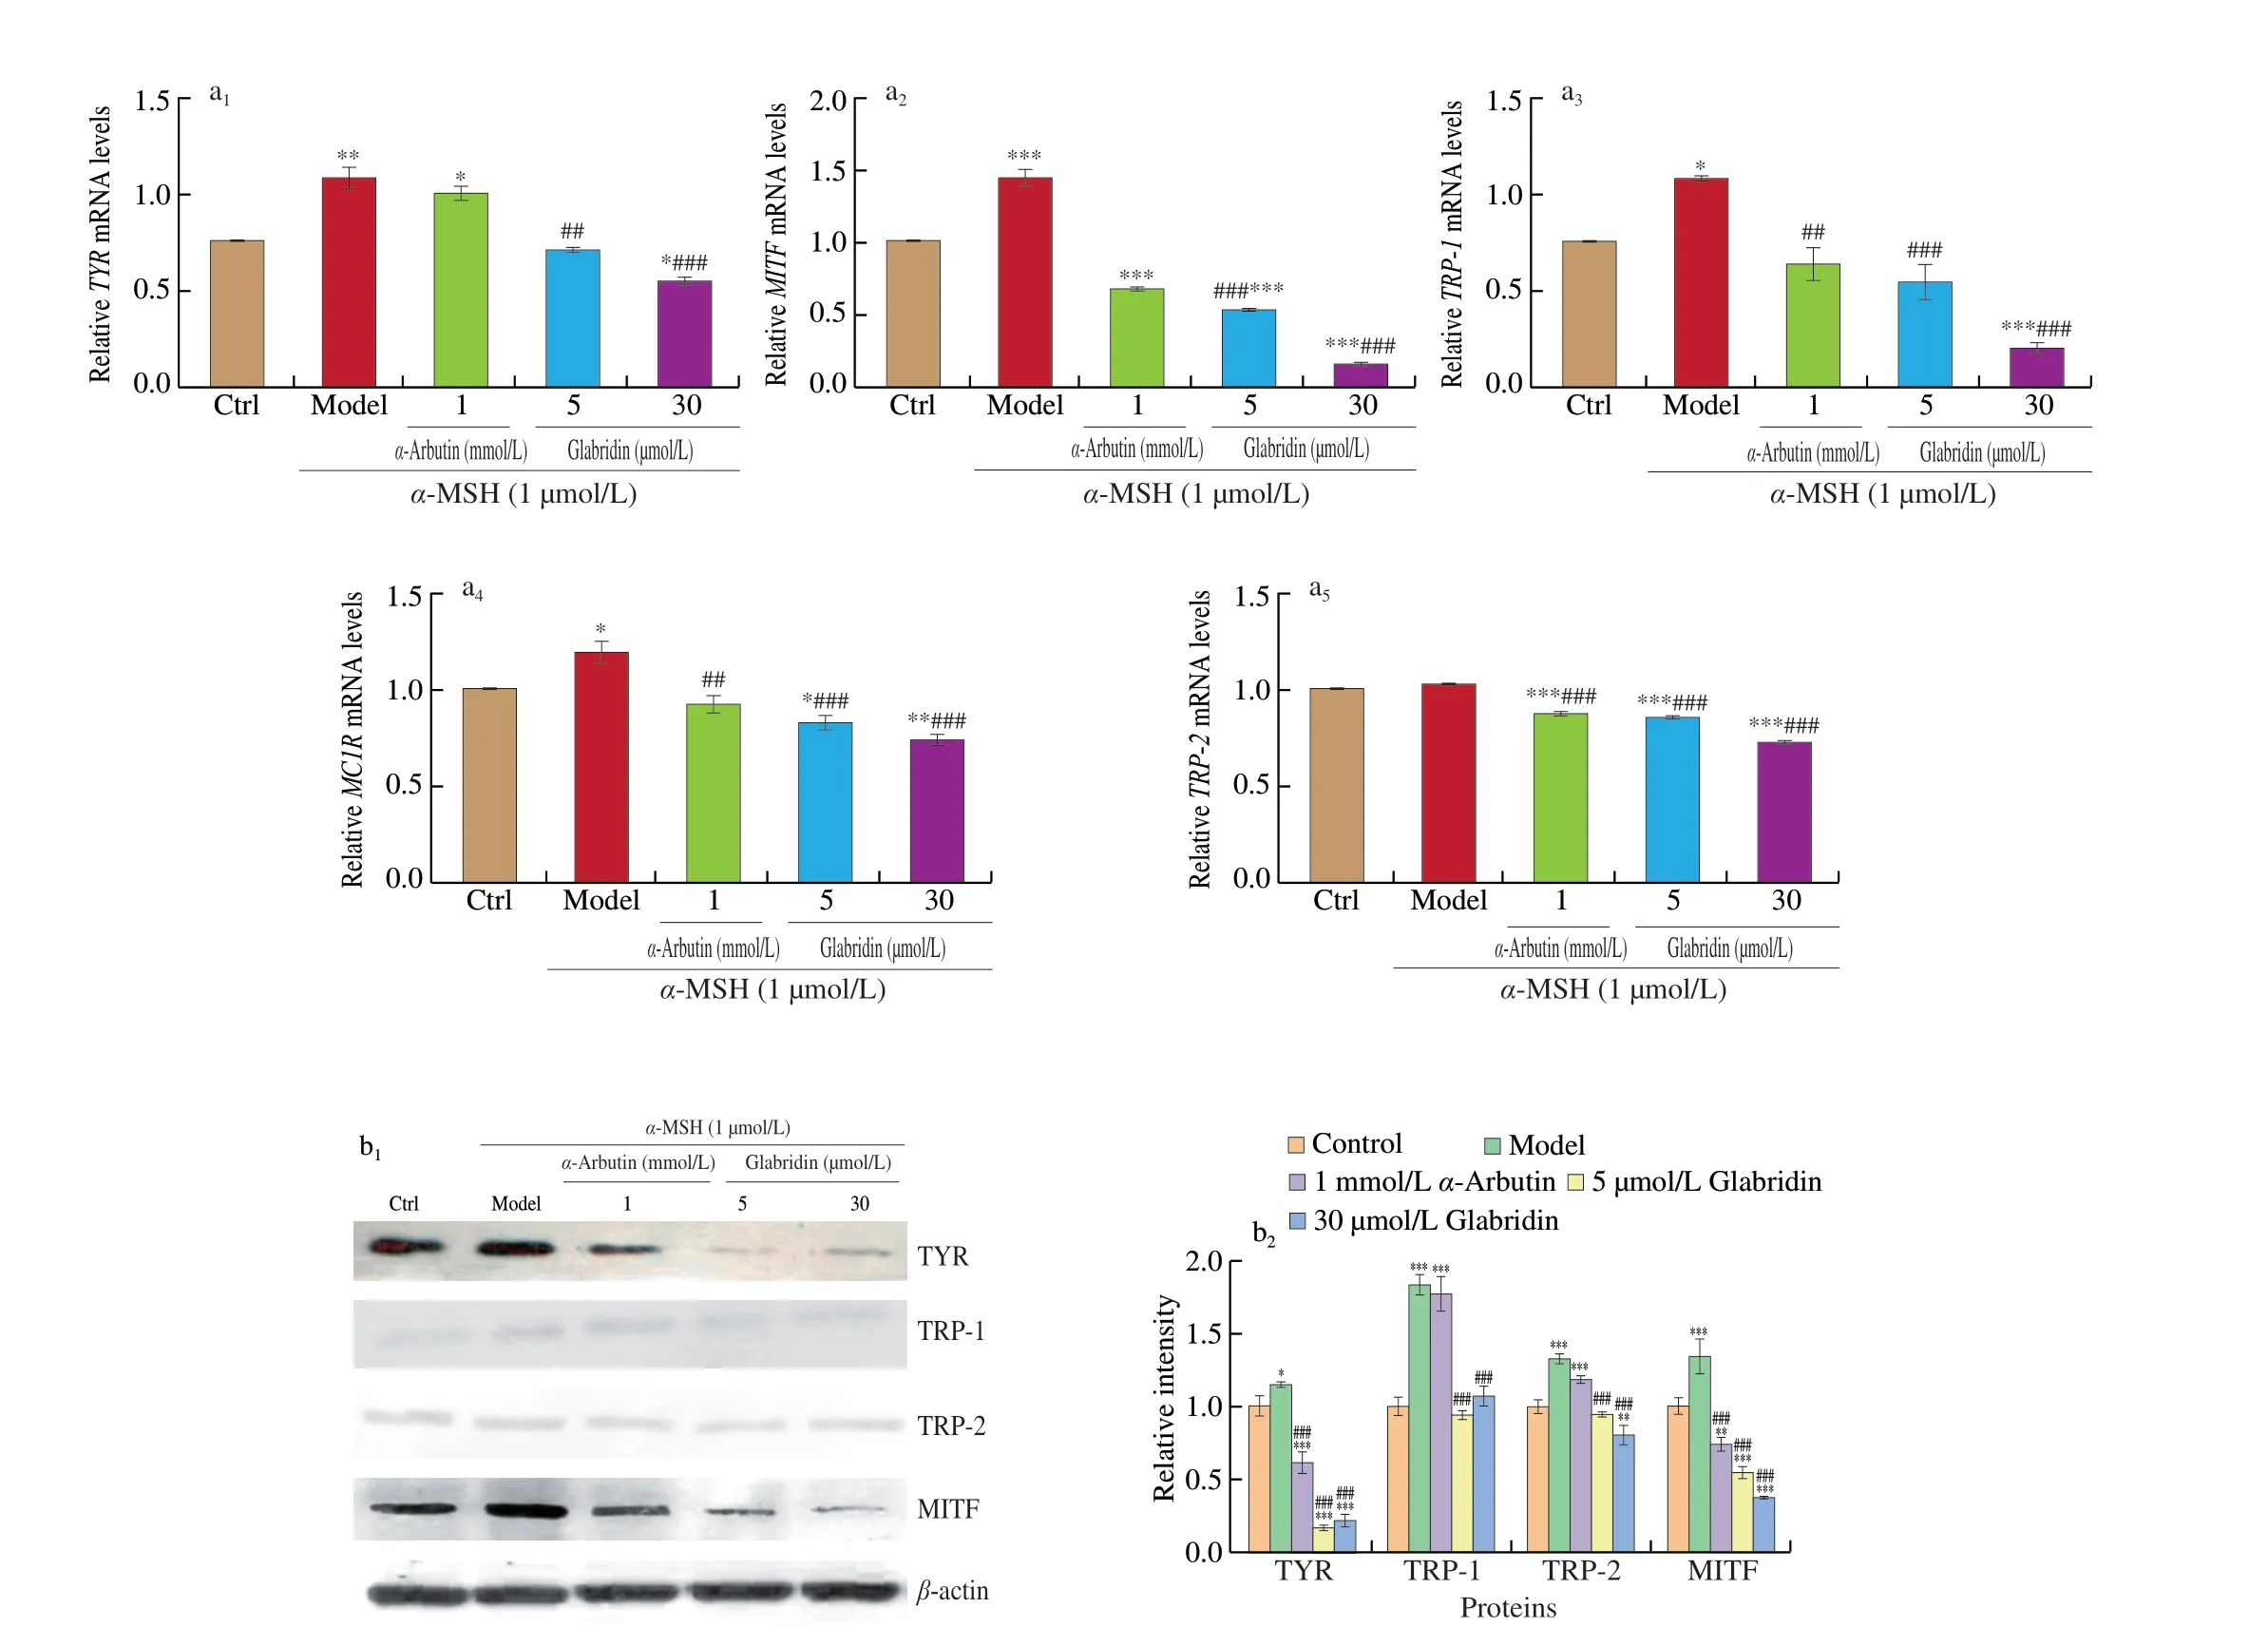
Fig. 4 Effects of glabridin on the expression of melanogenesis-related factors in B16 cells. (a) Relative quantification of mRNA expression by real-time quantitative PCR in B16 cells. (b) B16 cells (5 × 10⁵ cells/mL) were pretreated with two concentrations of glabridin (5.0 and 30.0 μmol/L) and α-arbutin (1.0 mmol/L) for 12 h, and then stimulated with 1.0 μmol/L of α-MSH for additional 36 h. Cells were collected using TRIzol. Cell lysates were prepared and assessed by Western blotting using antibodies against TYR, TRP-1, TRP-2, MITF and β-actin. The relative mean densitometry values were determined for target proteins from three independent experiments and shown as mean ± SEM (n = 3) using Quantity One. * P < 0.05, ** P < 0.01 and *** P < 0.001 compared with the control using the ANOVA/Tukey-Kramer multiple comparison test. ### P < 0.001compared with α-MSH treatment only using the ANOVA/Tukey-Kramer multiple comparison test.
It is known that melanogenesis is involved in the modulation of several melanogenesis-related proteins, such as MITF, TYR, TRP-1,TRP-2 [16], cAMP and the MC1R [13]. Therefore, to elucidate the mechanisms by which glabridin suppresses melanogenesis, the gene transcription of these above factors was first investigated in B16 cells by quantitative real-time PCR. As shown in Fig. 4a,α-MSH treatment significantly increased transcription ofMC1R,TYR,TRP-1,andMITFcomparing with control, but addition ofα-arbutin or glabridin significantly suppressed the transcription ofTYR,TRP-1,TRP-2,MITFandMC1R. Next protein expression was also examined for TYR, TRP-1, TRP-2 and MITF by immuno blotting. The obtained results (Fig. 4b) demonstrated that TYR, MITF, TRP-1 and TRP-2 were all upregulated byα-MSH treatment. However, the glabridin treatment significantly decreased the expression of TYR, TRP-1,TRP-2, and MITF reversing theα-MSH stimulated effects. Glabridin exhibited a stronger ability to down-regulate the protein expression of melanin production-related factors thanα-arbutin. Collectively these data suggest that glabridin inhibits melanogenesis through downregulation of the expression of melanogenesis-related factors in both RNA and protein levels.
3.4.2 Suppression of melanogenesis by glabridin is mediated via inactivation of PKA/MITF signaling pathways in B16 cells
Theα-MSH is also known to induce the production of cAMP that functions to increase TYR activity in melanocytes via PKA signaling pathway [17,18]. Thus, we also addressed the possible effects of glabridin on modulation of PKA signaling pathway in B16 cells. First,the level of cAMP was measured inα-MSH stimulated B16 cells with or without glabridin pretreatment. As shown in Fig. 5a, the cAMP level of B16 cells was significantly increased byα-MSH stimulation.However, the pretreatment of cells byα-arbutin or glabridin significantly reduced the cAMP induction byα-MSH. Subsequently the downstream components of PKA pathway, including PKA and CREB were examined for both total protein and phosphorylated protein expression. As shown in Fig. 5b, neither total PKA nor total CREB was affected for expression by any treatment. In contrast,α-MSH treatment significantly upregulated the phosphorylation levels of both PKA and CREB in B16 cells. Notably, pretreatment of cells byα-arbutin or glabridin significantly decreased the expression of p-PKA and p-CREB. Taken together these data show that the suppression of melanogenesis by glabridin is involved in the inhibition of PKA signaling pathway.
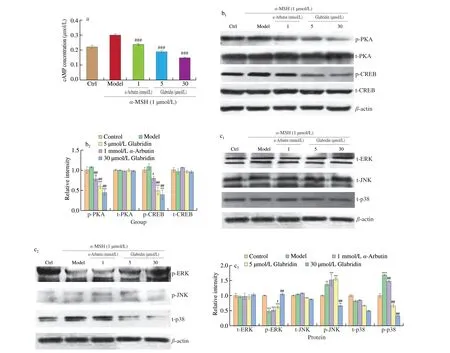
Fig. 5 Effects of glabridin on the expression of melanogenesis-related factors in PKA and p38 MAPK pathways. B16 cells were cultured for 24 h before pretreatment with two concentrations of glabridin (5.0 and 30.0 μmol/L) and α-arbutin (1.0 mmol/L) for 12 h, respectively, then stimulated with 1.0 μmol/L of α-MSH for additional 36h. (a) Intracellular cAMP levels were measured using a cAMP specific ELISA kit. (b) Cell lysates were prepared and assessed for target protein expression by Western blotting using antibodies against t-PKA (total-PKA), p-PKA (phosphor-PKA), p-CREB and t-CREB, respectively. (c) Detection of protein expression by Western blotting using antibodies against p-ERK, t-ERK, p-JNK, t-JNK, p-p38, t-p38 and β-actin, respectively. The band intensity was normalized to the β-actin band using Quantity One. The relative mean densitometry values were determined for target proteins from three independent experiments and shown as mean ± SEM (n = 3) using Quantity One. ** P < 0.01, *** P < 0.001 and ****P < 0.000 1 compared with the control using the ANOVA/Tukey-Kramer multiple comparison test. #P < 0.05 and ###P < 0.001 compared with α-MSH treatment only using the ANOVA/Tukey-Kramer multiple comparison test.
3.4.3 The MAPK/MITF signaling pathway is involved in the suppression of melanogenesis by glabridin in B16 cells
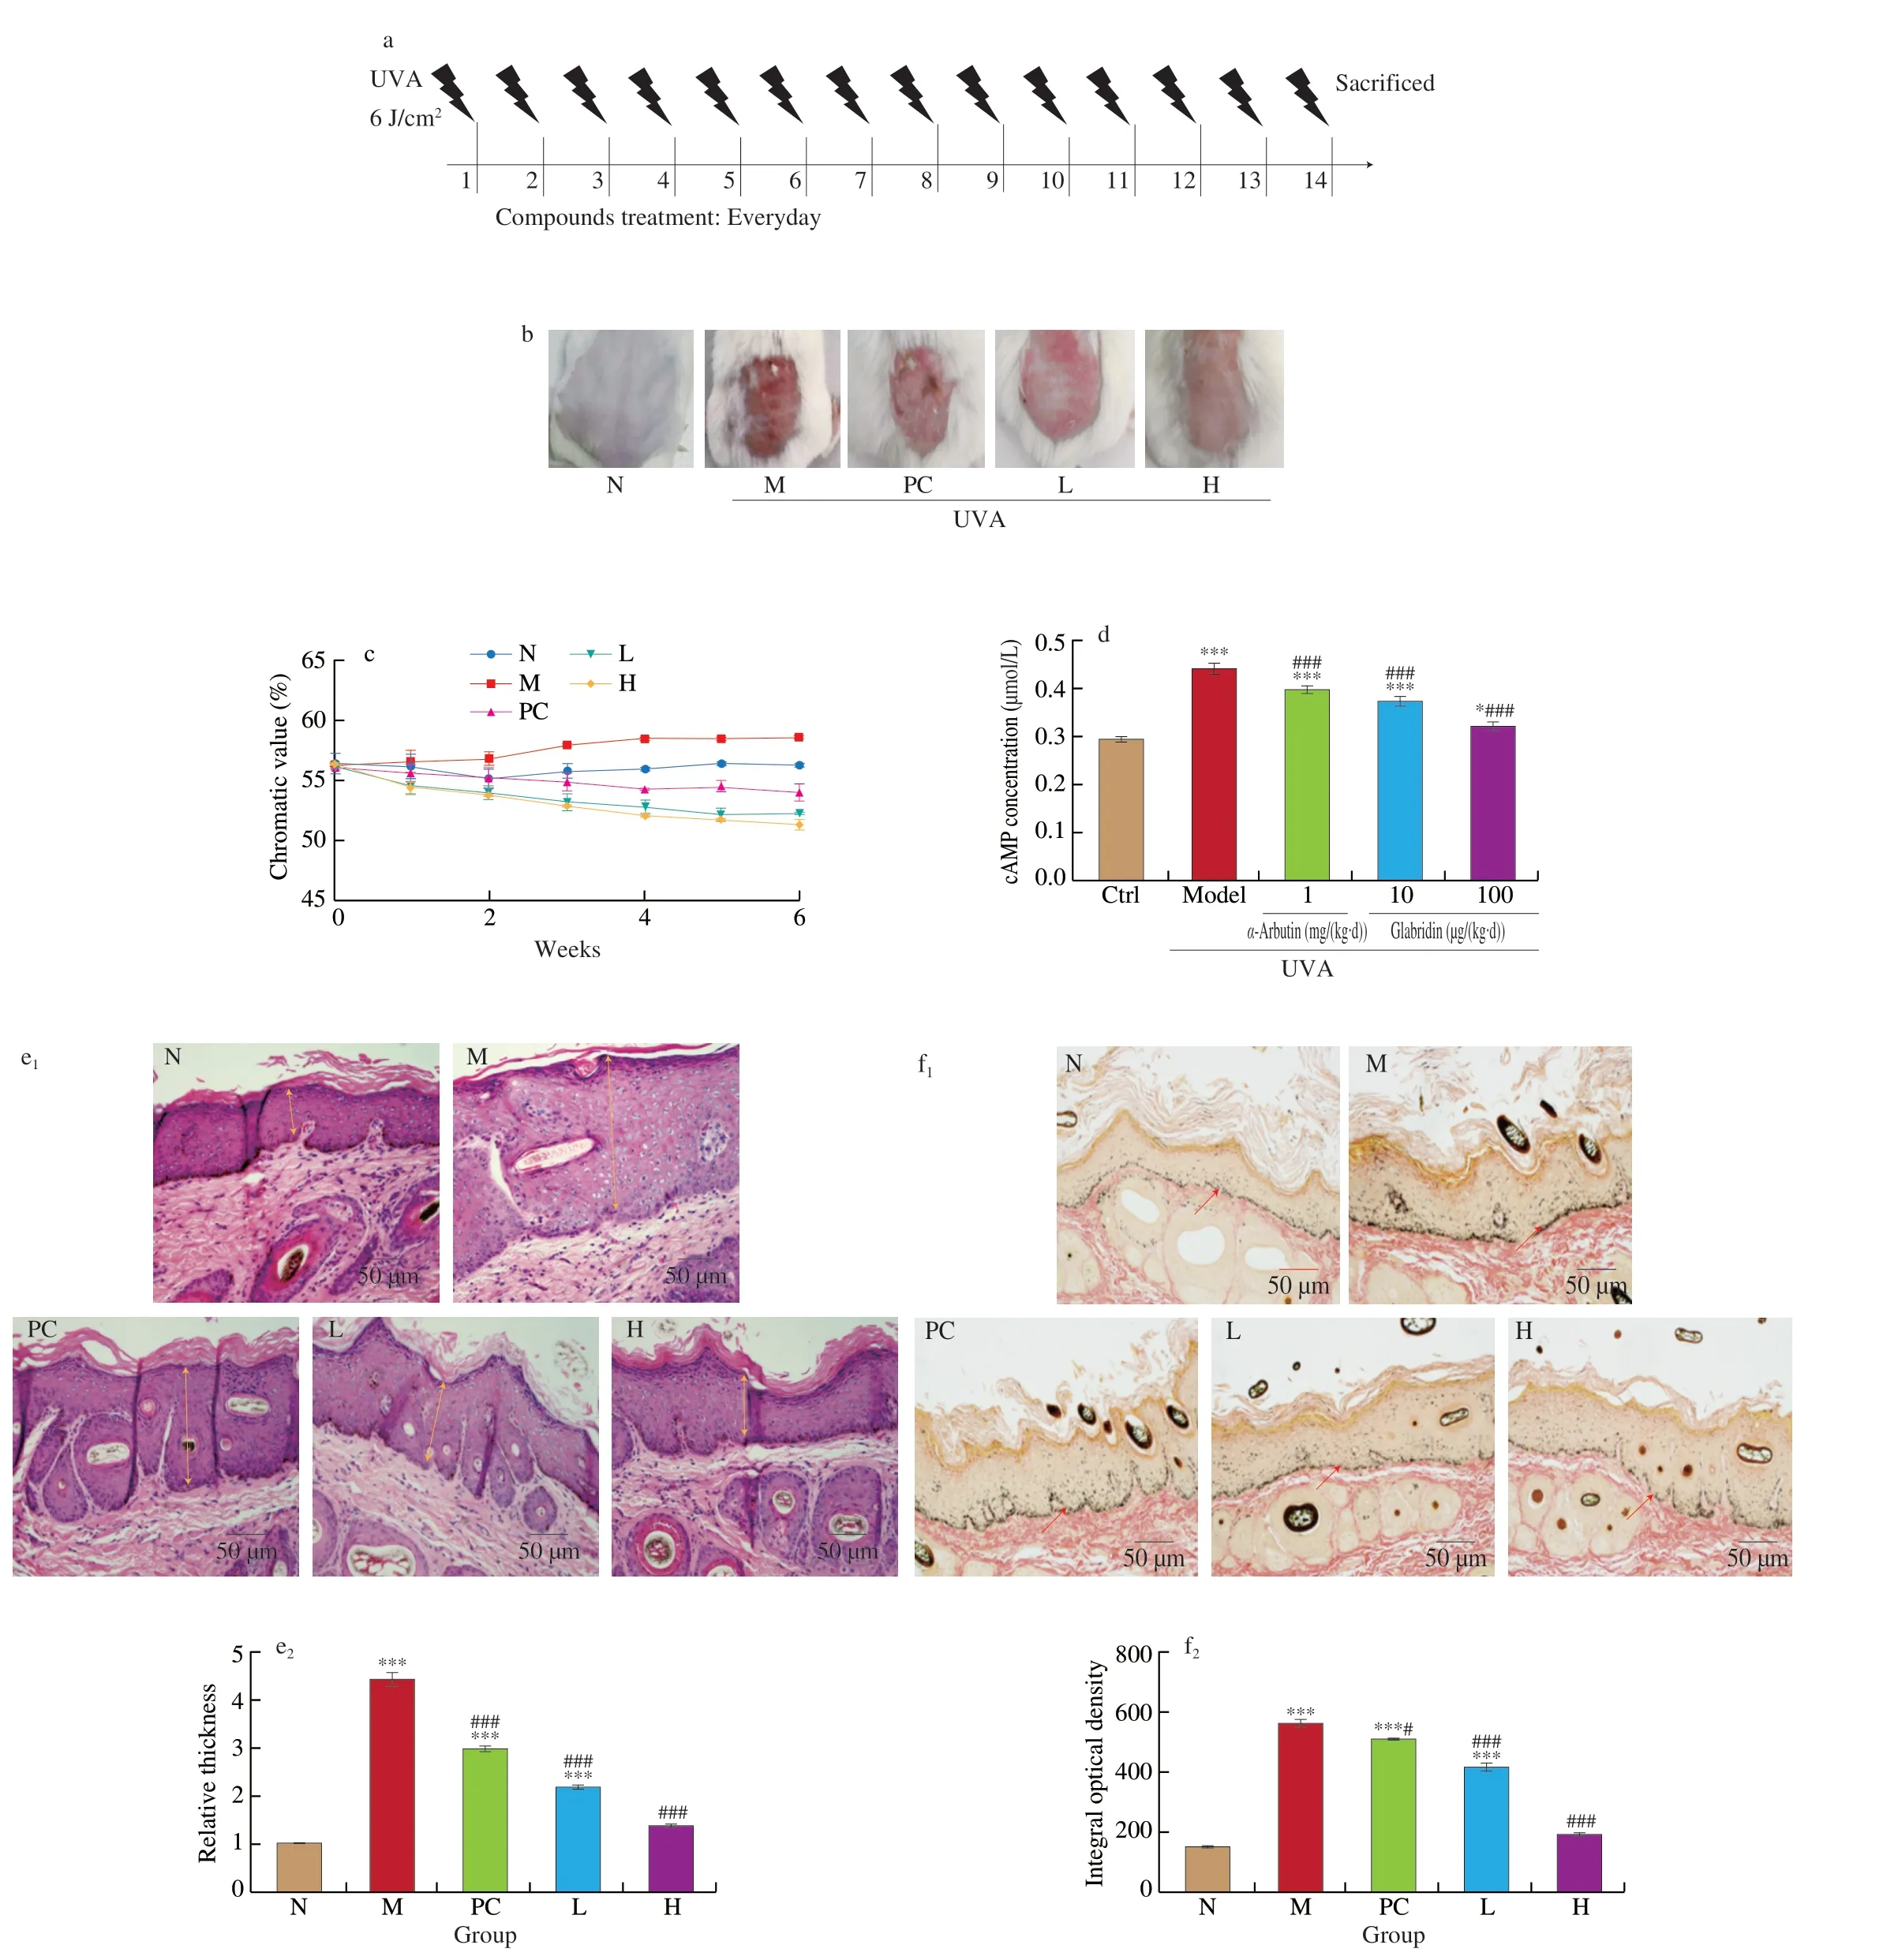
Fig. 6 Effects of glabridin on the histological changes of skin pigmentation and expression of melanogenesis-related genes in UVA-radiated BALB/c mice.There were 30 mice tested in total, which were randomly grouped into 5 groups with 6 mice per group. (a) Animals were exposed to UVA in a ABio-Sun system illuminator (Vilber Lourmat) at 6 J/cm2 according to the experimental schedule. (b) Representative photographs showing the appearance of the dorsal skin area at the end of the two-week experimental period. (c) The chromaticity value of mice skin. (d) Effects of glabridin on the expression levels of cAMP after stimulation with UVA in mice. (e) Glabridin suppresses the UVA-induced epidermal thickening. Representative photographs of hematoxylin and eosin-stained dorsal skin sections obtained at the end of the experiment. Magnification: 200 ×. (f) Glabridin suppresses the UVA-induced increase skin pigmentation. Magnification: 200-fold. *P < 0.05, ***P < 0.001 compared with the control, by ANOVA/Tukey-Kramer multiple comparison test. #P < 0.05 and ### P < 0.001 compared with α-MSH treatment, by ANOVA/Tukey-Kramer multiple comparison test.
MITF is essential for regulation of TYR expression and its expression is regulated by the MAPK signaling pathway [19].To examine the possible role of MAPK in the modulation of melanogenesis, the important MAPK pathway members ERK, JNK and p38 were investigated for their both total and phosphorylated protein expression in B16 cells with or without glabridin treatment.As shown in Fig. 5c, none of ERK, JNK and p38 was affected for total protein expression by a-MSH or/and glabridin treatment. In contrast,the a-MSH treatment stimulated the upregulation of phosphorylated p38 (p-p38) but decreased the expression of p-ERK. Importantly,pretreatment of cells by glabridin reversed the upregulation of p-p38 byα-MSH and significantly downregulated the expression of p-JNK comparing with model treatment. Also, the expression of p-ERK was reverted by glabridin but not byα-arbutin treatment in a-MSH treated cells. These data thus suggest that p38 MAPK signaling is also involved in the suppression of melanogenesis by glabridin in B16 cells.
3.5 Glabridin inhibits UVA radiation-induced melanogenesis and skin hyperpigmentation in mice
To evaluate thein vivoanti-melanogenesis activity of glabridin,dorsal skins of mice were daily exposed to UVA radiation for 60 min and then topically treated on radiated sites with different concentrations of glabridin solution as scheduled in Fig. 6a. Dermal chromatic values, epidermal thickening and melanin deposition in skin were measured to assess treatment efficacy. As shown in Fig. 6b,upon UVA radiation but without treatment, exposed mice skin showed inflammatory and hyperpigmented symptoms such as skin roughness,erythema and black spots. However,α-arbutin treatment as the positive control, demonstrated less severe conditions, and importantly glabridin treatment showed further improvement of skin condition.Skin chromaticity was measured to evaluate the effect of glabridin therapy on skin hyperpigmentation in tested mice. The obtained results were shown in Fig. 6c and Fig. 6f, which demonstrated thatα-arbutin treatment reduced skin hyperpigmentation, and glabridin therapy appeared further improvement comparing withα-arbutin treatment. As shown in Fig. 6d, the cAMP level was significantly increased by UVA radiation on dorsal skin. However, treatment by eitherα-arbutin or glabridin significantly reduced the stimulated cAMP expression. Additionally, glabridin showed higher efficiency thanα-arbutin for reducing the stimulated cAMP expression in radiated mice. These data demonstrate that glabridin is very effective for improving UVA radiated skin condition.
The H&E staining was performed to examine epidermal thickening induced by UVA exposure. As shown in Fig. 6e, UVA radiation significantly stimulated epidermal thickening, butα-arbutin treatment can attenuate such effects. Notably glabridin therapy also led to attenuation of epidermal thickening, showing even better efficacy than theα-arbutin treatment.
To detect melanin production, skin biopsies were collected from UVA-exposed sites of mice with or without 6-week topical treatment,stained by Fontana-Masson silver stains, viewed and imaged by light microscopy. As shown in Fig. 6f, UVA exposure stimulated significant increase of melanin accumulation in basal layer of epidermis. However, bothα-arbutin and glabridin treatment effectively reduced the melanin deposition. Importantly, glabridin appeared more effective thanα-arbutin for reducing the melanin accumulation in epidermis of mice. Taken together, these data suggest that glabridin therapy could alleviate UVA-induced skin inflammation, melanin biosynthesis and accumulation in epidermis of mice.
4. Discussion
Although there are many transcription factors involved in the melanogenesis process, MITF is the most heavily studied one on melanogenesis with the agreement that CREB/MITF axis is the most critical pathway in UVR/α-MSH-stimulated adaptive melanogenesis [20].Glabridin is a kind of isoflavones, which has important influence on food, dietary supplements and cosmetics markets [21].Previously glabridin had shown positive effects in many aspects including regulation of energy metabolism, LDL protection against oxidation, estrogenesis, neuroprotection, anti-obesity,anti-osteoporotic, and skin-whitening [22]. So far, the inhibition mechanism of melanogenesis by glabridin has not been completely resolved yet, although glabridin has been shown to downregulate the expression of MITF [12] In this study, we revealed that the inhibition of melanogenesis by glabridin is associated with the suppression of cAMP/PKA/CREB/MITF and p38/MAPK/MITF signaling pathways.
Many studies have shown that PKA signaling pathway plays an important role in melanogenesis. Cyclic AMP (cAMP) can upregulate the expression of MITF through activation of PKA and CREB, which binds to and triggers the TYR promoter for TYR gene transcription and thus increases its protein expression [23]. This study indicates that glabridin can inhibit melanin biosynthesis by decreasing the expression of p-PKA and p-CREB.
In addition to PKA signaling pathway, many studies have shown that MAPK signaling pathway components including ERK,p38 and JNK are also involved in modulation of melanogenesis in melanocytes [24]. Therefore, we studied the regulation of MAPK signaling pathway by glabridin. The significant downregulation of both p-p38 and p-JNK but upregulation of p-ERK by glabridin in B16 cells suggests that p38 MAPK signaling is closely involved in the modulation of melanogenesis.
In this study, depigmentation effects were observed following topical application of glabridin to UVA-exposed skin in BALB/c mice, reflecting the role of the natural compound on inhibition of tyrosinase activity and thus the suppression of melanogenesis. Also observed effects of glabridin on skin homeostasis is the reduction of both epidermal thickness and skin roughness in UVA-radiated BALB/c mice. What signaling pathways are linked to this skin homeostasis maintenance remains not clear. No doubt it needs further elegant investigations to find out the molecular mechanism underlying such skin healthcare effects of glabridin.
In conclusion, our results clearly demonstrated that glabridin can effectively inhibit the biological synthesis of melanin bothin vitroandin vivo, through the suppression of both PKA/MITF and MAPK/MITF pathways. Also, glabridin therapy is effective for antihyperpigmentation, anti-roughness and anti-epidermal thickening and thus beneficial for skin healthcare.
Declaration of competing interest
We declare that the research was conducted in the absence of any commercial or financial relationships.
Acknowledgement
This study was supported by the Inner Mongolia Autonomous Region Science and Technology Revitalization Foundation(2021CG0029) and the National Natural Science Foundation of China(22178070).

- 食品科学与人类健康(英文)的其它文章
- Wine, beer and Chinese Baijiu in relation to cardiovascular health:the impact of moderate drinking
- Comparative analysis of physicochemical properties, ginsenosides content and α-amylase inhibitory effects in white ginseng and red ginsen
- Monitoring and identif ication of spoilage-related microorganisms in braised chicken with modif ied atmosphere packaging during refrigerated storage
- Effect of cooking processes on tilapia aroma and potential umami perception
- Formation mechanisms of ethyl acetate and organic acids in Kluyveromyces marxianus L1-1 in Chinese acid rice soup
- Volatile prof ile and multivariant analysis of Sanhuang chicken breast in combination with Chinese 5-spice blend and garam masala