
Optimization of Charging/Battery-Swap Station Location of Electric Vehicles with an Improved Genetic Algorithm-Based Model
2023-01-25 02:52BidaZhangQiangYanHairuiZhangandLinZhang
Bida Zhang,Qiang Yan,Hairui Zhang and Lin Zhang
1Beijing University of Posts and Telecommunications,Beijing,100876,China
2PLA Army Academy of Artillery and Air Defense,Zhengzhou,450000,China
3Beijing Information Science and Technology University,Beijing,100192,China
ABSTRACT The joint location planning of charging/battery-swap facilities for electric vehicles is a complex problem.Considering the differences between these two modes of power replenishment,we constructed a joint location-planning model to minimize construction and operation costs,user costs,and user satisfaction-related penalty costs.We designed an improved genetic algorithm that changes the crossover rate using the fitness value,memorizes,and transfers excellent genes.In addition,the present model addresses the problem of “premature convergence” in conventional genetic algorithms.A simulated example revealed that our proposed model could provide a basis for optimized location planning of charging/battery-swapping facilities at different levels under different charging modes with an improved computing efficiency.The example also proved that meeting more demand for power supply of electric vehicles does not necessarily mean increasing the sites of charging/battery-swap stations.Instead,optimizing the level and location planning of charging/battery-swap stations can maximize the investment profit.The proposed model can provide a reference for the government and enterprises to better plan the location of charging/battery-swap facilities.Hence,it is of both theoretical and practical value.
KEYWORDS Charging/battery-swapping facility;genetic algorithm;location planning;excellent gene cluster
1 Introduction
With the ever-growing energy consumption and increase in the environmental effects of fossil-fuel based energy sources,the use of collection technology of clean energies has undergone a remarkable growth in the Chinese market[1].In 2020,the ownership of electric vehicles(EVs)in China reached approximately 4.5 million,which is expected to exceed 21 million by 2025,and 65 million by 2030.The number of battery-swap EVs has also exhibited an evident growth tendency.In fact,the number of EVs in 2021 was 155,900,an increase of more than 30% compared to that of 2019,including approximately 79,000 private passenger vehicles,accounting for nearly 50%.With the advancement of wind energy,solar energy,and other new energy industries,the demand for energy storage systems is worth increasing[2].Moreover,as reported by the Chinese Electric Vehicle Charging Infrastructure Promotion Alliance,the number of charging facilities (public and private) reached 1.87 million nationwide in May 2021,marking a 43.9% annual growth.Nevertheless,half of the owners of EVs have no household charging piles and must rely on public charging facilities.As the central government proposed the need to“increase the number of charging piles and battery-swap stations”in China’s Government Work Report,for the first time in March 2021,battery-swap stations have gained popularity and been promoted along with fast-charging facilities.The two modes of power replenishment(i.e.,charging and battery swap)are expected to develop together in the future.
However,power replenishment systems for EVs still face several challenges.First,the total number of available facilities is still lower than the demand,despite the fact of increasing initiatives to build more charging/battery-swap facilities.In addition,existing facilities often suffer from low utilization rates and poor customer perception because of spatial and temporal randomness and uncertainty in the need for power replenishment [3].The conflicts between the increasing need for EVs,power replenishment,and the limited investments in charging/battery-swapping facilities have curbed the development of EVs.Therefore,an efficient method to optimize the location planning of charging/battery-swap facilities,improve their utilization,and enhance customers’perception is required.
Research on methods for optimized location planning of charging/battery-swap stations has advanced.Cheng et al.[4] proposed a cost minimization model that considered the investments of charging networks,depreciation costs for EVs,and investments in power distribution networks.Yang et al.[5] established a new multi-target model that aimed at minimizing the construction cost of charging piles and maximizing the average capacity of charging stations.Song et al.[6] proposed a location selection method for fast-charging stations that considered the operators,drivers,vehicles,traffic flows,and power grids.Existing works on the location planning of charging/battery-swap stations mainly focused on one or multiple of the following aspects: the income of the power grid operator [7,8],investment in charging facilities [9,10],user costs [11,12],and new types of energy storage devices[13,14].Most reported studies have created a location optimization problem with the following objectives:minimum cost,maximum fulfillment of needs,and maximum efficiency.Many achievements have been reported from various investigations regarding location planning methods of charging and battery-swap stations.However,no reports have explored the simultaneous location planning of fast-charging and battery-swap stations to achieve effective coordination between these two types of charging facilities.In the present work,we considered the location selection problem of these two types of facilities and established a joint location planning model of charging/battery-swap facilities to minimize the sum of construction,operation,charging,traveling,and penalty costs.
Location selection modeling is a complicated optimization problem that makes it almost impractical to use the traditional linear algorithm[15].The global optimal solution is difficult to be obtained by predominantly adopting heuristic algorithms such as the particle swarm optimization(PSO)[16],genetic(GA)[17],firefly[18],simulated annealing[19],artificial neural network[20],and improved algorithms [21].Standard heuristic algorithms cannot provide an accurate and efficient solution to the joint location-selection modeling problem of charging/battery-swap facilities.For example,in the GA,the population diversity decreases after selection,and the population presents phenotype consistency during convergence,resulting in premature convergence.Two optimization solutions have been reported to address this problem.First,before the first round of inheritance,the operators are modified or upgraded under the premise that the individual with the largest fitness value has a high probability of being selected[22–24].The second solution is to introduce a new notion after the first round of inheritance or use the population maturity degree as an indicator to evaluate whether the algorithm prematurely converges and hence improve the inheritance strategy [25,26].However,the improved GAs proposed in previous studies are not suitable for the combined optimization problem of complicated systems that consider the location selection of both charging and batteryswap facilities.Although many studies have focused on the location planning of charging and batteryswap stations,very few have combined these two in location selection.To fill this research gap,in this work,we constructed a model for location planning including both charging and battery-swap facilities to optimize the level and location planning of charging/battery-swap stations and to maximize the investment profit.
2 Model Description and Construction
In addition to differences in the investment and operation costs,charging and battery-swap facilities also differ in their selection of locations.As the investors vary,we considered only fastcharging/battery-swap facilities.When planning the locations of the charging/battery-swap facilities,the demand for power replenishment of EVs drivers must be met.Simultaneously,the social costs should be minimized,including the station construction,operation,and driver’s energy replenishment costs.Thus,the following three objectives should be considered in the construction of the location planning model:
(1) Minimizing the gross cost of construction and operation of charging/battery-swap facilities;
(2) Minimizing the driver’s traveling costs,including the time and fees spent on driving,charging,and waiting;
(3) Minimizing the penalty cost (i.e.,minimizing the EV driver’s dissatisfaction),which involves two scenarios.First,when all charging piles are occupied,some drivers would leave.This results in a reduced customer perception.Second,the proportion of the overall battery-swap facilities is low(for both types of charging facilities).Because of the large traveling distances between battery-swap stations,drivers may opt for the fast-charging piles for power replenishment,which also results in a lower customer perception.
2.1 Model Hypotheses
(1) In the network,there are two types of fast-charging facilities:fast-charging stations(40–60 min for a full charge)and battery-swap stations(3–5 min for a full charge);
(2) There are two types of EVs in the road network: the charging and battery-swap types.The charging type can only be recharged by fast-charging piles,whereas battery-swap EVs can be recharged by either fast-charging piles or battery-swap stations;
(3) Regardless of the traffic conditions and driver habits,power consumption has a simple linear correlation with the driving distance;
(4) Given the limited capacity of a charging station,when the number of vehicles exceeds the number of charging piles in the station,there are considerable waiting times.However,the swap process is quick and no waiting time is incurred.
2.2 Cost Analysis
2.2.1 Construction and Operation Cost
(1) Level of charging/battery-swap stations
According to the“Technical Specifications of Electricity Supply and Assurance for Electric Vehicle:Electric Vehicle Charging Station”[27]released by the government of Beijing,charging stations for EVs can be classified into four levels with different battery storage,single-way power distribution,and daily service capacities.Table 1 shows the division of these levels.
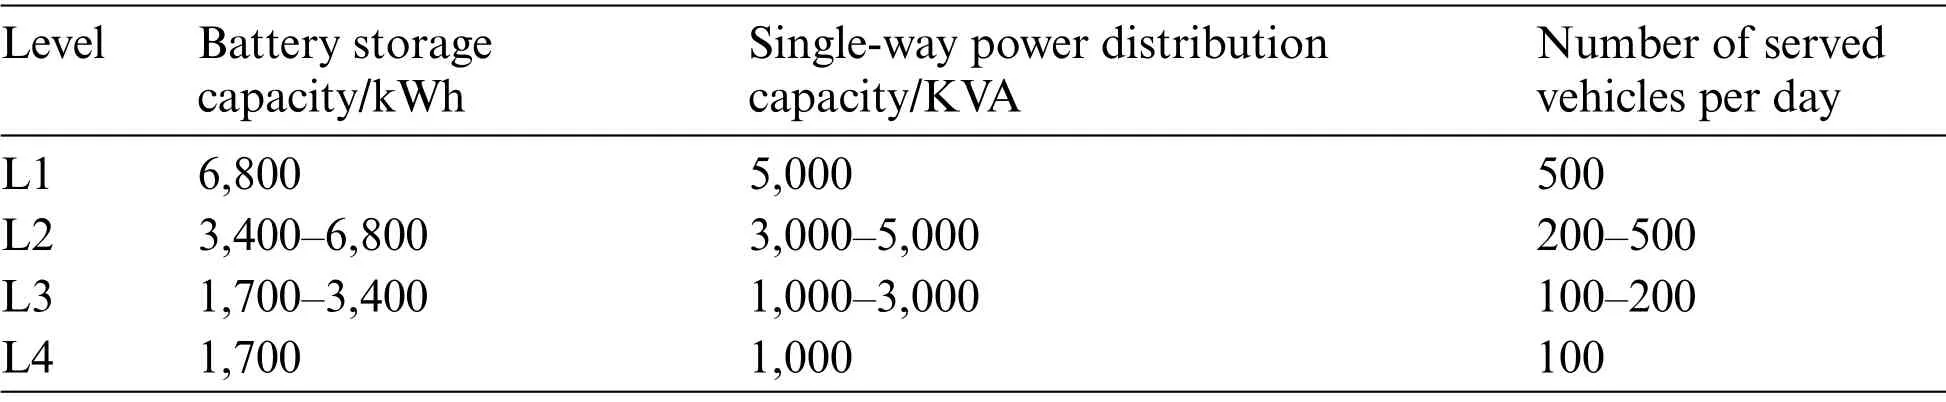
Table 1: Levels of charging/battery-swap facilities
(2) Construction cost
In the construction of charging/battery-swap stations,costs include land and facility costs,where the facility cost involves spending on the power distribution system and the charging/battery-swap system.For battery-swap stations,additional large-scale batteries must be installed.Based on the notions of discount rate and depreciable life,the costs for the construction of fast-charging and batteryswap stations are expressed asand,respectively:
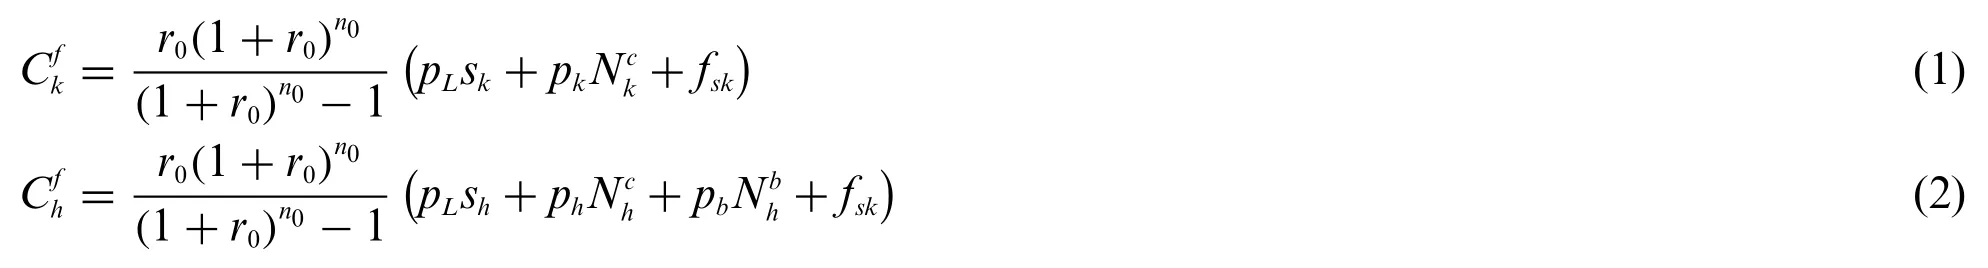
whereskis the building area of the fast-charging station,pLis the unit price of land,pkis the construction cost of a single unit of a fast-charging facility,is the number of fast-charging facilities,fskis the construction cost of the power distribution system,shis the building area of the battery swap station,phis the construction cost of a single battery-swap facility unit,is the number of battery swap facilities,pbis the unit price of the batteries,is the number of batteries reserved in the swap station,r0is the discount rate,andn0is the depreciable life.The construction costs for fast-charging facilities () and battery-swap stations () of different levels can be obtained,wheremrepresents the level of the facilities.Table 2 lists the specific costs.
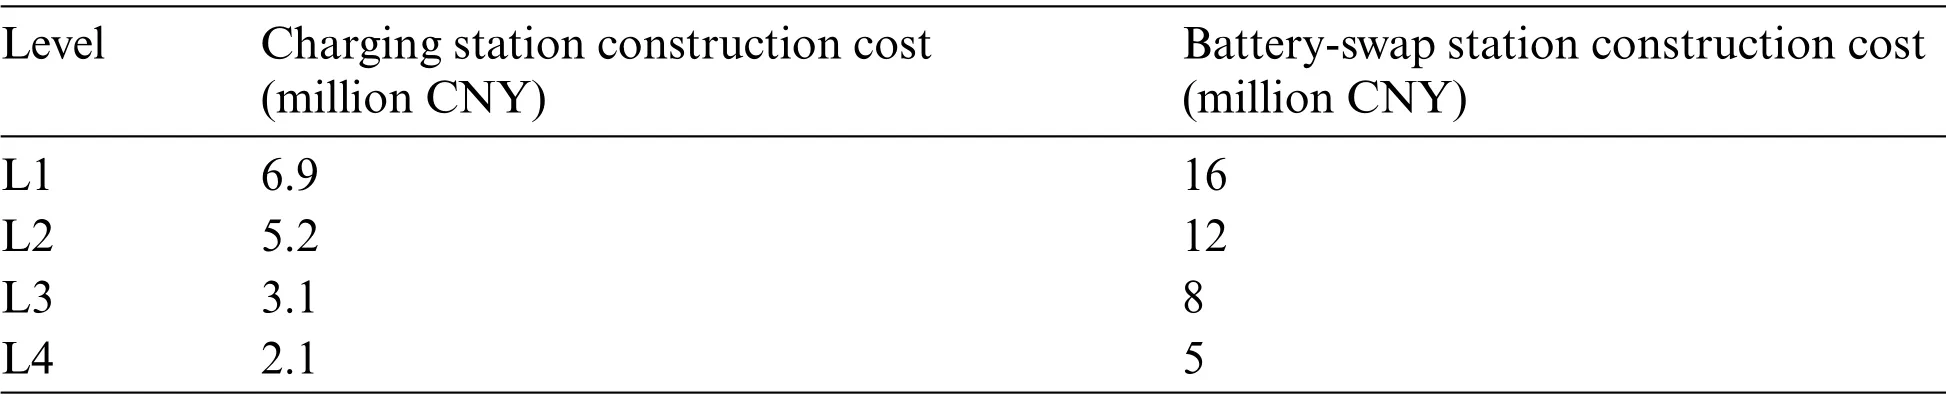
Table 2: Construction cost of charging and battery-swap facilities
(3) Operation cost
The operation cost consists of the labor,material,and maintenance costs,which are calculated based on the construction costs.We assume that the conversion coefficient between the operation cost and the construction cost isγ,and the annual operation costs for the fast-charging and battery-swap stations are expressed asand,respectively:

2.2.2 User Cost
The time cost of users for charging-type EVs consists of three parts: the driving,charging,and waiting times.In battery-swap vehicles,the time cost of users mainly refers to the driving time,whereas the time for battery swapping and waiting is largely negligible,and the time required for battery swapping is irrelevant to the remaining power of the EV.
(1) Vehicle types
Based on the service purposes,the EVs are divided into two categories:passengers’EVs(private cars and operating vehicles)and commercial EVs(logistics vehicles and buses).They differ in terms of the frequency and method of power replenishment.
A.Private cars distributed in residential and office areas mainly rely on public power replenishment stations to recharge slowly.Charging-type vehicles rely on fast-charging piles to recharge,and the charging time varies with the remaining electricity,power rate of the charging piles,and user’s expectation of fully charging the vehicle or not.Battery-swap vehicles mainly rely on battery-swap facilities.However,if the time required by the battery-swap vehicle at siteito reach the nearest swap station exceeds the time it takes to reach the closest charging station plus the waiting time,there is a probability(εi)that the swap-type vehicle will opt for the closest charging station instead of the battery-swap station:

where
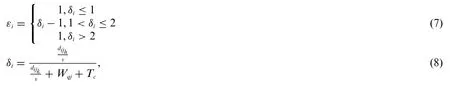
where the average waiting time at charging stationjisWqj,and the charging time isTc.
B.Operating vehicles,including taxis and online-hailing cars,rely primarily on public charging stations.In scheduled rotations,the operating vehicles often do not have considerable time to stay at the station for charging; thus,when they are short of electricity,they will need quick charging,depending on fast charging or battery swaps for power replenishment.
C.Commercial vehicles generally rely on charging stations specifically built by the vehicle operators;hence,this type of vehicle is not considered in the present work.
(2) Waiting cost
In the fast-charging service,the EVs conform to the hybrid multi-server queuing model(M/M/s/K),that is,the arrival time of the drivers conforms to the negative exponential distribution of the parameterλ.The number of servers is s,and the service time of each server is independent of each other,conforming to the negative exponential distribution of the parameterμ;the system space is K.According to the calculation equations for each indicator in the M/M/s/K queuing model,the expected queuing time for a vehicle at a charging station can be obtained,and the average length of the queue of waiting vehicles at the charging station is:

whereρsis the service strength of the queuing system of the charging station andPnis the probability distribution ofncustomers in the system.
Owing to limited system space,the effective arrival rate of customers(λe)should be considered.The customer loss rate isPK,and for a multiserver system,the following equation holds:

Then,using the formula for Little’s law,we obtain the expected queuing and waiting times.The average waiting time of a vehicle at charging stationjisWqj=L1/λe,and the charging time conforms toTc~N.
(3)Traveling cost power replenishment costs
A.The traveling costs of EVs requiring fast charging and battery swaps are denoted asand,respectively:
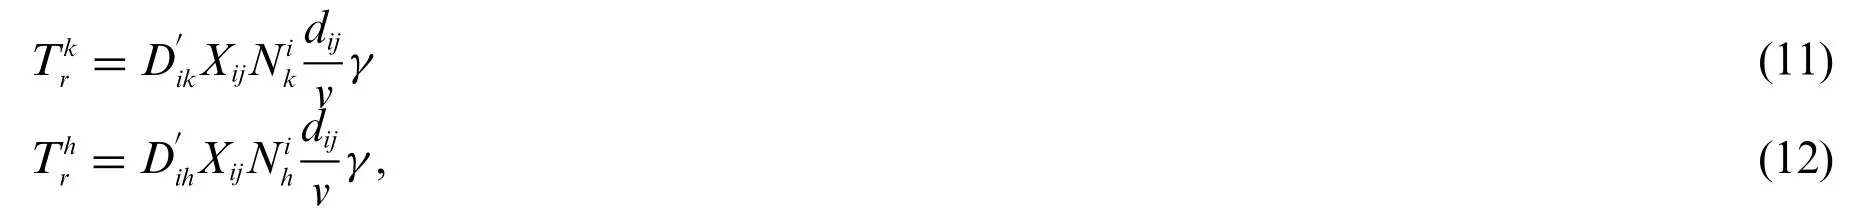
whereDikandDihare the number of vehicles that require fast charging and battery swaps at site ofi,respectively,iis the demand site,anddijis the distance from the demand siteito the sitej.Xij∈{0,1} is a decision variable: when equal to 1,it means that the EV at the demand siteimoves to sitejfor charging;when it is 0,it means that the EV does not move to sitejfor charging.represents the average number of fast-charging vehicles per year,andrepresents the average number of battery swaps of a vehicle per year.
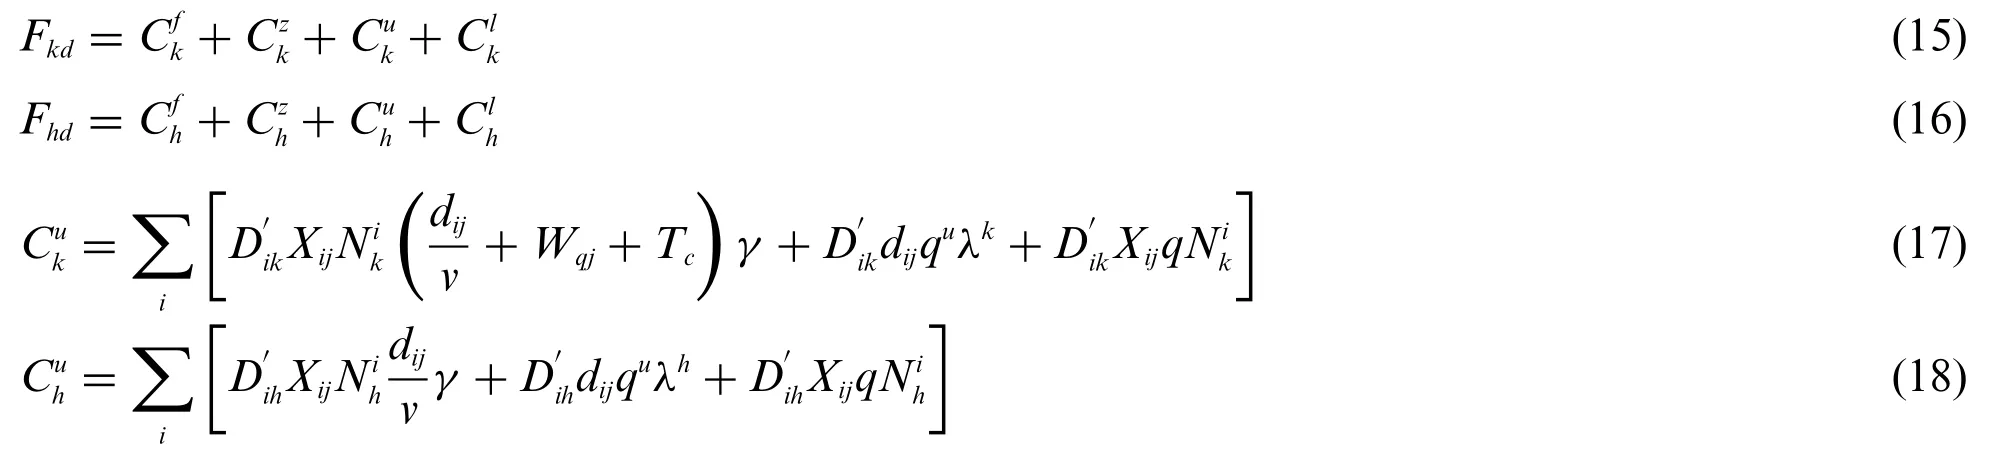
B.The electricity cost for traveling and power replenishment was also considered in the overall cost.In the case of EVs that rely on fast charging,the electricity cost for traveling isDikdijquλk,and that for power replenishment is.In the case of vehicles that rely on battery swaps,the electricity cost for traveling isDihdijquλh,and that for power replenishment is,wherequis the power consumption of the EV per kilometer,λkis the electricity rate for fast charging,λhis the electricity rate for battery swap,qis the one-time amount of charged electricity per vehicle(the charging volume is related to the remaining electricity of the vehicle,but irrelevant to battery swaps;the charging volume is linearly correlated to the charging time),is the number of battery swaps per vehicle per year,is the average number of charging times per vehicle per year.
2.2.3 Penalty Cost
A.In the case of vehicles that rely on fast charging,we must consider the customer’s loss caused by the limited system capacity and the corresponding penalty cost.The penalty cost is calculated based on the traveling time and power replenishment costs:

whereξis the penalty coefficient of customer losses of EVs.
B.As the vehicles that rely on battery swaps account for a small proportion of the total number of EVs,a scenario in which a penalty cost is incurred when the driver opts for the fastcharging station instead of the battery-swap station,when the latter is farther away,should be considered.This penalty cost is calculated based on the waiting and charging times:

whereϑis the penalty coefficient of customer loss of battery-swap-type EVs.
2.2.4 Data Sorting
The objective function for location planning of charging/battery-swap stations is established considering the construction and operation costs,waiting and traveling cost of the user,and penalty cost.
2.3 Objective Function
A total cost model was built based on the objective function of location planning of charging/battery-swap stations.

The constraints are as follows:
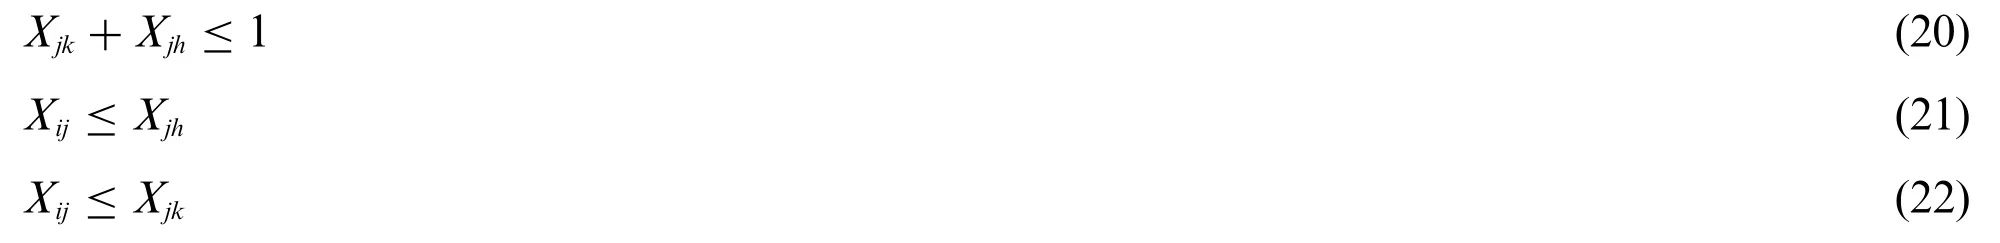
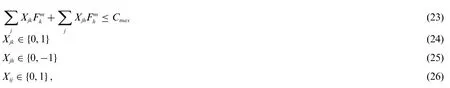
where the objective function in Eq.(19)represents the minimum sum of costs of charging and battery swap stations,including the construction,operation,driver access,and penalty costs.Constraint(20)means that only one candidate site can be used to construct one type of facility,either a charging station or a battery-swap station.Constraints(21)and(22)indicate that only when there are charging facilities(charging piles or battery-swap stations),vehicles will come to this site for charging.Constraint(23)considers the limits of governmental and corporate investments,and the maximum investment budget is set asCmax; constraint (24) is equal to 1 when a fast-charging station is built at candidate sitej;otherwise,it is equal to 0;constraint(25)is equal to-1 when a battery-swap station is built at candidate sitej;otherwise,it is equal to 0.Constraint(26)is equal to 1 when the EV at demand siteimoves to sitejfor charging;otherwise,it is equal to 0.
3 Improved Genetic Algorithm
Charging/battery-swap facility location selection modeling is a complex optimization problem.GA,which searches from the solution set and minimizes the probability of the local optimum,is an efficient,parallel,and global search method.However,it suffers from intrinsic shortcomings.First,it is likely to converge before the optimal or satisfying solution is reached,that is,the premature convergence problem.Second,during gene transmission,the excellent individual gene is susceptible to damage,which results in the loss of useful information.
The crossover operator,which is a key factor in the GA,can be optimized for specific tasks to improve its performance.This can be achieved in two manners:the first one is to improve the crossover operator.A dynamic adjustment factor of the crossover probability can be designed to dynamically adjust the operator in the evolution process,according to the fitness function.The second method is to search and memorize an excellent gene cluster to increase its likelihood of being passed on to the offspring.
3.1 Coding and Initial Population
(1) Decision variable of initial allocation
Population coding converts feasible solutions to problems into the search space of the GA.Thus,in the present work,a given number of candidate sites(the location of the candidate site overlaps with the location of the demand site)are selected according to the location planning principle of the charging piles and battery-swap stations.The traffic conditions and the candidate sites are encoded based on whether a charging facility will be built there or not.Specifically,the candidate site is expressed asjand is encoded as 1,2,...,j.The binary-encoded chromosomes arewhereXj∈{-1,0,1},corresponding to a fast-charging station,no charging station,or a battery-swap station constructed at sitej,respectively.There areNkelements encoded as 1,Nhelements as -1,and the sites waiting for the construction of a facility are {j1k,j2k,...,jNk} and {j1h,j2h,...,jNh},respectively.Leti= 1,and the distance between the demand siteiandjNk(jNk∈{j1k,j2k,...,jNk}),that is,{dij1k,dij1k,...,dijNk},can be obtained,from which the minimum distancedij*kcorresponding to the candidate sitej*kcan be identified;by assigning the demand siteito the candidate sitej*k,we will obtainXij*k=1.In addition,the demand for fast charging assigned to candidate sitej*k,where a facility is yet to be constructed,isDik.Then,the distance between demand siteiandjNh(jNh∈{j1h,j2h,...,jNh})is calculated,that isfrom which the minimum distancedij*hcorresponding to candidate sitej*his obtained.By assigning demand siteito candidate sitej*h,we achieveXij*h= 1,and the demand for fast charging assigned to candidate sitej*hisDih.Leti=i+1,the abovementioned procedures are repeated until all demand sitesi(i∈I)are assigned.In this manner,we can obtain the assigned demands for the construction of fast-charging piles and battery-swap stations.
(2) Identifying the level of the charging station and the battery-swap station(m)
Step 1:The service capacity of anm-level charging station isCmk.For alljNk(jNk∈{j1k,j2k,...,jNk}),ifCmk-1≤WjNk≤Cmkholds,the identification process terminates.For ∀jNk∈{j1k,j2k,...,jNk},ifWjNk >Cmk,then we proceed to Step 2.
Step 2:WhenWjNk >Cmk,all demand sitesijNkassigned to candidate sitejNk,where a facility is to be built,can be found,and the distances from all demand sites to the candidate site,dijNk,are calculated and sequenced.The demand site with the largest distance to the candidate site is removed and assigned to the second closest station one after another untilWjNk≤Cmkis satisfied.The set of demand sites and the level of candidate sites are updated,and we return to Step 1.
The two steps above describe the process of identifying the level of a candidate site for a charging station.The process in the battery-swap station is the same.Here,the distances from the demand site to the charging station and battery-swap station are considered together,and the demand for charging stations that are excessively far is assigned to a closer battery-swap station.
3.2 Fitness Function
The fitness function is the basis for evaluating the quality of the set of solutions and the standard for genetic selection,which is converted from an objective function.The objective of the location planning of charging and battery-swap stations in the present study is to minimize the annual operation cost while meeting the needs of drivers.Thus,the reciprocal of the objective function is considered as the fitness function.

3.3 Genetic Operation
3.3.1 Selection Strategy
The common fitness-proportionate selection technique,which is the roulette-wheel selection strategy,was employed in the present work.We assume that the population scale isnp,and substitute each individual in the population into the fitness function to obtain the fitness valuefiand the sum of the fitness of all individuals in populationF.The probability of each individual being selected was calculated aspi=fi/F,and the probabilities were summed into a rouletteto generate a random numbernbetween 0 and 1.Whenn <P1,the individuals encoded as 1 are selected; whenPi-1<n <Pi,the individuals encoded asiare selected until the parent population of a scale ofnpis selected.
3.3.2 Crossover and Mutation
The crossover and mutation operators are self-adaptively improved and the crossover operator dynamically changes according to the different stages of the population evolution.In the initial stage of population evolution,a strong crossover is adopted.When the population evolution decelerates and reduces to a local optimum,a weak crossover is adopted,and the mutation rate changes dynamically.We define the crossover probability as a sigmoid function,and map the fitness value to a range between 0 and 1:

whereΔ=favg-fmax;favgis the average fitness value,fmaxis the maximum fitness value,andK1is a constant.PCis the adaptive parameter of the crossover rate,which can be adaptively changed according to the fitness values of individuals during population evolution.1-PCis an adaptive parameter for mutation rate.Similarly,the mutation rate can be adaptively changed according to the fitness value of individuals during the population evolution.
3.3.3 Transfer of Excellent Genes
Individuals with high fitness values often share the same or a similar range of gene combinations,which can generate an excellent gene cluster.To reduce the search time and avoid damage to the excellent gene cluster when searching for a solution,we can extract candidate sites and demand sites with wide coverage to generate a set as a gene cluster to enhance the convergence speed.
(1) Division of the optimal solution search space.The set of fast-charging and battery-swap stations and the demand sites they cover are identified,and there arensets that form a gene cluster.For all individuals,the optimal solution search space is divided using the same method.Allmindividuals are sequenced in descending order of fitness value:B1,B2,...,Bm,

and the sequenced individuals are placed in the sets.
(2) Optimal gene cluster selection.For the firstnmindividuals in the sequence,nis the preset proportion of selection,and a weightbis assigned to allnmindividuals(top ranked individuals are assigned a larger weight).The same gene clusters among the individuals were marked.For similar gene clusters among the individuals,the product of the fitness value and weight of the gene cluster was obtained,and the cluster with a larger product was retained.
(3) Crossover of parent genes and generation of child gene clusters.Each gene cluster is regarded as a gene,and in crossover,two individuals exchange part of their gene clusters and genes outside the gene cluster crossover on a free basis.When child individuals are generated,the algorithm searches for a new gene cluster.
4 Simulation Example
4.1 Simulation Data
A simulated case was used to confirm the effectiveness of the proposed model.As shown in Fig.1,the simulation example is based on the main urban area of a city in Central China,with a total area of approximately 139.2 km2.Combined with statistical practice,30 sub-areas of energy supply demand in this area were studied and appropriate locations for the construction of charging stations were selected.
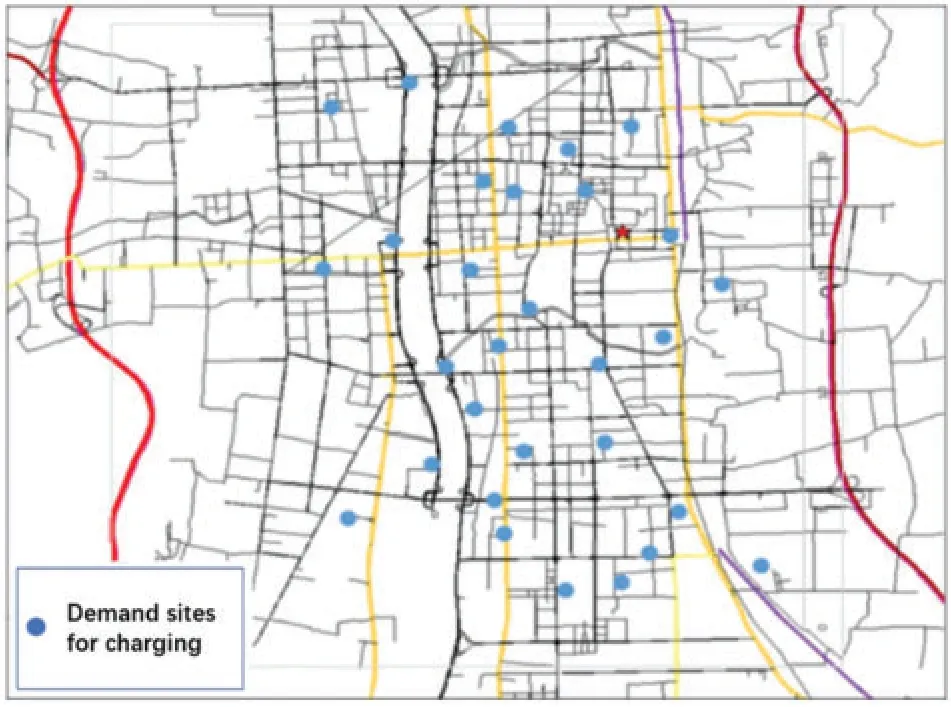
Figure 1:Area of simulation
There are 3,490 EVs in this region,of which 2,804 are charging vehicles and 686 are battery swap ones.The ratio of private cars to operating vehicles was 9.8:0.2.Private cars and operating vehicles need to charge 0.2 and 2 times per day at public charging facilities,respectively.Table 3 lists the locations and corresponding demand scales of the 30 demand sites,and Table 4 lists the specific parameters.
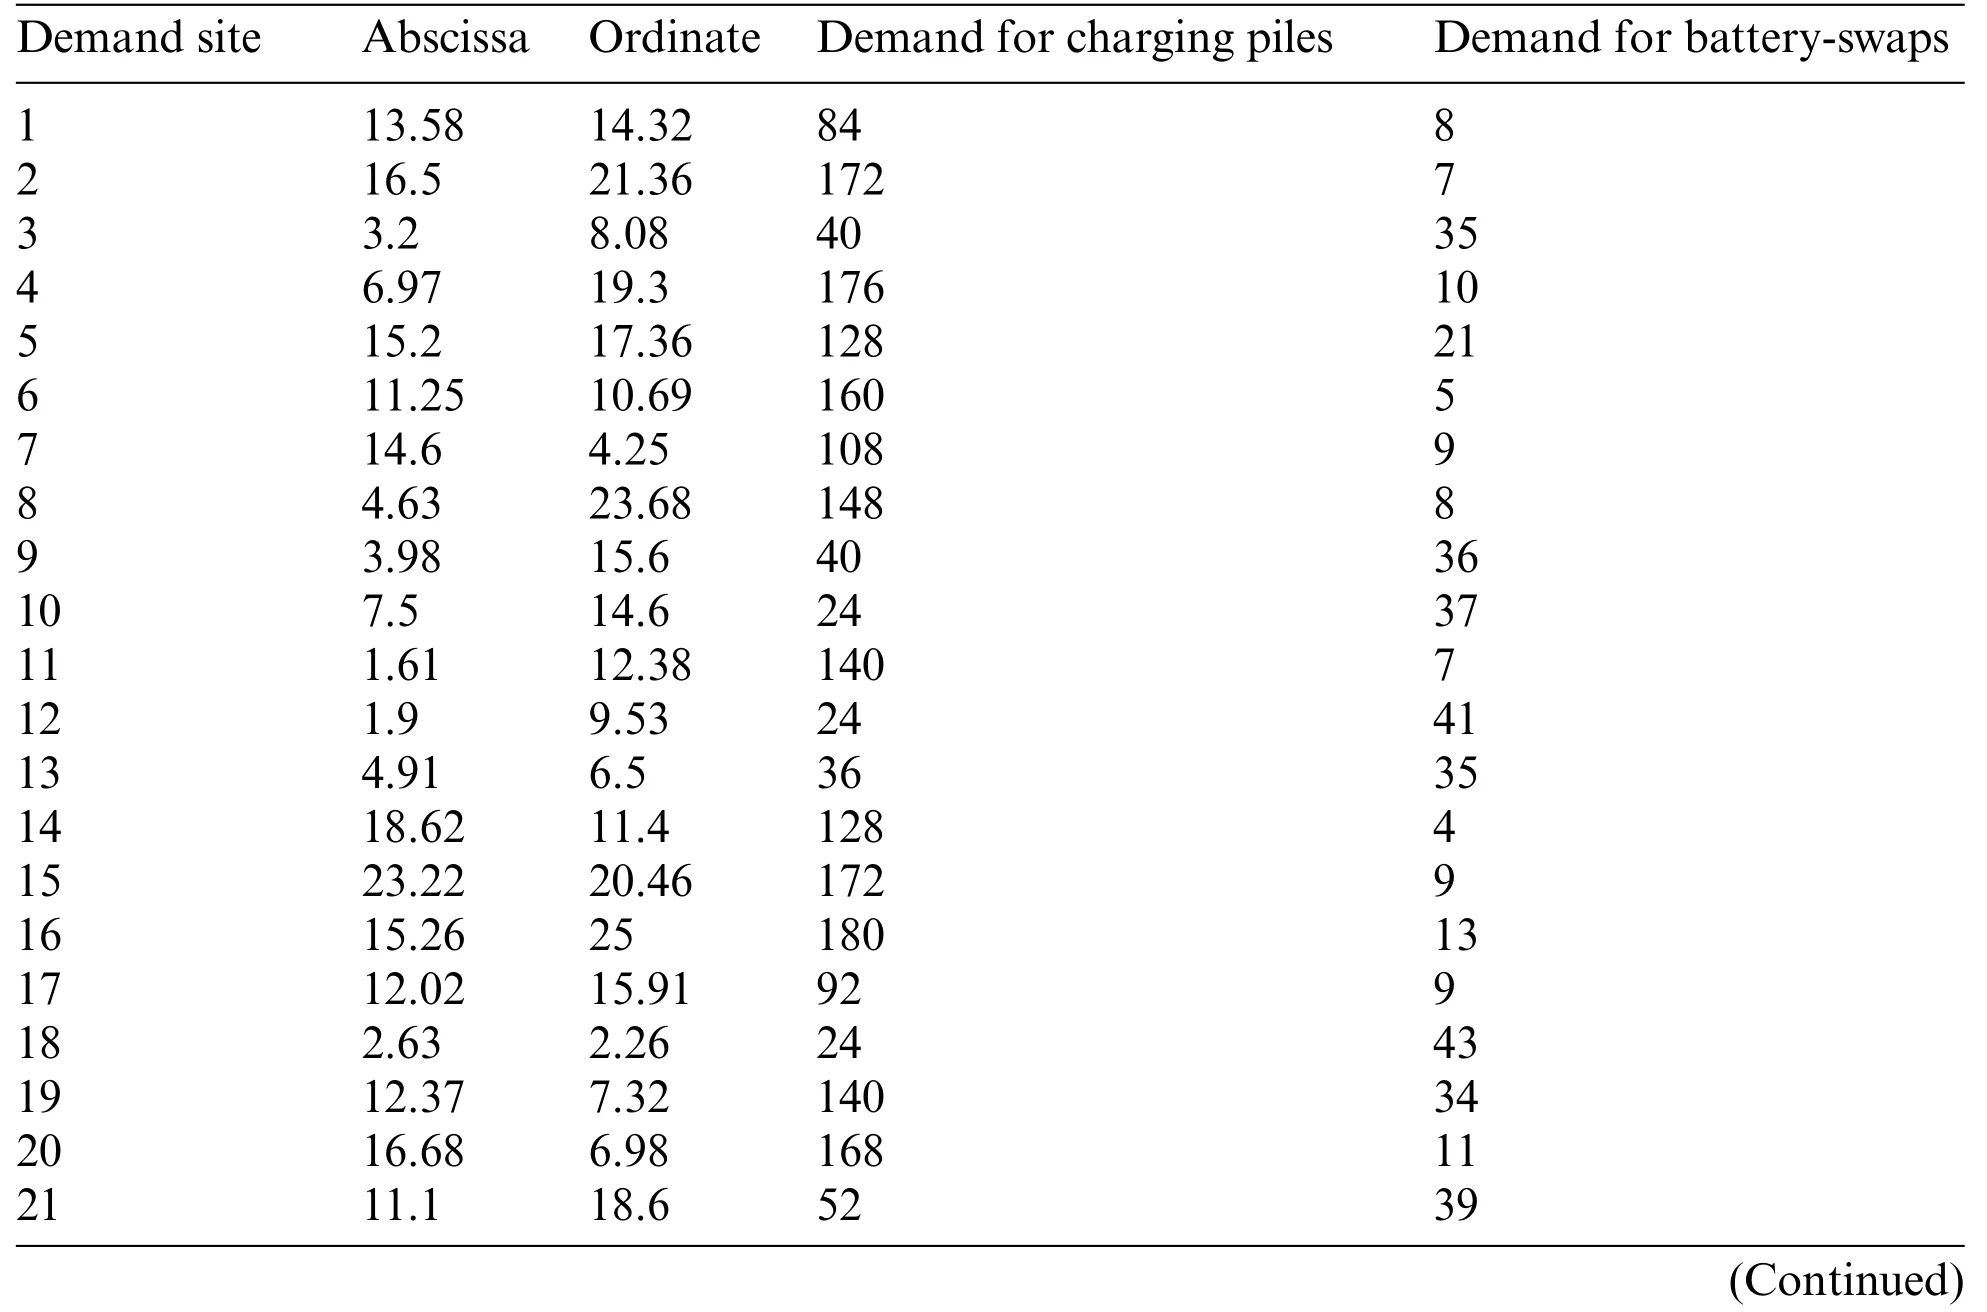
Table 3: Location and demand scale of demand sites
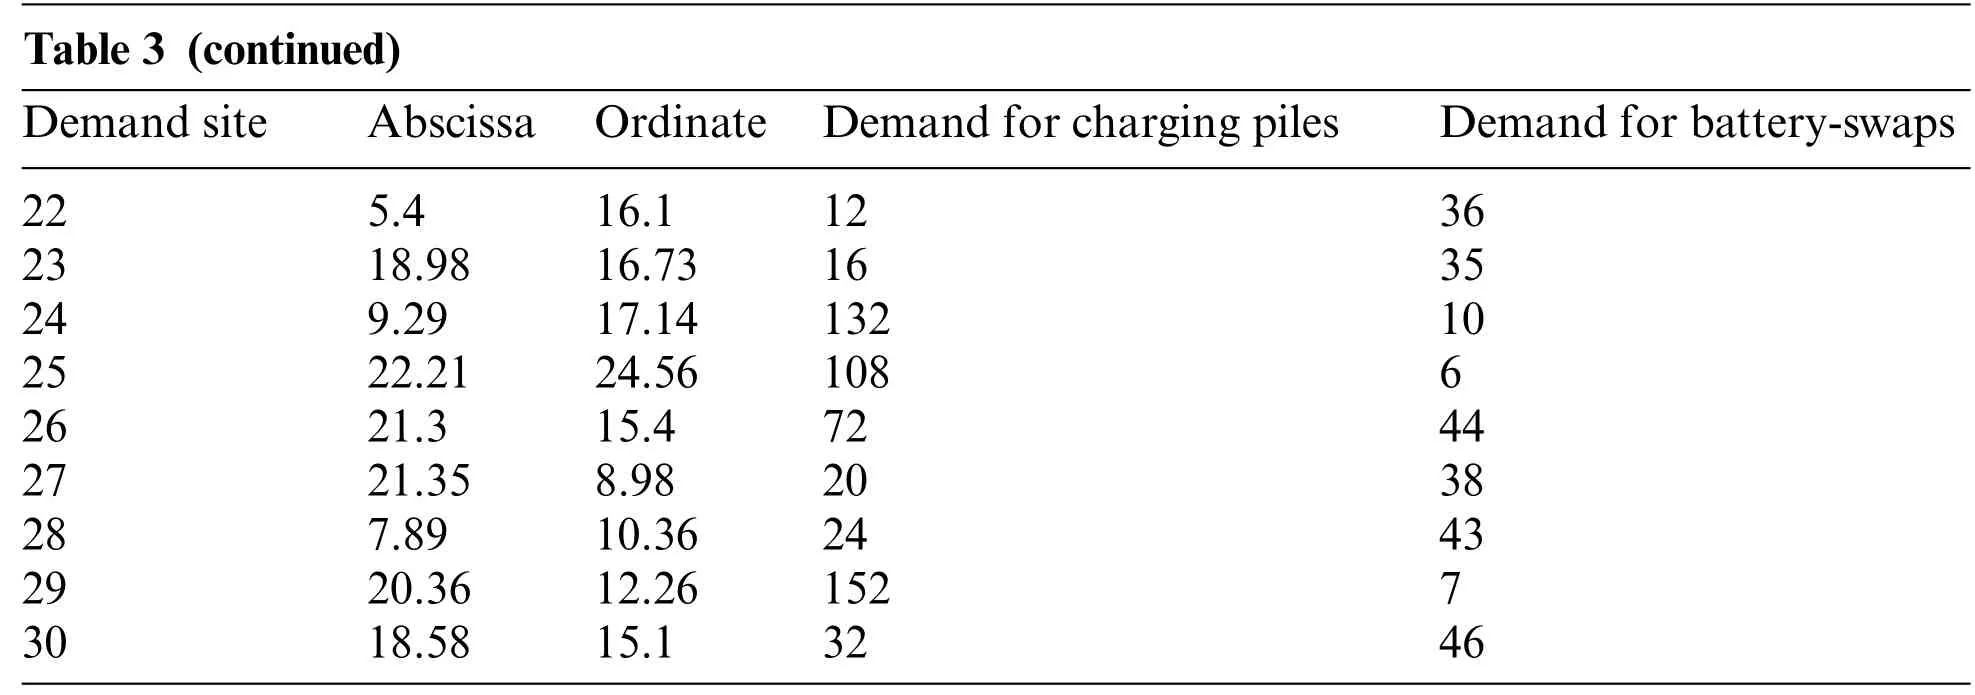
Table 3 (continued)Demand site Abscissa Ordinate Demand for charging piles Demand for battery-swaps 22 5.4 16.1 12 36 23 18.98 16.73 16 35 24 9.29 17.14 132 10 25 22.21 24.56 108 6 26 21.3 15.4 72 44 27 21.35 8.98 20 38 28 7.89 10.36 24 43 29 20.36 12.26 152 7 30 18.58 15.1 32 46
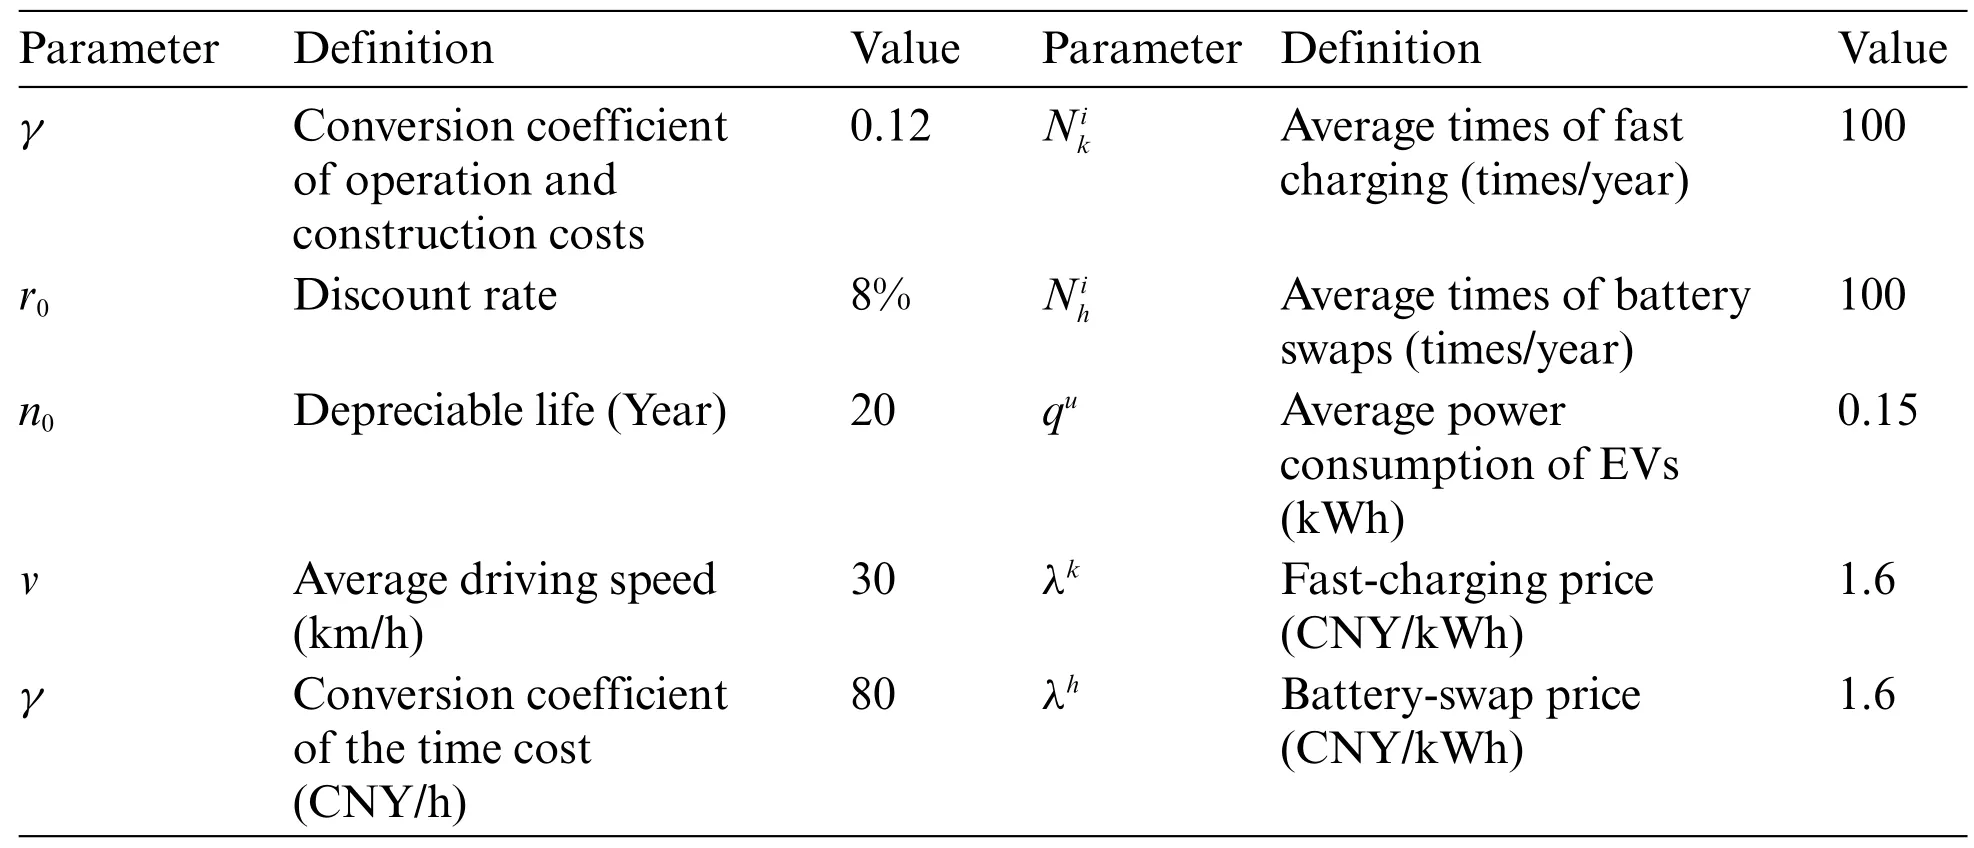
Table 4: Related parameters of the simulation example
The improved GA and MATLAB were used to find the solutions.The algorithm was set as follows:the population was 50,the iteration was 200 times,and in the termination rules,the maximum iteration was 50 times for the current optimal solution to remain unchanged.The simulation was run 20 times,and the results are listed in Table 5.
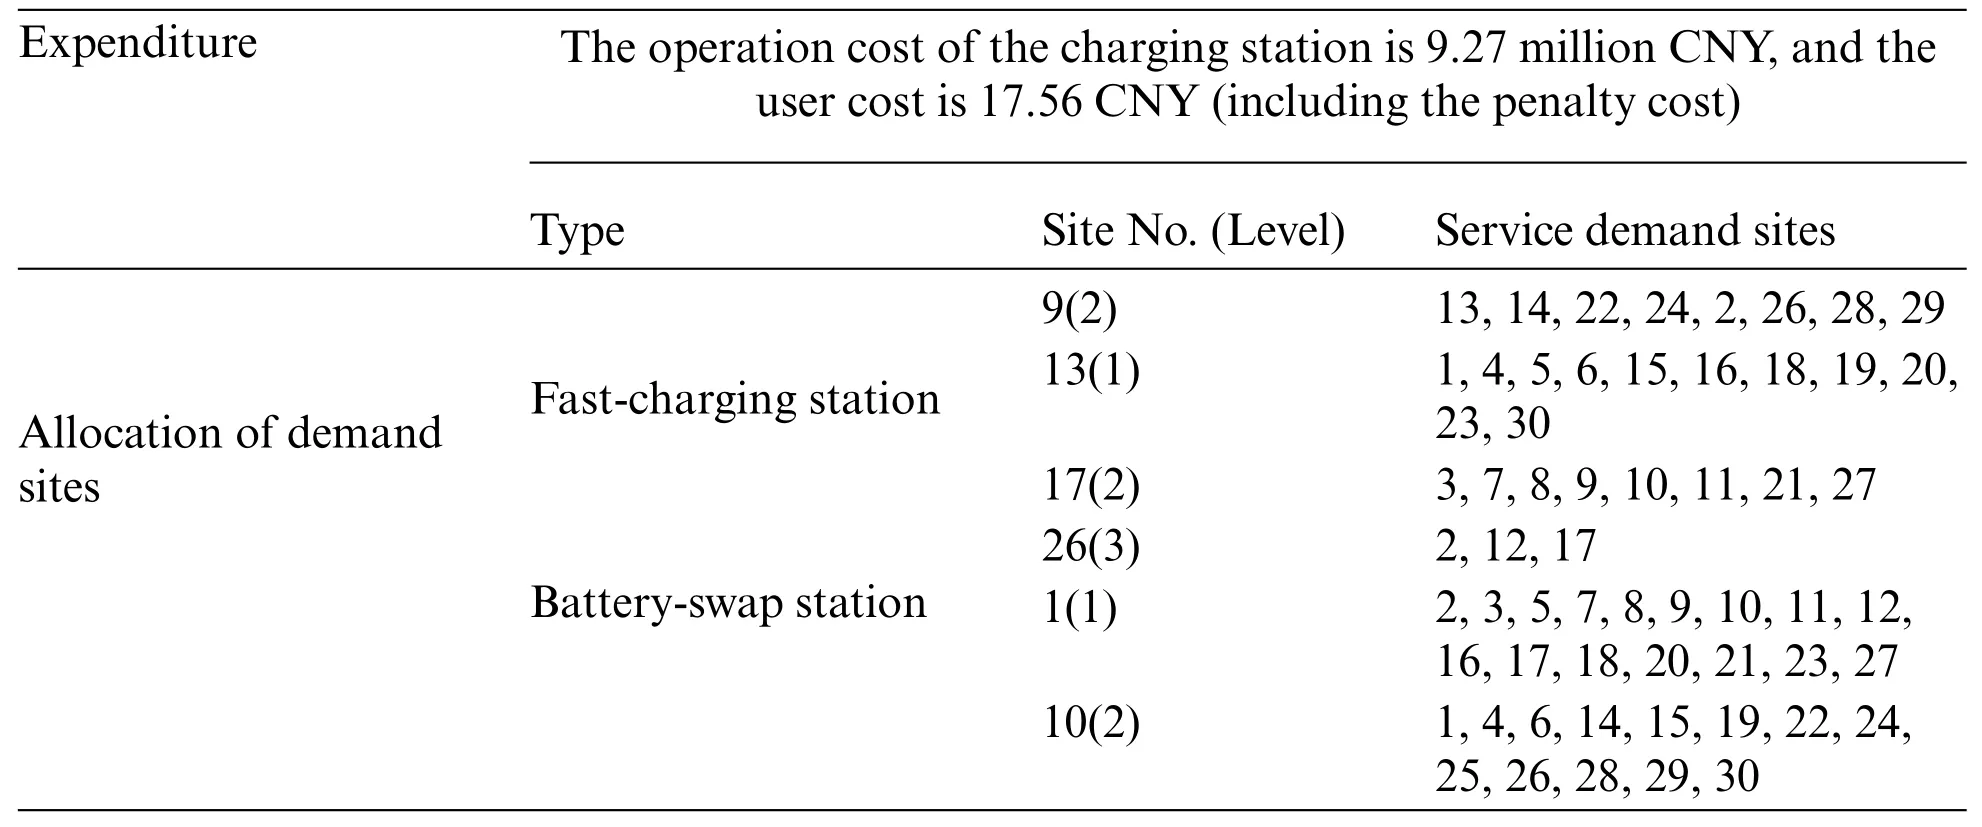
Table 5: Location planning results of charging/battery-swap facilities by the improved GA
4.2 Simulation Results
4.2.1 Modeling Results
For convenient calculation,we assumed that the land prices of all sites remained the same.Table 5 shows the location planning results of the fast-charging stations and battery-swap stations.Sites 9,13,17,and 26 are planned for charging piles,whereas sites 1 and 10 are arranged for battery-swap stations.
Fig.2 shows the construction locations and allocation of demand points.For different locations of the charging facilities,different demand sites are assigned,and the level of the sites of charging facilities vary.In practice,it is unnecessary to build all facilities into high-level facilities; building charging/battery-swap facilities of different levels helps avoid waste of investment,improve efficiency,and maximize customer perception.
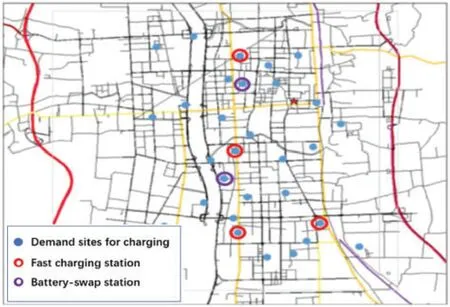
Figure 2:Construction locations and allocation of demand points(basic model)
4.2.2 Planning Results under Varied Construction Costs
For convenient calculation,we assumed that the land prices for all facilities remained the same,but this is not true in reality.With other conditions held the same as in Section 4.2.1,we discuss the location selection of charging/battery-swap facilities under varied land prices,as shown in Table 6.
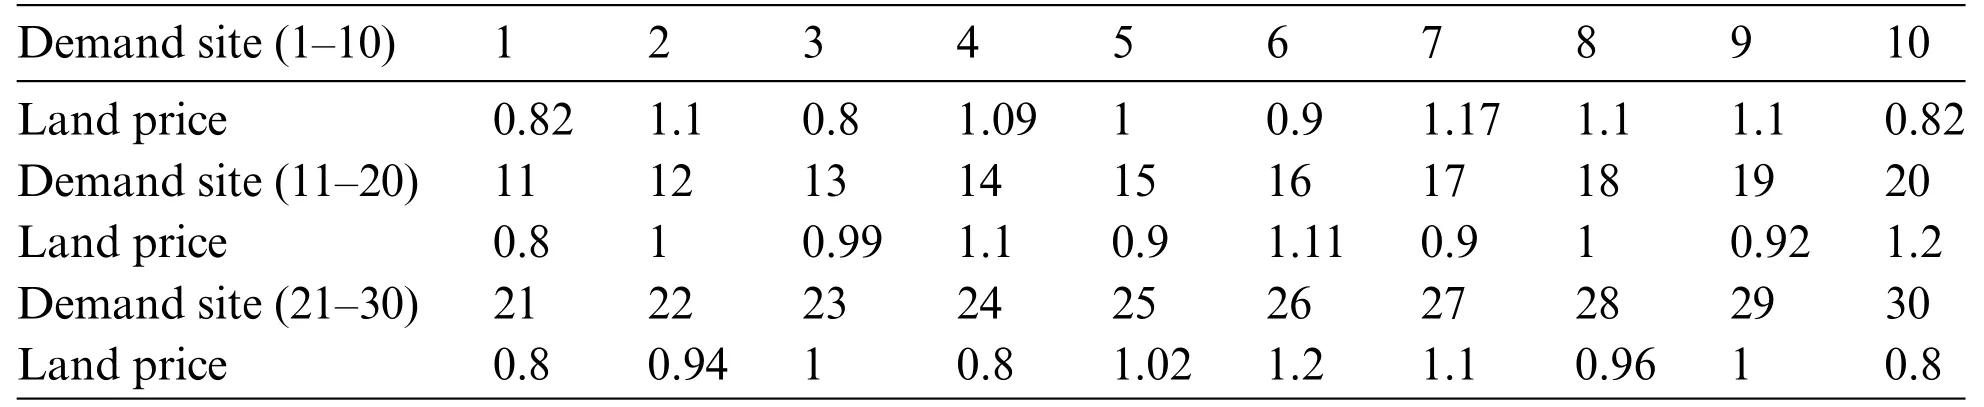
Table 6: Land price of demand sites
As shown in Fig.3,the result differs from that in Section 4.2.1.Sites 9,13,and 17 are still planned for charging piles;however,site 26 is no longer reserved for a charging station,and site 12 is arranged for a new charging station.Charging stations were planned for regions with lower construction costs to reduce the overall value of the objective function.
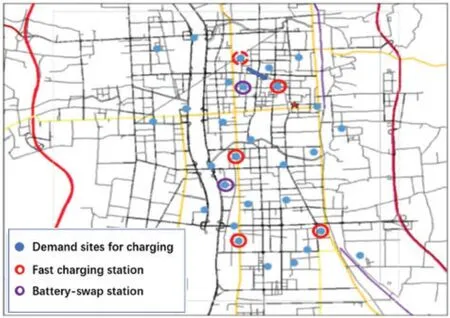
Figure 3:Construction locations and allocation of demand points(under varied construction costs)
4.2.3 Planning Results under Varied Demand Structures
Vehicles that rely on battery swaps for charging comprise a small proportion of all vehicles in the road network.As shown in Table 7,the ratio of fast-charging vehicles to battery-swap vehicles was 4:1.To simulate the increased proportion of battery-swap vehicles,we reduced the number of fast-charging vehicles by 1/4,3/8,and 1/2 for each demand site,and the reduced demand for fast-charging vehicles was due to the increased number of battery-swap vehicles.As the ratio of fast-charging vehicles to battery-swap vehicles varies,the location and level of fast-charging stations and battery-swap stations also differ.When the scale of the fast-charging stations was reduced by 1/4,the location of the fastcharging stations remained constant,but the level of the stations decreased,thus reducing demand.As the demand continued to decrease,the location and scale of fast-charging stations varied.In this case,the level of the fast-charging station and the location of the stations changed to minimize the overall cost.Moreover,the location and scale of the battery-swap stations varied to meet changing demands.
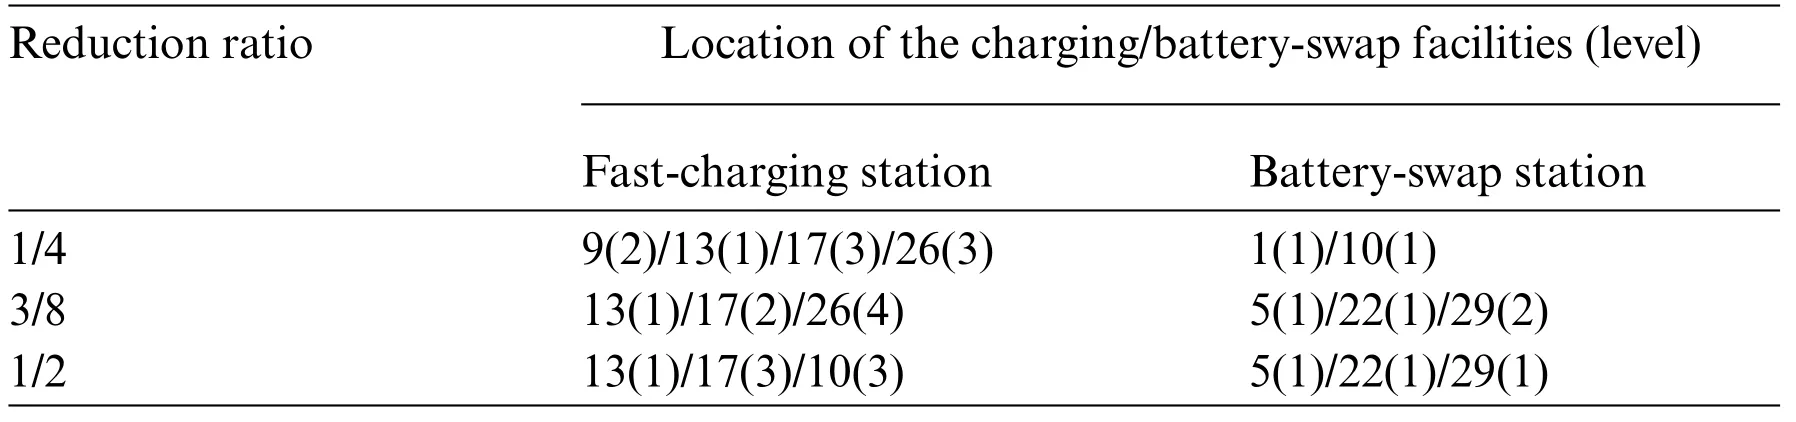
Table 7: Location planning results of charging/battery-swap facilities under varied demands
Because the average construction cost of the battery-swap station is higher than that of the fastcharging station,with an increasing proportion of EVs,the overall construction cost of energy supply stations increases linearly.As shown in Fig.4,when the proportion of battery-swap vehicles is changed to 1/4,3/8,and 1/2,the construction costs of battery-swap stations are 32 million CNY,44 million CNY,and 48 million CNY,and the overall construction costs are 50.3 million CNY,58.2 million CNY,and 61.1 million CNY,respectively.This represents an increase of 18.6%,15.7%and 4.98%,respectively,compared to the original cost.
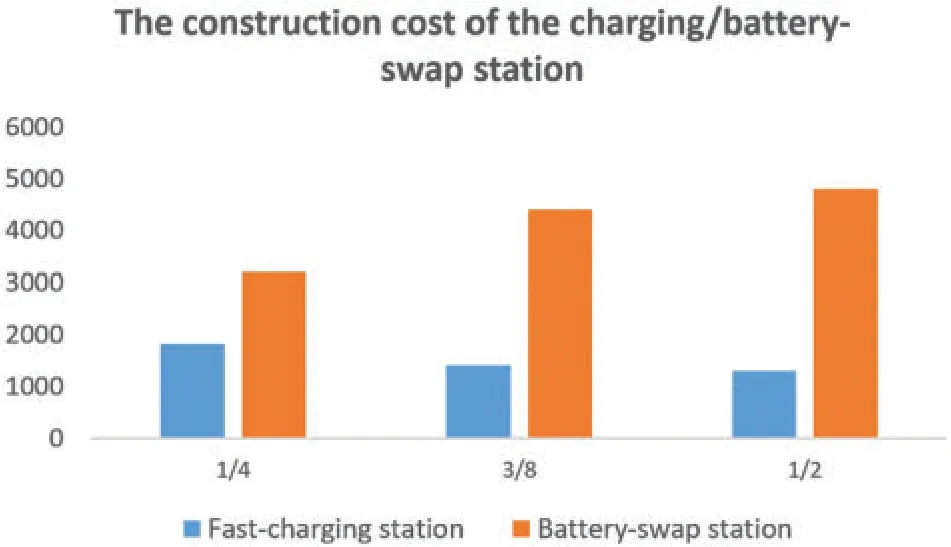
Figure 4:Construction cost of the charging/battery-swap station under different reduction ratios
4.2.4 Comparison between Two Algorithms
In the present work,the conventional GA and improved GA were employed to solve the model,and their performances were compared.The algorithms were run 200 times for 50 iterations,and the changes in the fitness curve were used as the evaluation standard.Both algorithms can achieve the optimal solution,but the effect varies(Table 8).Specifically,the improved GA had a stronger search capacity and a higher search speed than the standard algorithm.The reason for this difference is that after genetic operation,the population diversity in the conventional GA decreased sharply,and under a small mutation probability,the algorithm has a high probability of reaching premature convergence towards the local optimum.However,the improved algorithm is “directional” (evolves towards child generations with a higher fitness value),but retains the selection operation.Consequently,the improved GA outperformed its conventional counterpart.
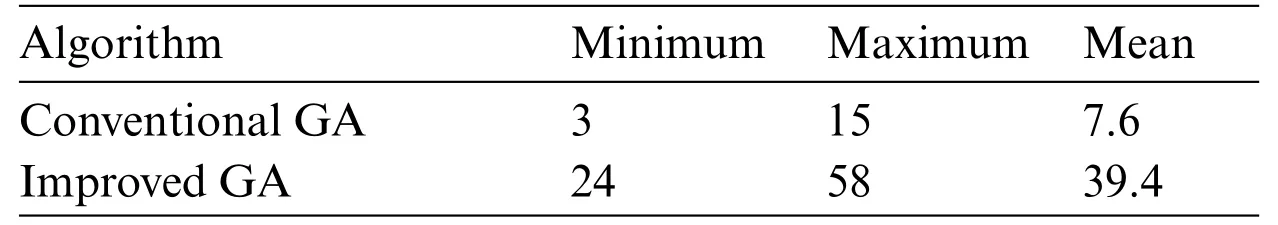
Table 8: Times to reach the optimal solution for the two algorithms
As shown in Fig.5,when the initial parameters were held constant,the fitness function curve of the improved algorithm increased rapidly,with a higher fitness value and a higher rising speed than those of the conventional GA.Moreover,as the number of epochs increased,the fitness values of both algorithms increased until convergence.The improved algorithm converged at the 130thepoch.However,the conventional algorithm did not exhibit a steadily reduced fitness value as the number of epochs increased.Within 200 epochs,the conventional GA converged at the 152ndepoch,but did not converge to the global optimum.The improved GA has better stability and poorer convergence than its conventional counterpart.
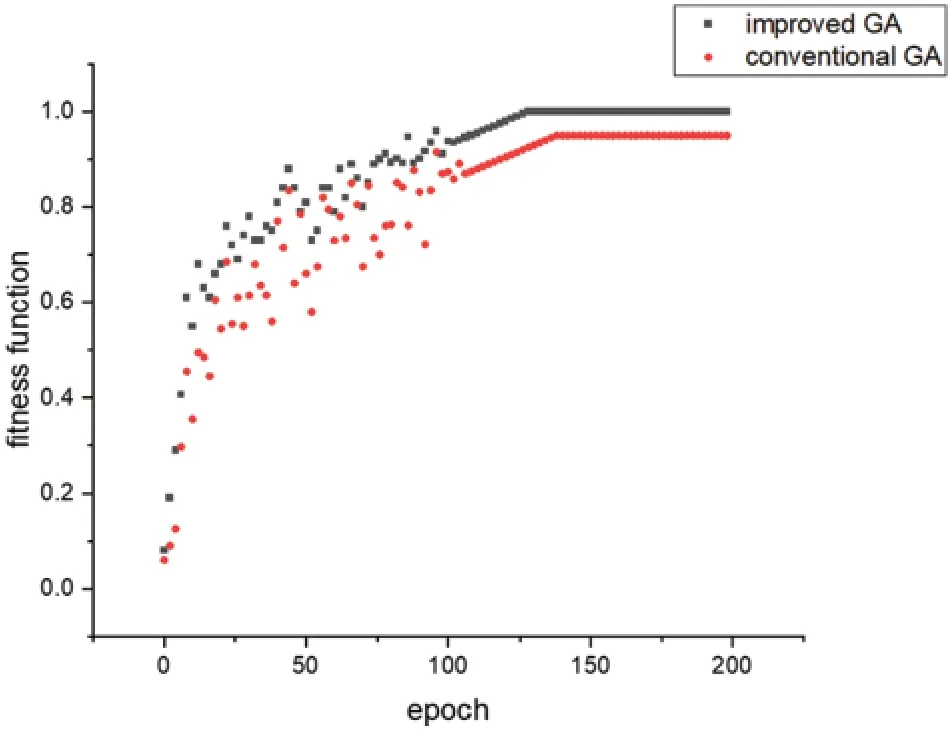
Figure 5:Fitness function curves of the improved GA and conventional GA
5 Conclusions
Meeting the demand for power supply of EVs does not necessarily mean increasing the number of charging/battery-swap stations.Instead,optimizing the level and location planning of these stations can maximize the investment profit.A case simulation revealed that our proposed model for the location selection of multilevel charging/battery-swap stations could provide a basis for decisionmaking.In the location selection of charging/battery-swap facilities,the construction,operation,charging,traveling,and waiting costs,as well as customer satisfaction with the service of the facilities,should be considered.Location selection is a multi-target and nonlinear combination optimization problem subject to different influencing factors.Therefore,the difference between the fast-charging and battery-swap stations was considered.We built a location selection optimization model for charging/battery-swap facilities.To solve this model,we designed an improved GA that can dynamically change the crossover and mutation rates according to the fitness values,memorize,and transfer excellent genes with a large probability.This improved algorithm avoids the problem of premature convergence of conventional GAs,provides a new solution to complex optimization problems,and increases the computing efficiency; hence,it has theoretical significance.A simulated case study confirmed the effectiveness and utilization efficiency of the proposed model and algorithm.The proposed problem and solution can provide a reference for the government and enterprises to better plan the location of charging/battery-swap facilities,having both theoretical and practical value.
Funding Statement:The authors received no specific funding for this study.
Conflicts of Interest:The authors declare that they have no conflicts of interest to report regarding the present study.
 Computer Modeling In Engineering&Sciences2023年2期
- Computer Modeling In Engineering&Sciences的其它文章
- Monitoring Study of Long-Term Land Subsidence during Subway Operation in High-Density Urban Areas Based on DInSAR-GPS-GIS Technology and Numerical Simulation
- Slope Collapse Detection Method Based on Deep Learning Technology
- An Extended Fuzzy-DEMATEL System for Factor Analyses on Social Capital Selection in the Renovation of Old Residential Communities
- Failure Mode and Effects Analysis Based on Z-Numbers and the Graded Mean Integration Representation
- Static Analysis of Anisotropic Doubly-Curved Shell Subjected to Concentrated Loads Employing Higher Order Layer-Wise Theories
- An Effective Machine-Learning Based Feature Extraction/Recognition Model for Fetal Heart Defect Detection from 2D Ultrasonic Imageries