
Inhibiting 5-hydroxytryptamine receptor 3 alleviates pathological changes of a mouse model of Alzheimer’s disease
2023-02-13 12:41LiFenLiuYuTongLiuDanDanWuJieChengNaNaLiYaNiZhengLiangHuangQiongLanYuan
中国神经再生研究(英文版) 2023年9期
Li-Fen Liu , Yu-Tong Liu , Dan-Dan Wu Jie Cheng Na-Na Li Ya-Ni Zheng Liang Huang , Qiong-Lan Yuan ,
Abstract Extracellular amyloid beta (Aβ) plaques are main pathological feature of Alzheimer’s disease. However, the specific type of neurons that produce Aβ peptides in the initial stage of Alzheimer’s disease are unknown. In this study, we found that 5-hydroxytryptamin receptor 3A subunit (HTR3A) was highly expressed in the brain tissue of transgenic amyloid precursor protein and presenilin-1 mice (an Alzheimer’s disease model) and patients with Alzheimer’s disease. To investigate whether HTR3A-positive interneurons are associated with the production of Aβ plaques, we performed double immunostaining and found that HTR3A-positive interneurons were clustered around Aβ plaques in the mouse model. Some amyloid precursor protein-positive or β-site amyloid precursor protein cleaving enzyme-1-positive neurites near Aβ plaques were co-localized with HTR3A interneurons. These results suggest that HTR3A -positive interneurons may partially contribute to the generation of Aβ peptides. We treated 5.0–5.5-month-old model mice with tropisetron, a HTR3 antagonist, for 8 consecutive weeks. We found that the cognitive deficit of mice was partially reversed, Aβ plaques and neuroinflammation were remarkably reduced, the expression of HTR3 was remarkably decreased and the calcineurin/nuclear factor of activated T-cell 4 signaling pathway was inhibited in treated model mice. These findings suggest that HTR3A interneurons partly contribute to generation of Aβ peptide at the initial stage of Alzheimer’s disease and inhibiting HTR3 partly reverses the pathological changes of Alzheimer’s disease.
Key Words: 5-hydroxytryptamin receptor 3; Alzheimer’s disease; amyloid beta plaques; calcineurin; cognitive deficits; HTR3 interneurons; iCa2+; nuclear factor of activated T-cells; transgenic amyloid precursor protein and presenilin-1 mice; tropisetron
Introduction
Alzheimer’s disease (AD) is the most common cause of dementia with a rapidly increasing prevalence and is clinically characterized by progressive cognitive dysfunction. Among the hypotheses of AD pathogenesis, the extracellular amyloid beta (Aβ) plaque cascade hypothesis is predominant (Hardy and Selkoe, 2002; Ju and Tam, 2022; Roda et al., 2022). Aβ plaques are primarily localized in the hippocampus and cortex and composed of extracellular Aβ deposits and dystrophic neurites (Fiala, 2007). Aβ accumulation is considered to play a central role in AD pathogenesis by causing synaptic damage, neuritic alteration, glial activation and loss of neurons and synapses. However, the subtype of neurons that produces excessive Aβ peptides in the initial stages of AD is unknown (Fiala, 2007). As one of main brain areas occupied by Aβ plaques, the hippocampus exhibits distinctive cell architecture which GABAergic interneurons mainly reside in the stratum oriens, stratum radium and lacunosum molecular layer of the hippocampus, and molecular layer of dentate gyrus, while principal neurons reside in the pyramidal layer and granular layer. In various animal AD models, early Aβ plaques in the hippocampus are exclusively present in areas occupied by interneurons (Krauthausen et al., 2015; Liu et al., 2020). However, whether interneurons play a role in plaque development in AD has not been determined.Hippocampal GABAergic interneurons give rise to various subpopulations and are subclassified by their morphology and neuropeptide expression. Approximately 50% of hippocampal interneurons express 5-hydroxytryptamine receptor 3 (HTR3) (Morales and Bloom, 1997; Turner et al., 2004), one of the receptors for 5-hydroxytryptamine (5-HT), which has been implicated in cognitive function and cognitive disorders (Švob Štrac et al., 2016). Seven receptor families for 5-HT (HTR1 to HTR7) have been identified so far. HTR3 is unique among these receptors, as it belongs to the superfamily of ligandgated ionotropic receptors and is Ca2+, K+, and Na+permeable. HTR3 is a homopentamer or heteropentamer and composed of five subunits including HTR3A, HTR3B, HTR3C, HTR3D and HTR3E (Maricq et al., 1991; Davies et al., 1999; Niesler et al., 2003). The HTR3A subunit is capable of forming functional HTR3 (Maricq et al., 1991). The HTR3B subunit is required to be co-assembled with the HTR3A subunit to form a heteromeric HTR3A/B receptor (Davies et al., 1999). However, central expression of the HTR3B subunit is controversial in rodents because HTR3B subunit transcripts appear absent (Jensen et al., 2008). Moreover, central expressions of HTR3-like genes (HTR3C, HTR3D and HTR3E) in humans remain to be identified (Holbrook et al., 2009). Therefore, HTR3A is required for functional HTR3 and in both rodents and humans (Krzywkowski et al., 2007). 5-HTergic neurons in the raphe nuclei densely project into cortex and hippocampus, the main areas that are occupied by Aβ plaques in AD. Dysfunction of the 5-HTergic system has been implicated in the behavioral symptoms of AD (Švob Štrac et al., 2016). Several studies showed a reduced number of 5-HTergic neurons, lessened 5-HTergic transmission and a decrease in 5-HT concentration in AD patients (Aletrino et al., 1992; Tohgi et al., 1992), suggesting extensive serotonergic denervation in AD (Cirrito et al., 2011). Thus, serotonergic therapy was considered as a potential treatment strategy for AD. Another study showed that both selective serotonin reuptake inhibitor administration and intracerebroventricular injections of the neurotoxin 5,7-dihydroxytryptamine to remove 5-HTergic afferents had no effect on levels of insoluble Aβ42in the cortex and hippocampus of the transgenic amyloid precursor protein and presenilin-1 (APP/PS1) mouse model of AD in prodromal and early stage (von Linstow et al., 2017). These findings suggest that 5-HTergic neuronal terminals may not be associated with Aβ generation in the early stage. However, whether HTR3A interneurons innervated by 5-HTergic terminals are related to Aβ pathology in AD is unknown.
HTR3A interneurons are abundant in the hippocampus and cortex relative to other forebrain regions in rodents and humans (Barnes et al., 1990; Tecott et al., 1993; Morales et al., 1996; Koyama et al., 2017), mainly locating in the stratum radium and lacunosum molecular layer of hippocampus and molecular layer of dentate gyrus (Tecott et al., 1993; Morales et al., 1996), where Aβ plaques are initially present in the early stage of AD. However, whether HTR3A interneurons are altered and this alteration is associated with Aβ pathology in the early stage of AD is unknown.
In this study, we investigated whether HTR3A expression is altered in the cortex and hippocampus of a transgenic APP/PS1 mouse AD model and AD patients and determined whether HTR3A interneurons are associated with Aβ plaques.
Methods
Animals
Double transgenic APPSWE and PS1ΔE9 (Tg APP/PS1) mice (Stock No. NMX-TG-192043, RRID: MMRRC_034829-JAX) were obtained from the Animal Model Research Center of Nanjing University (Nanjing, China) and subsequently bred in Tongji University experimental animal center (license No. SYXK (Hu) 2009-0022). Tg APP/PS1 (Tg AD) mice were maintained by heterozygous crosses with C57BL/6J mice and were heterozygous with respect to the transgene. Non-transgenic littermates (C57BL/6J mice) were used as controls (wild-type, WT mice). Mice (n= 51, both sex) were bred and maintained in 22 ± 1°C, 40–60% humidity and a 12-hour light/dark cycle, with ad libitum access to food and water. There were 3–4 mice in each cage. All procedures were approved by the Animal Care Committee at Tongji University School of Medicine (approval No. 2010-TJAA08220401) in 2010 and performed in line with Directive 2010/63/EU and NIH guidelines. All efforts were made to minimize the pain and suffering of animals.
Human brain samples
Human brain tissues were from the NeuroBioBank of Central South University, which receives willed body donations with consent. This program is supported by the Municipal Police Department and office of the Red Cross Society of China and provides cadavers for medical students to learn human anatomy. A subgroup of older adults cases was recorded as dementia and regarded as AD patients; the brain samples were confirmed using specific 6E10 antibody against Aβ plaques and phosphorylated-microtubule-associated protein tau (P-Tau) antibody against phosphorylated tau (a component of neurofibrillary tangles). Brain samples with Aβ plaques and neurofibrillary tangles were regarded as AD cases (Nelson et al., 2009). Age-matched cases of older adult patients who did not die of neurological diseases, including cancer and cardiovascular diseases, were included as controls (Additional Table 1,n= 3/group). The use of postmortem human brains was approved by the Ethics Committee for Research and Education at Xiangya School of Medicine in 2020 (approval No. 2020KT-37), in compliance with the Code of Ethics of the World Medical Association (Declaration of Helsinki).
Chronic tropisetron treatment
Tropisetron (Selleck, Houston, TX, USA), a commonly used HTR3 antagonist, was freshly diluted in sterile normal saline at a concentration of 50 µg/mL. Tg AD mice (5.0–5.5-month-old) were randomly divided into two groups: the tropisetron-treated Tg AD (n= 11) and NS-treated Tg AD groups (n= 8). For the tropisetron-treated Tg AD mice, animals were intraperitoneally injected with tropisetron at a dose of 0.5 mg/kg/day for 8 consecutive weeks; this administration was chosen following a previous report that showed it is effective and safe for mice (Spilman et al., 2014). As control groups, agematched Tg AD and WT mice received injections of normal saline (NS, NStreated Tg AD or NS-treated WT mice,n= 8/group).
Behavioral experiments
At 6 weeks after treatment, behavioral tests were administered, including the novel object recognition test and Morris water maze test. The novel object recognition test was performed in a box (40 cm × 27 cm × 19 cm, ORT-200A, Techman, Chengdu, China) for three consecutive days, as described in our previous report (Li et al., 2019). On day 1, each mouse was allowed to freely explore the box without objects for 5 minutes. On day 2, two identical objects were placed in the box, and each mouse was allowed to explore the objects for 10 minutes. On day 3, one of two identical objects was replaced by a novel object in the box, and each mouse was allowed to explore the objects for 10 minutes. A video camera was used to record exploration of the familiar or novel object when a mouse displayed any investigative behaviors (head toward object, sniffing closely or entering an area within 2 cm around the object). The time exploring the novel and familiar objects was calculated.
Three days later after the novel object recognition test, the Morris water maze test was performed (WMT-200A, Techman) as reported previously (Li et al., 2019). During the learning test, each mouse was placed at one of four quadrants and allowed 60 seconds to find the hidden platform (submerged 1 cm beneath the surface in the target) and remain there for 15 seconds for six consecutive days (four trials per day). On day 7, the hidden platform was removed, and the mouse was allowed to swim for 60 seconds in search of the platform. On day 8, mouse was allowed to swim in the pool with a visible platform, and swimming speed was measured. A digital tracking device (ANYmaze program, Stoelting, Madison, WI, USA) was used to measure movement.
Brain tissue preparation
Postmortem AD brain samples (n= 3) and AD-control brain samples (n= 3) were bisected and cut into approximately 2 cm-thick temporal slices. One side of brain slices was prepared for section staining; the samples were fixed in formalin for at least 1 week, placed in 30% sucrose in 0.01 M phosphate buffer and cut into sections (15 or 20 µm thick) by a cryostat (CM 1950, Leica, Heidelberg, Germany). Another side was stored at –70°C until use for immunoblot analysis.
For mouse brain section staining, mice (including the mice after behavioral test, and 7- and 10-month-old Tg AD and WT mice,n=3/group) were intraperitoneally euthanized by 1% pentobarbital sodium (Sigma-Aldrich, St. Louis, MO, USA); the animals were perfused with 0.01 M phosphate-buffered saline (PBS, pH 7.4) and then 4% paraformaldehyde. Brains were post-fixed in 4% paraformaldehyde for 16–20 hours at 4°C and placed in 20% sucrose at 4°C. Brain coronal sections (10 or 15 µm thick) were cut and used for staining.
For western blot analysis, mice (including mice after behavioral test, and 3- and 10-month-old Tg AD and WT mice,n= 3 or 4/group) were placed under deep anesthesia by 1% pentobarbital sodium. The bilateral cortex and hippocampus were immediately removed, rapidly frozen in liquid nitrogen and stored at –80°C until homogenization.
Thioflavin S staining and immunostaining
Thioflavin S staining was used to label Aβ plaques following the manufacturer’s protocols (Sigma-Aldrich). Briefly, brain sections were stained with 0.5% thioflavin S (dissolved in 50% ethanol) in the dark for 8 minutes and washed with 50% ethanol for 5 minutes twice, followed by washing in double distilled water three times. The slices were then mounted for imaging or processed for further co-staining with HTR3A antibody.
For immunofluorescence labeling, sections were permeabilized with 0.3% Triton X-100 for 10 minutes at room temperature (24–27°C) and then blocked with 5% bovine serum albumin at room temperature for 60 minutes. Sections were incubated with the following primary antibodies overnight at 4°C: mouse anti-beta amyloid 1-16 (6E10, 1:500, Santa Cruz Biotechnology, Dallas, TX, USA, Cat# sc81520, RRID: AB_1129415), rabbit anti-glial fibrillary acidic protein (GFAP, 1:500, Abcam, Cambridge, UK, Cat# ab7260, RRID: AB_305808) and rabbit anti-ionized calcium binding adapter molecule 1 (IBA-1, 1:600, Wako, Osaka, Japan, Cat# 01626721, RRID: AB_2811160). Samples were then incubated for 2 hours with secondary antibodies (fluorescein isothiocyanate (FITC)-conjugated goat anti-rabbit IgG, 1:1000, Jackson ImmunoResearch Laboratories, West Grove, PA, USA, Cat# 111545003, RRID: AB_2338046; FITC-conjugated goat anti-mouse IgG, 1:1000, Jackson ImmunoResearch Laboratories, Cat# 115545008, RRID: AB_2338842; Cy3-conjugated goat anti-rabbit IgG, 1:1000, Jackson ImmunoResearch Laboratories, Cat# 111165003, RRID: AB_2338000), followed by staining with diamidino-phenyl-indole (DAPI, Beyotime, Shanghai, China) and covering with Permount Mounting Medium (Beyotime).
For staining of primary antibodies rabbit anti-cluster of differentiation 68 (CD68, 1:200, Abcam, Cat# ab125212, RRID: AB_10975465), mouse antiinduced nitric oxide synthase (iNOS, 1:50, Santa Cruz Biotechnology, Cat# sc7271, RRID: AB_627810), mouse anti-nuclear factor of activated T-cells-4 (NFATc4, 1:50, Santa Cruz Biotechnology, Cat# sc271597, RRID: AB_10714946) and mouse anti-HTR3A (1:50, Santa Cruz Biotechnology, Cat# sc390168), sections were treated with citrate sodium buffer (pH 6.0) in a water bath for 5 minutes at 95°C to expose the antigen. After washing, sections were incubated with the primary antibodies at 4°C overnight and then incubated for 3 hours with biotinylated horse anti-mouse IgG (1:500, Beyotime, Cat# A0453, RRID: AB_2757199) or horse anti-rabbit IgG (1:500, Beyotime, Cat# A0460, RRID: AB_2757201) at room temperature. Finally, sections were incubated for 1 hour with Cy3-conjugated streptavidin (1:1000, Jackson ImmunoResearch Laboratories, Cat# 016160084, RRID: AB_2337244), counterstained with DAPI and mounted.
For double immunostaining, after blocking with 5% bovine serum albumin (Beyotime), sections were simultaneously incubated with mouse anti-HTR3A (1:50, Santa Cruz Biotechnology, Cat# sc390168) and rabbit anti-amyloid protein precursor (APP, 1:200, Abcam, Cat# ab32136, RRID: AB_2289606) or anti-β-site APP cleaving enzyme 1 (BACE1, 1:200, Santa Cruz Biotechnology, Cat# sc10748, RRID: AB_2061505) (HTR3A/APP, HTR3A/BACE1) or mouse anti-6E10 and rabbit anti-APP or rabbit-BACE1 (6E10/APP, 6E10/BACE1) at 4°C overnight. For double staining of 6E10/APP and 6E10/BACE1, the sections were then incubated Cy3-conjugated goat anti-rabbit IgG and FITC conjugated goat anti-mouse IgG (both 1:1000, Jackson ImmunoResearch Laboratories).For double staining of HTR3A/APP, HTR3A/BACE1, sections were incubated for 2 hours with biotinylated goat anti-mouse IgG (1:500, Vector Laboratories, Newark, CA, USA, Cat# A0428, RRID: AB_2893435), followed with Cy3-conjugated streptavidin (1:1000, Jackson ImmunoResearch Laboratories, Cat# 016160084, RRID: AB_2337244) and FITC-conjugated goat anti-rabbit IgG (1:1000, Jackson ImmunoResearch Laboratories) for 1 hour. The sections were mounted with Permount Mounting Medium.
For immunohistochemistry, human brain sections were rinsed with PBS and pretreated with 3% H2O2in PBS for 30 minutes and 5% horse serum in PBS with 0.3% Triton X-100 for 1 hour, followed by incubation with the primary antibodies 6E10, rabbit-anti P-Tau (1:1000, Abcam, Cat# ab32057, RRID: AB_778254) and HTR3A (1:50) at 4°C overnight. Samples were then incubated for 1 hour with biotinylated goat anti-mouse IgG (1:200, Vector Laboratories, Cat# A0521, RRID: AB_2757240) and horseradish peroxidase-conjugated goat anti-mouse IgG (1:200; Vector Laboratories, Cat# A0208, RRID: AB_2892644) for 1 hour. Immunoreactivity was visualized in 0.03% H2O2and 0.05% 3,3′-diaminobenzidine. All images were acquired using a Nikon confocal microscope (Nikon, Melville, NY, USA).
Detection of intracellular Ca2+
Basal intracellular Ca2+(iCa2+) imaging was detected using Fura-2 kits (Shanghai Haling Biotechnology, Shanghai, China) following the manufacturer’s protocols and as previously described (Doolen et al., 2012; Waldeck-Weiermair et al., 2015). In brief, brain sections were mounted on slides and a cleansing solution of Reagent A was added to cover brain section for 2 minutes; next, freshly mixed staining solution (composed of Reagent A, B and C in the kit) was added at 37°C for 90 minutes in the dark. The sections were washed with Reagent A, followed by incubation with Reagent A at 37°C for 30 minutes. Finally, the sections were dried and covered by Permount Mounting Medium. Using a fluorescence microscope (Olympus, Tokyo, Japan), basal Ca2+images of Fura-2 were excited at 405 nm; emitted light was captured at 460 nm and acquired with emission filters ET460/50m (DAPI filter, Olympus). Data acquisition was done using ImageJ software (National Institutes of Health, Bethesda, MD, USA).
iCa2+/HTR3A and thioflavin S/HTR3A double staining
After iCa2+image or thioflavin S staining was performed, the sections were incubated with HTR3A antibody (1:50) at 4°C overnight and then biotinylated goat anti-mouse IgG, followed with Cy3-conjugated streptavidin (1:200, Jackson ImmunoResearch Laboratories, Cat# 16160084, RRID: AB_2337244), as described above.
Quantification of immunostaining
Three or four slides with six intervals were selected for each mouse. All images were captured and analyzed blindly using coded mice.
For 6E10 and thioflavin S staining, the images were recorded from bilateral entire hippocampus and cortex under a 40× magnification in each section. For HTR3A, iNOS, GFAP, CD68 and IBA-1 immunostaining, a total of 12 images from bilateral cerebral cortex or 6 images from the bilateral hippocampus in each section were recorded under a 200× magnification. For NFATc4 immunostaining, a total of six images from the bilateral hippocampus in each section were recorded under 400× magnification. The positive stained area was determined by outlining the boundaries of all positive areas on each section and obtaining the summed area using ImageJ software V1.8.0. The staining positive area was then divided by the area of the section to determine percent positive staining per section, and the average percent positive staining was calculated. The number of positively stained cells was determined by manually counting the number of positive cells in each section, and the average number of the staining positive cells per field was then calculated. For double staining of thioflavin S/HTR3A, HTR3A/APP, HTR3A/BACE1, 6E10/APP and 6E10/BACE1, colocalization was observed in three slides in each mouse under 400× magnification in three independent experiments.
For analysis of iCa2+/HTR3A double-staining, a total of six images from the hippocampus and six images from the cortex were recorded in each section under 400× magnification. The average number of double-stained cells was counted manually in each field using ImageJ software.
Western blotting
Protein was extracted from postmortem human brains (the middle temporal gyrus and hippocampus) and mouse cerebral cortex and hippocampus using radio immunoprecipitation assay lysis buffer (Beyotime). Protein samples (20 µg/sample) were separated on 10% sodium dodecyl sulfate-polyacrylamide gels and transferred to nitrocellulose membranes. The membranes were incubated overnight at 4°C with primary antibodies: rabbit anti-APP (1:1000), mouse anti-IBA-1 (1:500), rabbit anti-GFAP (1:1000), mouse anti-HTR3A (1:500), mouse anti-6E10 (1:500), mouse anti-NFATc4 (1:300), mouse anti-interleukin 1β (IL-1β, 1:500, Santa Cruz Biotechnology, Cat# sc52012, RRID: AB_629741), mouse anti-tumor necrosis factor-α (TNF-α, 1:500, Santa Cruz Biotechnology, Cat# sc52746, RRID: AB_630341), rabbit anti-BACE1 (1:500), mouse antisoluble amyloid precursor protein alpha peptide (sAPPα; 1:1000, Santa Cruz Biotechnology, Cat# sc11088, RRID: AB_669198), mouse anti-soluble amyloid precursor protein beta (sAPPβ; 1:500, Santa Cruz Biotechnology, Cat# sc10321, RRID: AB_2061505), rabbit anti-metabotropic glutamate receptor 6 (mGluR6, 1:1000, Santa Cruz Biotechnology, Cat# sc517076), mouse anti-phosphorylated inhibitor of nuclear factor kappa B (P-IκB, 1:500, Santa Cruz Biotechnology, Cat# sc8404, RRID: AB_627773) and mouse anti-inhibitor of nuclear factor kappa B (IκB, 1:500, Santa Cruz Biotechnology, Cat# sc71291, RRID: AB_1123808), mouse anti-phosphorylated-protein kinase C alpha (p-PKCα, 1:500, Santa Cruz Biotechnology, Cat# sc377565, RRID: AB_2877652), mouse anti-calcineurin subunit Aα (CaN-Aα, 1:500, Santa Cruz Biotechnology, Cat# sc17808, RRID: AB_628179), mouse anti-calcineurin subunit Aβ (CaN-Aβ, 1:500, Santa Cruz Biotechnology, Cat# sc65612, RRID: AB_831756), mouse anti-cleaved CaNAα subunit (cCaN-Aα, 1:500, Abcam, Cat# ab282104), anti-cleaved CaN-Aβ subunit (cCaN-Aβ, 1:1000, Santa Cruz Biotechnology, Cat# sc-365612, RRID: AB_10841722), mouse anti-Calbindin (1:500, Sigma, St. Louis, MO, USA, Cat# c9848, RRID: AB_476894), goat anti-post-synaptic marker postsynaptic density-95 (PSD-95; 1:1000, Abcam, Cat# ab12093, RRID: AB_298846), rabbit anti-synaptophysin (SYN, 1:500, Abcam, Cat# ab14692, RRID: AB_301417), rabbit anti-NeuN (1:500, Abcam, Cat# ab177487, RRID: AB_2532109), and mouse anti-glyceraldehyde-3-phosphate dehydrogenase (GAPDH, 1:1000, Beyotime, Cat# AF006, RRID: AB_2756478) or β-actin (1:1000, Beyotime, Cat# AF003 RRID: AB_2893353). Membranes were then incubated with horseradish peroxidase-conjugated goat anti-rabbit IgG (1:1000, Beyotime, Cat# A0208, RRID: AB_2892644), donkey anti-goat IgG (1:1000, Beyotime, Cat# A0181) or goat anti-mouse IgG (1:1000, Beyotime, Cat# A0216, RRID: AB_2860575) for 2 hours. Bands were visualized using ImageJ software. Protein levels were normalized to GAPDH or β-actin. Data were obtained from three independent experiments.
Statistical analysis
Data are expressed as means ± standard error of mean (SEM). All statistical analyses were performed using SPSS Statistics software v22 (IBM, Armonk, NY, USA). An unpaired Student’st-test was used to evaluate the difference between two groups. Multiple comparisons were performed using oneway analysis of variance followed by the least significant difference test or repeated measures one-way analysis of variance followed by Fisher’s least significant difference test. Statistical significance was set atP< 0.05.
Results
HTR3A expression levels are increased in the brains of Tg AD mice and postmortem AD patients
To evaluate whether HTR3A is involved in AD pathology, we first examined HTR3A expression in Tg AD mice. Western blot analysis displayed that HTR3A levels were significantly increased in both the cortex and hippocampus in 3-month-old Tg AD mice (before the appearance of Aβ plaques (Krauthausen et al., 2015; Liu et al., 2020)) and 10-month-old Tg AD mice compared with age-matched WT mice (Figure 1A–C).
Immunofluorescence staining was used to examine the morphological features of HTR3A-positive cells. In 7-month-old WT mice (when Aβ plaques appeared in AD mice), HTR3A immunoreactivity was faint and punctate with a scattered pattern throughout the II–V layer of the cerebral cortex, stratum radium, stratum lacunosum-moleculare of the hippocampus, and molecular layer of the dentate gyrus; intact HTR3A-positive interneurons were not observed (Figure 1D). In age-matched Tg AD mice, HTR3A staining was remarkably intense and intact morphology of HTR3A-positive interneurons was observed, with thickened and shortened processes in hippocampus and cortex; some HTR3A interneurons were clustered (Figure 1D). Immunohistochemical staining also showed that HTR3A-positive interneurons were clustered with thickened and shortened processes in 10-month-old Tg AD mice while HTR3A immunoreactivity was weak in age-matched WT mice (Figure 1E).
We also evaluated levels of HTR3A protein in postmortem AD patient brains. As shown in Additional Figure 1, histochemical staining revealed many Aβ plaques with different sizes in the cortex and abundant neurofibrillary tangles in AD patient brains but not in controls. Remarkable Aβ immunobands were observed in the temporal cortex of AD patient brains but not in controls (Additional Figure 1). We examined the expression of HTR3A in AD patient brains and found that HTR3A expression levels were significantly increased in the temporal cortex of AD patients compared with that in controls (Figure 1F). Taken together, these results demonstrate that HTR3A expression is significantly increased in brains from Tg AD mice and AD patients.
HTR3A interneurons may partially contribute to Aβ generation in Tg AD mice
Given that APP and BACE1 are substrate and key enzymes to produce Aβ peptide, we next performed APP/6E10 and BACE1/6E10 double immunostaining to examine the association of APP- or BACE1-positive neurites with Aβ plaques in 7-month-old Tg AD mice. As in other previous reports (Zhang et al., 2009; Kandalepas et al., 2013), many APP- and BACE1-positive dystrophic neurites were clustered in a hollow rosette, which was occupied by a bigger Aβ plaque, or around smaller Aβ plaques (Additional Figure 2A and B). Colocalization of APP/6E10 or BACE1/6E10 was detected in APP- or BACE1-positive neurites near Aβ plaques (Additional Figure 2A and B), suggesting that Aβ was inside dystrophic neurites labeled by APP or BACE1, consistent with previous studies (Zhang et al., 2009; Kandalepas et al., 2013).To determine whether HTR3A interneurons are associated with Aβ plaques, we performed double thioflavin S/HTR3A staining and observed many clustered HTR3A interneurons around Aβ plaques. Notably, colocalization of HTR3A with thioflavin S was observed (Figure 1G), indicating that HTR3A interneurons may generate Aβ peptides. Additionally, double-immunostaining of APP/HTR3A and BACE1/HTR3A showed that some of the clustered APP- or BACE1-positive neurites near Aβ plaques colocalized with HTR3A interneurons (Figure 1H and I), indicating that some APP-positive or BACE1-positive neurites are derived from HTR3A interneurons. These results indicate that HTR3A-positive interneurons may contribute, at least in part, to Aβ generation in Tg AD mice.
Chronic tropisetron treatment diminishes Aβ plaque levels and mitigates glial activation and neuroinflammation in Tg AD mice
To investigate the mechanisms underlying the effects of chronic tropisetron treatment (Figure 2A), we measured the levels of Aβ plaques in Tg AD mice. Using thioflavin S staining and 6E10 immunostaining, we observed a significant decrease in Aβ plaque-occupied areas in the cortex and hippocampus of tropisetron-treated Tg AD mice relative to Tg-AD controls (Figure 2B–E). Immunoblot analysis also showed a significant decrease in Aβ levels in cortex and hippocampus of tropisetron-treated Tg AD mice compared with Tg-AD controls (Figure 2F–I). These findings suggest that chronic tropisetron treatment attenuated Aβ plaque levels in Tg AD mice.
Given that glial activation and ensuing neuroinflammation are highly associated with levels of Aβ plaques in AD pathogenesis, we investigated glial activation in Tg AD mice following chronic tropisetron treatment. Western blot analysis showed that chronic tropisetron treatment significantly inhibited IBA-1 expression in the hippocampus and cortex of Tg AD mice (Figure 3A–C). In addition, immunostaining analysis exhibited that chronic tropisetron treatment significantly decreased the amounts of microglia labeled by IBA-1 or CD68 in the cortex and hippocampus of Tg AD mice (Figure 3D–G). Furthermore, immunoblot analysis displayed that GFAP levels were significantly decreased in the hippocampus, but no significant decrease was observed in the cortex of Tg AD mice given tropisetron relative to the NS-treated Tg-AD group (Figure 3H–J). This was also confirmed by immunostaining analysis, showing a significant decrease in the amounts of GFAP-positive astrocytes in the hippocampus of tropisetron-treated Tg AD mice (Figure 3K and L). These results suggest that chronic tropisetron treatment relieves glial activation in Tg AD mice.
Glial activation is closely correlated with cytokine production (Liu et al., 2020). Thus, pro-inflammatory cytokines including IL-1β, TNF-α and iNOS were assessed. Immunoblot analysis displayed that levels of IL-1β and TNF-α in the hippocampus and cortex were significantly increased in Tg-AD mice compared with WT controls, consistent with a previous report (Liu et al., 2020). Notably, chronic tropisetron treatment significantly lowered the levels of IL-1β and TNF-α in Tg AD mice (Figure 4A–D). Moreover, iNOS immunostaining displayed that chronic tropisetron treatment significantly decreased the iNOS-positive area in the hippocampus and cortex of Tg AD mice (Figure 4E and F). These results show that chronic tropisetron treatment reduces neuroinflammation in Tg AD mice.
Chronic tropisetron treatment alleviates cognitive deficits in Tg AD mice
After tropisetron was adminstrated for 8 consecutive weeks in Tg AD mice, the cognitive behavioral tests were performed (Figure 2A). In the novel object recognition test, all mice displayed comparable times for two identical objects (Figure 5A and B). In the test trial, NS-treated Tg-AD mice (Tg AD controls) showed no significant difference in exploring time for the novel and familiar objects, which was indicative of impaired memory. In contrast, tropisetrontreated Tg AD mice showed a significantly longer exploring time for the novel object than for the familiar one, as did NS-treated WT mice (WT controls), suggesting that tropisetron treatment reverses the impaired memory of Tg AD mice. In the acquisition trial of the Morris water maze test, Tg-AD controls showed impaired learning relative to WT controls, which was indicated by a significantly longer latency on days 5 and 6 of training, but tropisetron treatment partly reversed the impaired learning of Tg AD mice (Figure 5C). In a hidden probe test on day 7, Tg-AD controls spent similar time in all quadrants, indicative of memory deficits. In contrast, tropisetron-treated Tg AD mice spent a significantly longer time in the target quadrant than in other quadrants (Figure 5D and E), suggesting that tropisetron treatment reverses the impaired spatial memory of Tg AD mice. Tropisetron treatment had no effect on swimming speed in all groups of mice (Figure 5F). Taken together, these results suggest that chronic tropisetron treatment partly alleviates the cognitive deficits of Tg AD mice.
Chronic tropisetron treatment downregulates HTR3A-expression of hippocampus in Tg AD mice
Receptors may be adjusted upwards or downwards after long-term administration of receptor blockers or agonists. Thus, we measured protein levels of HTR3A, which is required for functional HTR3 and determines HTR3 function. Western blot analysis showed that HTR3A levels of hippocampus and cortex in Tg AD mice were significantly increased compared with WT controls (Figure 6A–C), consistent with our results in Figure 1A. Notably, chronic tropisetron treatment significantly reduced the elevation of HTR3A expression in hippocampus but had no significant effect in the cortex of Tg AD mice (Figure 6A–C). Additionally, HTR3A immunostaining showed that the amounts of HTR3A-positive interneurons in tropisetron-treated Tg AD mice were significantly decreased in the hippocampus but no statistical difference was observed in the cortex compared with Tg-AD control (Figure 6D and E). These findings indicates that chronic tropisetron treatment significantly down-regulates HTR3A expression in the hippocampus of Tg AD mice.
Chronic tropisetron treatment partly prevents increased basal iCa2+ levels and decreases the number of iCa2+/HTR3A interneurons in Tg AD mice
HTR3 is an ionotropic receptor with permeability to Ca2+(Maricq et al., 1991; McMahon and Kauer, 1997; Turner et al., 2004). Thus, we assessed whether chronic tropisetron treatment affects basal levels of iCa2+in HTR3Apositive interneurons in Tg AD mice. Basal iCa2+levels were measured by Fura-2 assay as previously described (Doolen et al., 2012; Waldeck-Weiermair et al., 2015). Tg AD mice showed a significant increase in basal iCa2+levels in the hippocampus and cortex compared with WT controls, and chronic tropisetron administration partly reversed the increased basal iCa2+levels in Tg AD mice (Figure 7A and B). We next examined basal iCa2+level in HTR3Apositive interneurons (iCa2+/HTR3A+) in tropisetron-treated AD mice and AD control using Fura-2 assay with HTR3A immunostaining. Notably, we observed colocalization of iCa2+with some HTR3A-positive interneurons (iCa2+/HTR3A+) (Figure 7C), suggesting increased basal iCa2+levels in HTR3Apositive interneurons. Quantitative analysis demonstrated that chronic tropisetron administration significantly lowered the number of the iCa2+/HTR3A+interneurons in the hippocampus and cortex compared with that of Tg AD mice (Figure 7D). These results indicate that chronic tropisetron administration significantly reversed the increased basal iCa2+levels and number of iCa2+/HTR3A+interneurons in Tg AD mice.
Chronic tropisetron treatment inhibits the calcineurin/nuclear factor of activated T cell signaling pathway in Tg AD mice
Given that tropisetron affected basal iCa2+levels in Tg AD mice, we further examined whether iCa2+downstream signaling was impacted. We examined the expression and activity of Calcineurin (CaN), a serine/threonine protein phosphatase exclusively regulated by iCa2+and calmodulin (Rusnak and Mertz, 2000), in Tg AD mice after chronic tropisetron treatment. Western blot assay showed that the expressions of subunit Aα and Aβ of CaN in the hippocampus and cortex were similar in all groups of mice (Figure 8A–D). However, activated CaN, as indicated by cleaved truncated A and B subunit (cCaN-Aα and cCaN-Aβ), was significantly elevated in the hippocampus and cortex of Tg AD controls compared with WT controls (Figure 8A–D), confirming an elevated CaN activity in Tg AD mice, as previously reported (Norris et al., 2005). Notably, the elevated CaN activity was reversed by chronic tropisetron administration in Tg AD mice (Figure 8A–D). PKCα kinase, which is activated by iCa2+and diacylglycerol (Mérida et al., 2019), and the calcium buffering protein calbindin were examined by western blot assay. No statistical difference was observed in p-PKCα and calbindin levels among the three groups (Additional Figure 3A–D).
NFATc (isoforms, i.e., NFATc 1–4), nuclear factor of activated T cells, are well-known CaN substrates (Abdul et al., 2009; Hopp et al., 2018). When dephosphorylated by CaN, NFATc leaves the cytosol and translocates into nucleus to regulate targeted gene expression (Abdul et al., 2009). Previous studies showed an increase in activated NFATc4 in brains from Tg AD mice and AD patients (Abdul et al., 2009; Hudry et al., 2012; Li et al., 2017; Hopp et al., 2018). Therefore, we examined NFATc4 using immunostaining analysis. As previously described (Hudry et al., 2012), fluorescence intensity of NFATc4 in nucleus was determined by overlap with the nuclear staining DAPI. NFATc4 positive staining was observed in both the nucleus and cytoplasm (Figure 8E). Quantitative analysis revealed that chronic tropisetron treatment significantly decreased both the total NFATc4-positive area and nuclear NFATc4-positive area in the hippocampus of Tg AD mice (Figure 8F). Furthermore, levels of CaN-Aα, active cCaN-Aα and NFATc4 were significantly increased in the temporal cortex of AD patients compared with controls, consistent with previous reports (Abdul et al., 2009; Hopp et al., 2018). The NF-κB transcriptional factor is implicated in neuroinflammation and subsequent cognitive impairment and is activated by phosphorylated IκB-α (Li et al., 2017). The levels of IκB-α and phosphorylated IκB-α in the hippocampus and cortex were not changed among the three mouse groups (Figure 8, and Additional Figure 3E–H). Together, these results suggest that chronic tropisetron treatment reversed the increase of CaN/NFAT signaling but had no significant effect on NF-κB signaling in Tg AD mice.
Chronic tropisetron treatment does not affect APP processing in Tg AD mice
We explored whether the decreased levels of Aβ plaques observed in tropisetron-treated Tg AD mice was from altered APP processing by examining the expressions of APP and BACE1 and β- and α-secretase activities. APP expression was significantly increased in Tg AD mice with or without tropisetron administration compared with WT controls, whereas no significant change was detected in tropisetron-treated Tg AD mice compared with AD controls (Figure 9A–C). In addition, BACE1 protein showed no significant difference in the hippocampus and cortex in all groups (Figure 9A, B, and D). Furthermore, β- and α-secretase activities were also unaffected, as indicated by the levels of the hydrolysate sAPPβ and sAPPα, respectively (Figure 9A, B, and E). Together, these data show that chronic tropisetron treatment does not significantly affect APP processing in Tg AD mice.
Chronic tropisetron treatment partly rescues the SYN loss in Tg AD mice
Finally, we wondered whether chronic tropisetron treatment affects neuronal and synaptic proteins in Tg AD mice. Expressions of NeuN, a marker of neurons, synaptic proteins including PSD-95 and SYN and the glutamate receptor mGluR6 were determined by immunoblot analysis. The levels of NeuN, PSD-95 and mGluR6 showed no significant difference in the cortex (Additional Figure 4) and hippocampus in all groups of mice (Figure 9F and G). However, SYN was significantly decreased in the hippocampus and cortex from Tg AD controls compared with WT controls. Notably, chronic tropisetron treatment partly prevented SYN loss in the hippocampus in Tg AD mice (Figure 9F and G). Altogether, these results suggest that tropisetron partially rescues the presynaptic SYN loss in the hippocampus of Tg AD mice.
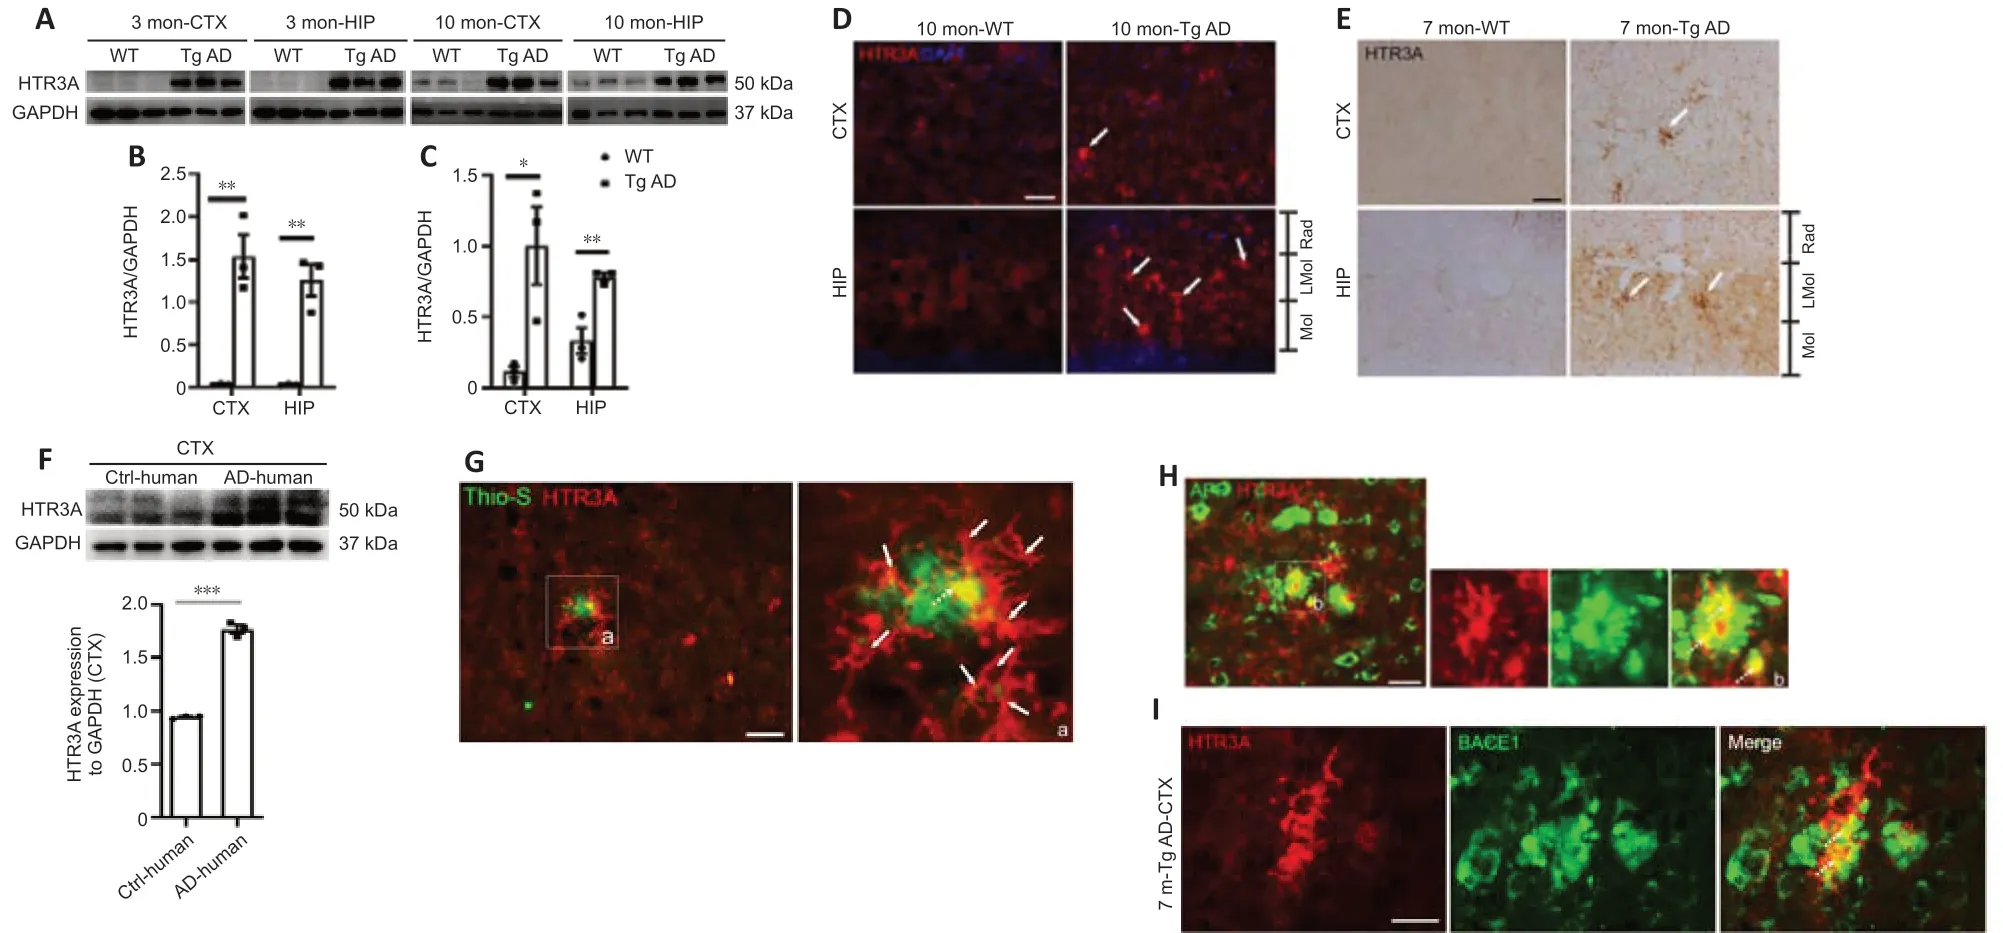
Figure 1|Increased expression of HTR3A in brains from Tg AD mice and AD patients.
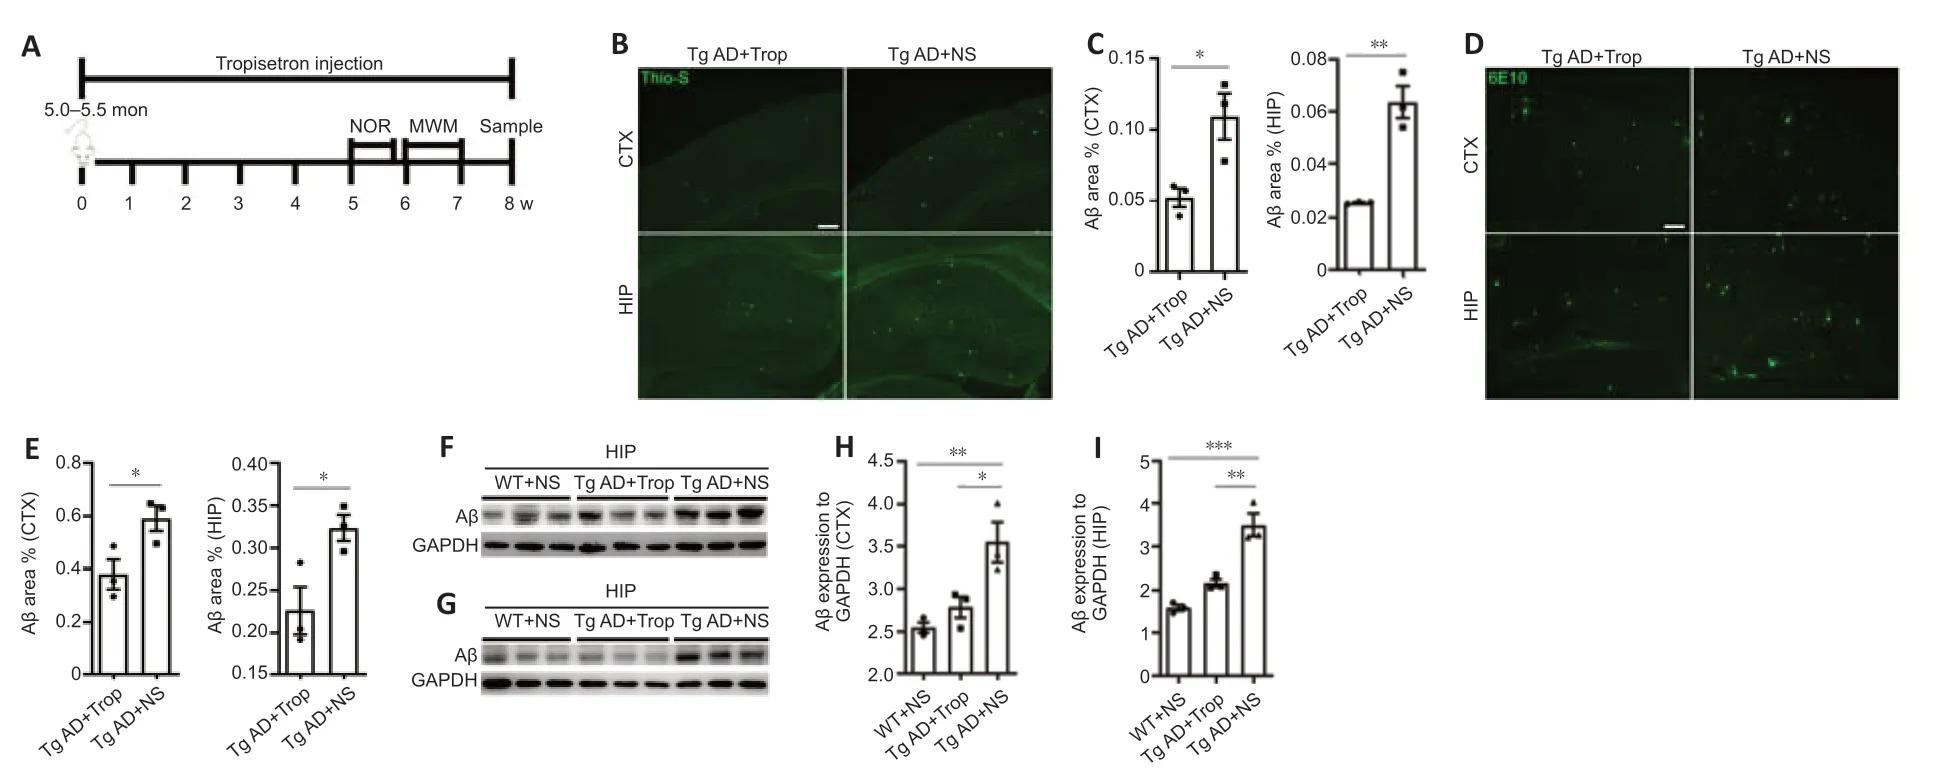
Figure 2|Chronic tropisetron treatment diminishes Aβ plaque levels in Tg AD mice.
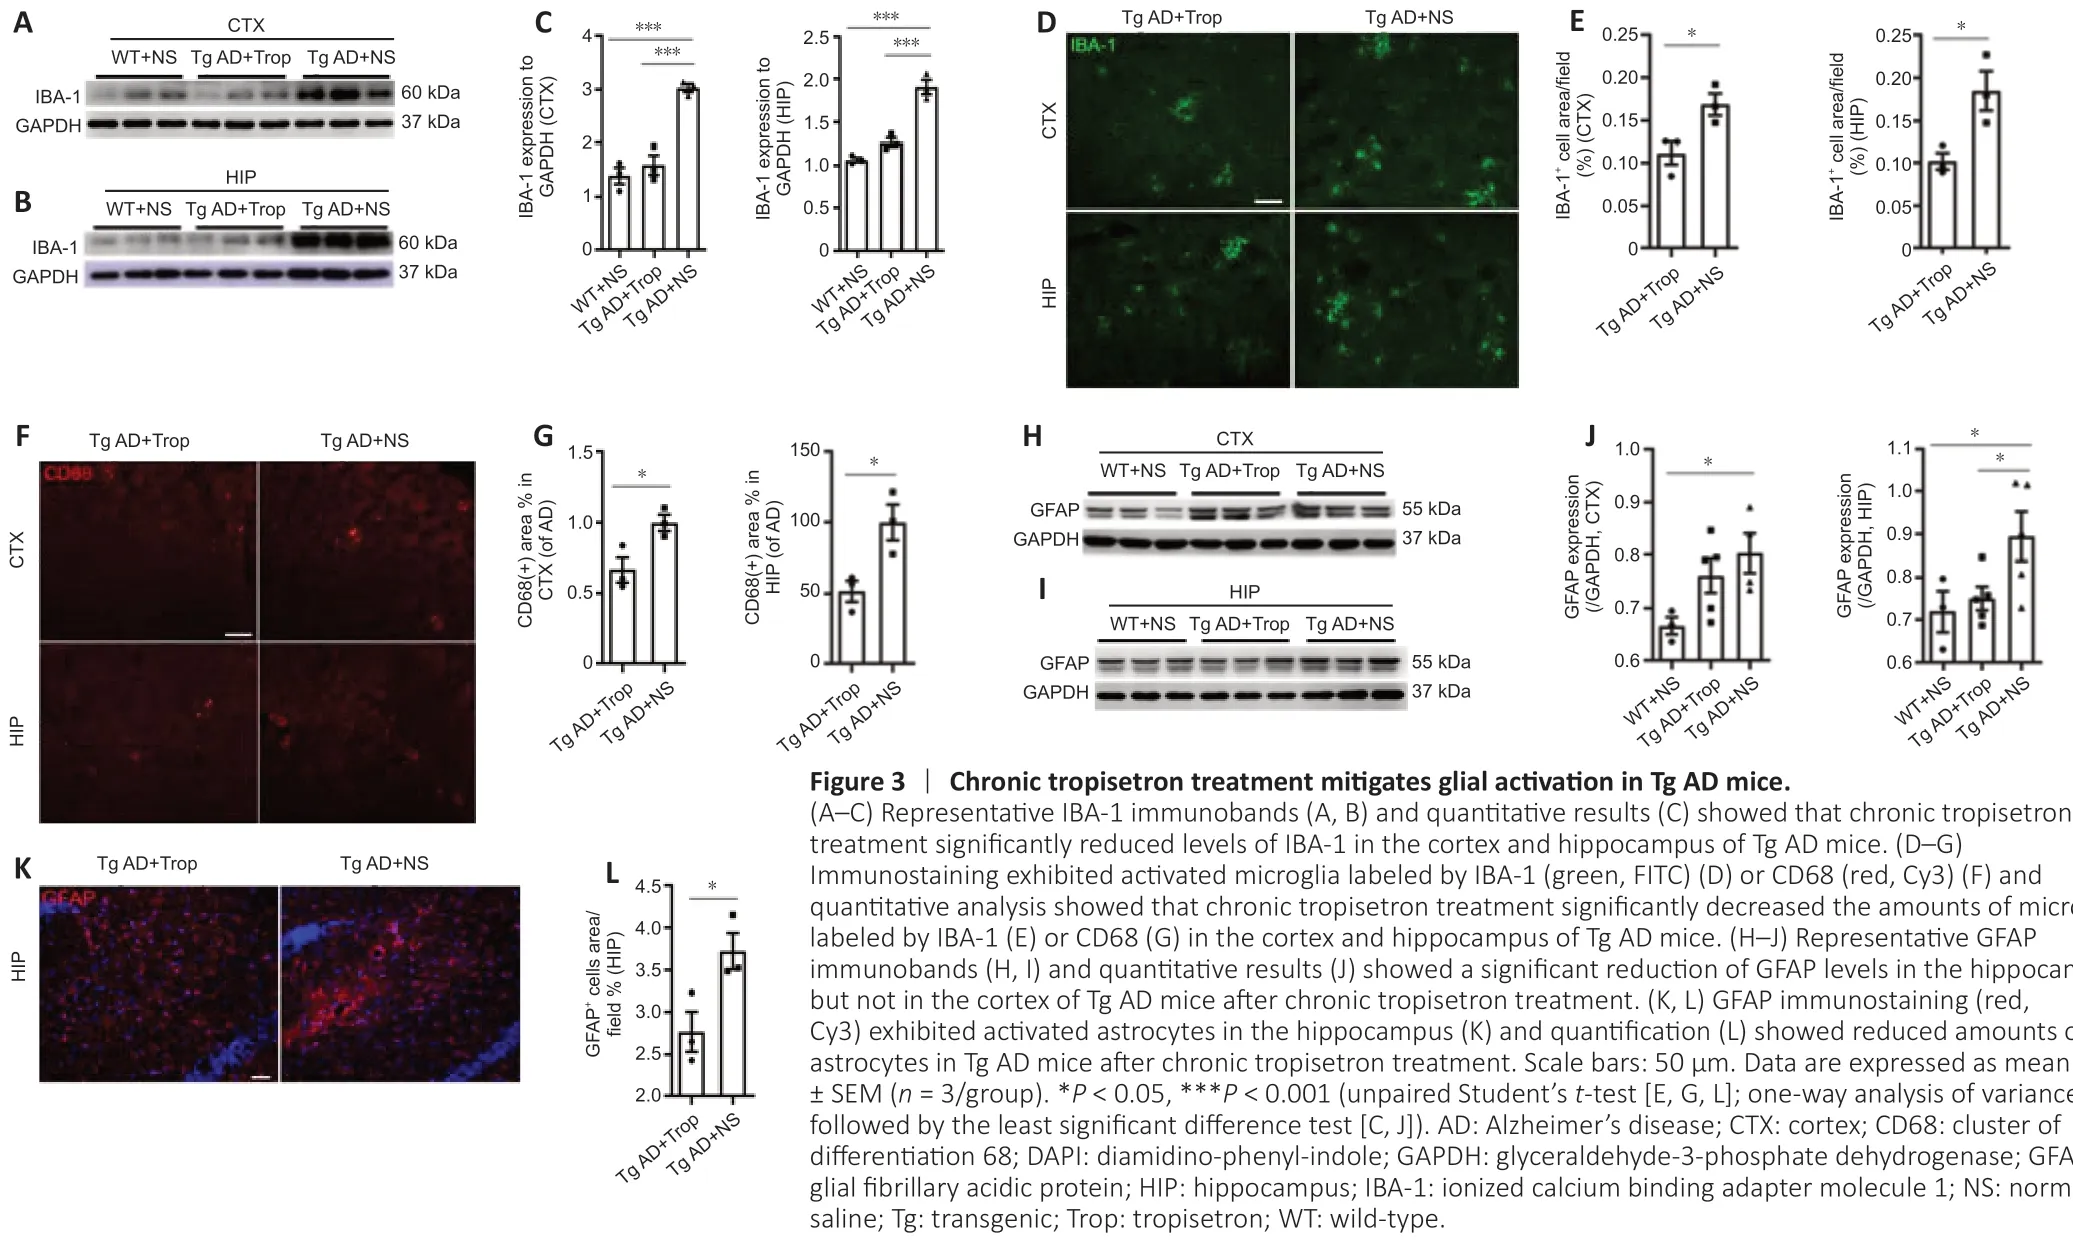
Figure 3|Chronic tropisetron treatment mitigates glial activation in Tg AD mice.

Figure 4|Chronic tropisetron treatment diminishes neuroinflammation in Tg AD mice.

Figure 5|Chronic tropisetron treatment alleviates cognitive deficits in Tg AD mice.
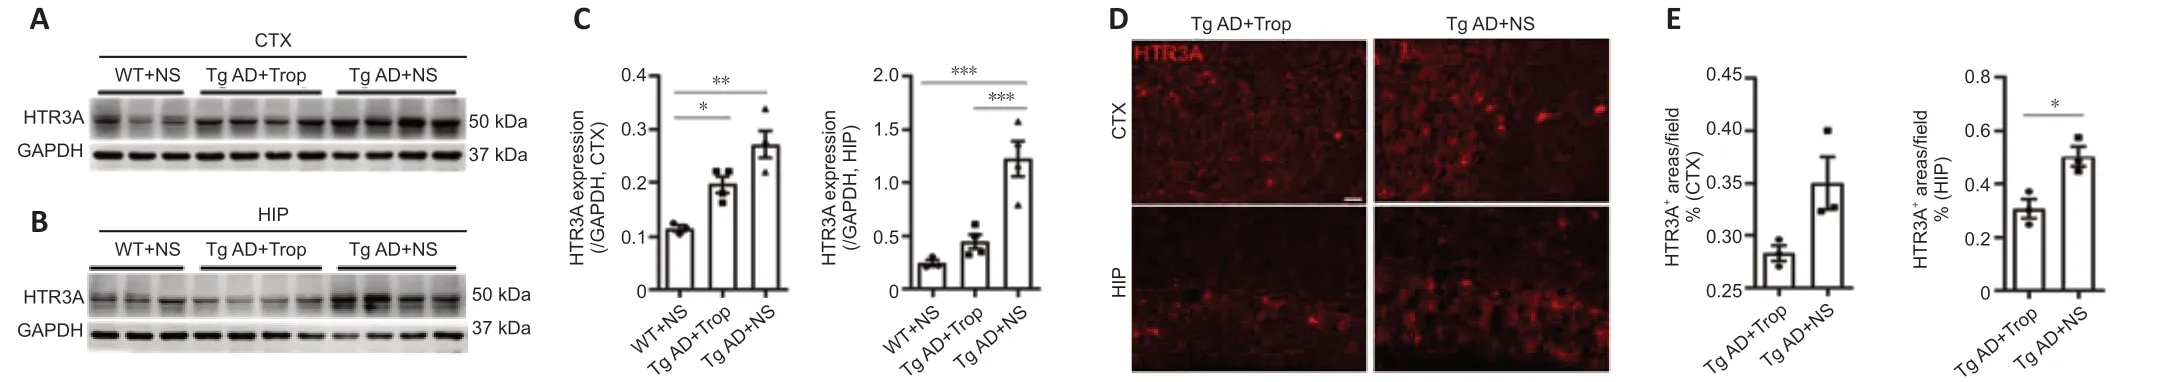
Figure 6|Chronic tropisetron treatment downregulates HTR3A expression in the hippocampus of Tg AD mice.

Figure 7|Chronic tropisetron treatment partly prevents increased basal intracellular calcium (iCa2+) levels and decreases the number of iCa2+/HTR3A interneurons in Tg AD mice.

Figure 8|Chronic tropisetron treatment inhibits calcineurin (CaN)/nuclear factor of activated T cells (NFAT) signaling in Tg AD mice.
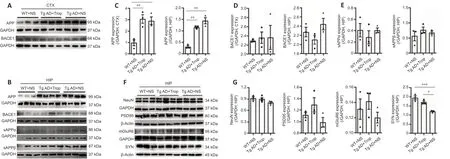
Figure 9|Chronic tropisetron treatment has no effect on APP processing and partly rescues synaptophysin loss in Tg AD mice.
Discussion
Our findings show that HTR3A levels were remarkably increased in brains from Tg AD mice before appearance of Aβ plaques and postmortem AD patients. In Tg AD mice, high HTR3A-positive interneurons are clustered around Aβ plaques; the partial colocalization of APP, BACE1 and 6E10 with HTR3A suggests that HTR3A-positive interneurons may partially contribute to the generation of Aβ peptides. Moreover, chronic treatment of HTR3 antagonist tropisetron significantly reduced the levels of Aβ plaques, alleviated cognitive deficits and reversed the increase in HTR3A expression likely through the iCa2+/CaN/NFAT signaling pathway. These results may implicate HTR3A interneurons as a new intervention target and biomarker for AD.
While Aβ plaques are the most prominent pathological feature of AD, the specific type of neurons that contributes to Aβ generation in the initial stages of the disease is unknown. We found that HTR3A levels were significantly increased in brains of Tg AD mice, and this increase occurred in 3-month-old Tg AD mice before visible Aβ plaques were present. In addition, high HTR3Apositive interneurons were clustered around Aβ plaques and co-localized with part of the Aβ plaques, and part of the APP- or BACE1-positive neurites around Aβ plaques co-localized with HTR3A-positive interneurons. Given that APP- or BACE1-positive neurites (axon terminals) near Aβ plaques produce Aβ peptides (Hartmann et al., 1997; Zhang et al., 2009; Kandalepas et al., 2013), our results suggest that HTR3A-positive interneurons may partially contribute to Aβ generation at the initial stage of AD in mice. Notably, this increase in HTR3A levels was also found in AD patient brains. Given the high conservation of the HTR3A gene between rodents and humans, our results may identify a novel target for a therapeutic strategy for AD.To further confirm our view that HTR3A interneurons may partially contribute to Aβ generation, the HTR3 antagonist tropisetron was used to chronically block HTR3 in Tg AD mice during the early stage of Aβ plaque deposition, and the impact on Aβ plaque levels and underlying mechanisms were explored. Chronic tropisetron treatment significantly decreased HTR3A immunoband levels and amounts of HTR3A interneurons in the hippocampus. Similar to our observations, previous results have shown that chronic nicotine exposure upregulates nicotinic acetylcholine receptors (Srivareerat et al., 2011). Given receptor adaptability in diverse conditions, long-term blocking of HTR3 could affect the expression of HTR3A protein. However, future studies are required to determine the underlying mechanisms, which may occur through translation and/or post-translational modifications. In contrast, a downward trend in HTR3A protein levels was observed in the cortex of Tg AD mice. This difference in HTR3A alteration between the hippocampus and cortex may result from disparities in HTR3A expression levels and/or local tropisetron concentration (Barnes et al., 1990; Tecott et al., 1993; Morales et al., 1996; Koyama et al., 2017). Notably, the amounts of Aβ plaques were significantly decreased in the hippocampus and cortex. From these results, we considered that the decreased number of HTR3A interneurons results in lower levels of Aβ plaques in the hippocampus of Tg AD mice after chronic tropisetron treatment despite insignificant decrease of THR3A in cortex. Therefore, these results provide the first evidence that HTR3A-positive interneurons may partly contribute to Aβ generation in Tg AD mice.
Two previous pharmacologicalin vivostudies showed protection of tropisetron in an Aβ rat model of AD and J20 mouse model of AD (Rahimian et al., 2013; Spilman et al., 2014). In J20 mice, chronic tropisetron subcutaneous injection (8-week) improved spatial memory and increased the sAPPα/Aβ1–42ratio through multifunctional properties including HTR3 antagonist, alpha 7 nicotinic acetylcholine receptor agonist and APP interaction (tropisetron binding to APP) (Spilman et al., 2014). In Aβ-impaired rats, tropisetron markedly reversed cognitive deficits and significantly diminished the elevated levels of pro-inflammatory factors TNF-α and iNOS through both HTR3-dependent and independent pathways (Rahimian et al., 2013). In the present study, chronic tropisetron treatment was also observed to significantly ameliorate cognitive deficits and diminish the elevated levels of glial activation and pro-inflammatory cytokines TNF-α, iNOS, and IL-1β in Tg AD mice. Considering the known tropisetron functional properties, including as a HTR3 antagonist, alpha 7 nicotinic acetylcholine receptor agonist, and APP interactor (Rahimian et al., 2013; Spilman et al., 2014), we infer that the attenuation of glial activation and neuroinflammatory response after tropisetron treatment may result from the decreased Aβ plaque level in Tg AD mice.
HTR3 is a ligand-gated Ca2+-permeable ionotropic receptor, and pre-synaptic HTR3 displays high Ca2+permeability in the hippocampus (Turner et al., 2004). From our results showing that HTR3A is substantially increased in Tg AD mice, we further explored whether tropisetron treatment affects basal iCa2+levels using Fura-2 assay. Consistent with present view that neuronal hyperactivity exists in AD (Busche et al., 2008; Lerdkrai et al., 2018), an increase in basal iCa2+levels was observed in both the hippocampus and cortex of Tg AD mice relative to WT mice. Notably, chronic tropisetron treatment restored normal basal iCa2+levels in Tg AD mice. Moreover, double Fura-2/HTR3A immunostaining showed the iCa2+/HTR3A+interneurons and their numbers were significantly reduced after chronic tropisetron treatment. Neurons in the cortex and hippocampus of different mouse models of AD are hyperactive (Busche et al., 2008; Lerdkrai et al., 2018; Hijazi et al., 2020). In APP23/PS45 mice, Busche et al. (2008) described clusters of hyperactive neuronsin vivoexclusively near Aβ plaques in the cortex using two-photon Ca2+-images. In addition, Lerdkrai et al. reported that intracellular Ca2+stores contribute to neuronal hyperactivityin vivoin cortex using two-photon Ca2+-images and identified that hyperactive neurons in the cortex occur even without amyloid deposition and neuroinflammation in Tg APP/PS1 mice. While Hijazy et al. (2020) recently reported that hippocampal parvalbumin interneurons become hyperexcitable before amyloid deposition in Tg APP/PS1 mice, the specific types of neurons that are hyperactive are unknown. Moreover, Hijazy et al. (2020) confirmed that this hyperexcitable state of PV interneurons coincides with increased inhibitory transmission onto hippocampal pyramidal neurons and deficits in spatial learning and memory. In present study, the detection of iCa2+/HTR3A+clustered interneurons near Aβ plaques provides some evidence that HTR3A interneurons may be part of the hyperactive neurons in Tg AD mice. Notably, we also observed the increased expressions of HTR3A in postmortem AD patient brains. Therefore, HTR3A interneurons might represent an early biomarker of ADin vivoin both human AD patients and mouse models of AD using magnetic resonance imaging. However, our current results need to be further confirmed byin vivotwo-photon Ca2+-imaging to selectively visualize HTR3A interneurons and/or silencing of the HTR3A gene in Tg AD mice. Taken together, our results provide some evidence that chronic tropisetron treatment probably mediates basal iCa2+levels of HTR3A interneurons through an HTR3-dependent pathway and that HTR3A interneurons may be one part of hyperactive neurons near Aβ plaques in Tg AD mice.
CaN is a unique neuronal Ca2+/calmodulin-dependent a serine/threonine phosphatase. In a normal brain, CaN is expressed primarily in neurons and only weakly, or not at all, in astrocytes (Goto et al., 1986). In contrast, the hippocampus and cortex of postmortem AD patients and AD mouse models show an increased CaN activity in a subset of activated astrocytes surrounding amyloid plaques (Norris et al., 2005; Wu et al., 2010; Mohmmad Abdul et al., 2011; Sompol et al., 2017), and blockade of astrocytic calcineurin signaling ameliorates neurologic changes in AD mouse models (Sompol and Norris, 2018). In line with previous studies (Norris et al., 2005; Mohmmad Abdul et al., 2011), our results showed an increased CaN activity in brains from Tg AD mice and AD patients. Moreover, chronic tropisetron treatment completely prevented the elevated activity of CaN in Tg AD mice but had no effect on CaN expression. Chronic tropisetron treatment remarkably reduced the numbers of both HTR3A interneurons and iCa2+/HTR3A+interneurons; thus, we infer that an increase in CaN activity may partially occur in HTR3A interneurons, and chronic tropisetron treatment drops CaN activity likely by an HTR3-dependent manner, which leads to Ca2+influx decrease and lessened CaN activity in HTR3A interneurons. Consistent with our observations, tropistron administration significantly diminished CaN activity in Aβ-impaired rats through an HTR3-dependent manner (Rahimian et al., 2013). Therefore, CaN activity may increase in HTR3A interneurons, although CaN activity from other cell types is not excluded. Wu et al. (2010) showed that Aβ induces morphological neurodegenerative spine loss, dendritic simplification and neuritic dystrophies through increased CaN activation in neurons. Hopp et al. reported that hippocampal neurons over-expressing active-CaN in WT mice induced substantial down-regulation of numerous transcripts, especially those related to the synaptic physiology, which overlaps with the pattern of changes observed in AD brains. Combined with these previous reports, our results suggest that HTR3A interneurons may exhibit an increase in CaN activity in Tg AD mice.
Four NFATc isoforms (NFATc 1–4) are phosphorated by activated CaN and then translocate into the nucleus to activate target genes associated with neuronal survival, axonal outgrowth and dendritic arborization (Li et al., 2017; Sompol et al., 2017; Hopp et al., 2018). Abdul et al. (2009) reported that increased levels of NFAT1 and NFAT3 were in nuclear compartments of the hippocampus at different stages of AD disease and cognitive decline. Other studies reported a CaN-dependent elevated expression of NFATc4 in activated astrocytes in a 5×FAD mouse model (Sompol et al., 2017; Sompol and Norris, 2018), and hyperactivated CaN/NFATc4 signaling in astrocytes led to the downregulation of glutamate transporters-1 and production and release of numerous proinflammatory cytokines. Wu et al. (2010) reported a CaN-dependent elevated expression of NFATc4 in neuronsin vitroand in adult mouse brains. Blocking CaN activity using the CaN inhibitor FK506 (Rozkalne et al., 2011) or virus containing the astrocyte-specific promoter Gfa2 and NFAT inhibitory peptide VIVTT or AKAP79 alleviated neuritic abnormalities in the vicinity of Aβ plaques and improved cognitive behaviors (Abdul et al., 2009; Hudry et al., 2012; Sompol et al., 2017). Our results showed that chronic tropisetron treatment significantly decreased levels of total and nuclear NFATc4 in the hippocampus of Tg AD mice. An increase in NFATc4 levels was detected in the temporal cortex of AD patients, consistent with previous reports (Abdul et al., 2009; Mohmmad Abdul et al., 2011). Despite our failure to label NFATc4/HTR3A in this study, we cannot exclude the possibility that HTR3A interneurons express NFATc4 given that iCa2+/HTR3A interneurons were observed and their numbers declined when exposed to chronic tropisetron treatment. Additionally, our results showed that chronic tropisetron treatment had no significant effect on NF-κB signaling in Tg AD mice.
This study has several limitations. The relationship between the location and expression level of HTR3A in brain and Braak NFT grade or Thal Aβ phases was not examined. Furthermore, whether HTR3A interneurons are colocalized with Aβ plaques in AD patients has not been determined. We will focus on these issues in our next research.
In conclusion, we report that HTR3A expression is significantly increased in brains from both Tg AD mice and AD patients, and HTR3A-positive interneurons may partially contribute to Aβ generation. Furthermore, chronic tropisetron administration alleviates cognitive deficits and decreases Aβ plaque levels in Tg AD mice likely through an HTR3-dependent manner and alleviating iCa2+/CaN/NFAT signaling. These findings may provide a potential therapeutic target for AD disease.
Acknowledgments:We are greatly grateful to Dr. Xiao-Xin Yan, Professor of Department of Anatomy and Neurobiology, Xiangya School of Medicine, Central South University, China. He kindly provided brain samples of postmodern AD patients and human controls for our experiments from the NeuroBioBank of Central South University.
Author contributions:Study design: QLY; experimental implementation: LFL, DDW, NNL; experimental assistance: LH; data analysis: YTL; figure production: JC, YNZ; manuscript draft: QLY and YTL. All authors read and approved the final version of the manuscript.
Conflicts of interest:The authors declare no conflict of interest.
Data availability statement:All relevant data are within the paper and its Additional files.
Open access statement:This is an open access journal, and articles are distributed under the terms of the Creative Commons AttributionNonCommercial-ShareAlike 4.0 License, which allows others to remix, tweak, and build upon the work non-commercially, as long as appropriate credit is given and the new creations are licensed under the identical terms.
Open peer reviewer:Henric Ek Olofsson, Lund University, Sweden.
Additional files:
Additional Figure 1: Aβ plaques and neurofibrillary tangles in the brain of Alzheimer’s disease patients.
Additional Figure 2: Immunodouble staining of APP/6E10 (A) or BACE1/6E10 (B) confirmed the colocalization in APP- or BACE1-positive neurites near Aβ plaques.
Additional Figure 3: Tropisetron has no effect on p-PKCα, calbindin and NF-κB signaling in Tg AD mice detected by western blot.
Additional Figure 4: Tropisetron has no effect on NeuN, synaptic protein PSD-95 and SYN, glutamate receptor mGluR6 in Tg AD mice detected by Western blot.
Additional Table 1:Information on AD patients and controls.
Additional file 1:Open peer review report 1.
- 中国神经再生研究(英文版)的其它文章
- Mesenchymal stem cells, extracellular vesicles, and transcranial magnetic stimulation for ferroptosis after spinal cord injury
- Inducing prion protein shedding as a neuroprotective and regenerative approach in pathological conditions of the brain: from theory to facts
- Use of mesenchymal stem cell therapy in COVID-19 related strokes
- Brain organoids are new tool for drug screening of neurological diseases
- Emerging roles of astrocytes in blood-brain barrier disruption upon amyloid-beta insults in Alzheimer’s disease
- External anal sphincter electromyography in multiple system atrophy: implications for diagnosis, clinical correlations, and novel insights into prognosis