
A Novel Light Weight CNN Framework Integrated with Marine Predator Optimization for the Assessment of Tear Film-Lipid Layer Patterns
2023-02-17 03:11BejoyAbrahamJesnaMohanLinuShineandSivakumarRamachandran
Bejoy Abraham, Jesna Mohan, Linu Shine and Sivakumar Ramachandran,*
1Department of Computer Science and Engineering,College of Engineering Muttathara,Thiruvananthapuram,Kerala,695008,India
2Department of Computer Science and Engineering,Mar Baselios College of Engineering and Technology,Thiruvananthapuram,Kerala,695015,India
3Department of Electronics and Communication Engineering,College of Engineering Trivandrum,Kerala,695016,India
ABSTRACT Tear film,the outermost layer of the eye,is a complex and dynamic structure responsible for tear production.The tear film lipid layer is a vital component of the tear film that provides a smooth optical surface for the cornea and wetting the ocular surface.Dry eye syndrome(DES)is a symptomatic disease caused by reduced tear production,poor tear quality,or excessive evaporation.Its diagnosis is a difficult task due to its multifactorial etiology.Out of several clinical tests available,the evaluation of the interference patterns of the tear film lipid layer forms a potential tool for DES diagnosis.An instrument known as Tearscope Plus allows the rapid assessment of the lipid layer.A grading scale composed of five categories is used to classify lipid layer patterns.The reported work proposes the design of an automatic system employing light weight convolutional neural networks(CNN)and nature inspired optimization techniques to assess the tear film lipid layer patterns by interpreting the images acquired with the Tearscope Plus.The designed framework achieves promising results compared with the existing state-of-the-art techniques.
KEYWORDS Dry-eye syndrome;tearscope plus;tear film;deep neural networks
1 Introduction
The eyes are the most delicate and complex organs that a human being possesses. The ocular surface represents the eye’s outer surface,which consists of the cornea and the conjunctiva.Moreover,this outer surface has a complex and dynamic covering called tear film, which acts as an interface between the eye and the external environment. The tear film is a three-layer structure consisting of the innermost mucous layer,the middle aqueous layer and a delicate anterior lipid layer.The tear film lipid layer, composed of polar and non-polar lipids, provides a smooth covering for the cornea and impedes evaporation from the ocular surface.The abnormal conditions of the tear film due to poor tear quality,reduced tear production,or excessive tear evaporation lead to the cause of Evaporative Dry Eye(EDE)syndrome in the eyes.
Dry eye syndrome is a symptomatic disease that affects a wide range of the population.Diseaserelated difficulties are most common in persons over 50 years old, but they are also on the rise among young adults, which experts point out the ubiquity of smart phones and computers. The prolonged wearing of contact glasses may also contribute to the prevalence of dry eyes among the young population[1].A recent survey established the usage of face-masks against the spread of SARSCoV-2,reported symptoms of dry eye-related issues in the general population[2].There exist several clinical tests for its diagnosis due to its multifactorial etiology. The evaluation of the interference patterns in the images of the tear film lipid layer could provide diagnostic information of this disease.Tearscope Plus allows clinicians to rapidly assess the lipid layer thickness and grade these patterns into one of the five categories.
The International Dry Eye Workshop (DEWS) established that dry eye syndrome (DES) is a multifactorial disease with distinct manifestations [3]. The symptoms include visual disturbance,discomfort in the eyes, and tear film instability leading to potential damage to the ocular surface.Moreover,the disorder causes an increased osmotic concentration of the tear film and inflammation of the ocular surface.The statistics show that the disease is prevalent among 5%-50%of the general population[1].
The lipid layer plays a significant role in restricting evaporation during the inter-blink period and affects tear film stability. The Tearscope Plus, an instrument designed by Guillon, allows the evaluation of lipid layer thickness using five primary grades of interference patterns: Color Fringe,Open Mesh-work, Wave, Closed Mesh-work, and Amorphous. The visual appearance and colour of the interference patterns provide prognostic features of the structural regularity and thickness of the lipid layers. The manual screening of tear film images for identifying different patterns is very cumbersome.Moreover,direct observation of the tear film is complex and poses great difficulties in diagnosing DES. In this paper, an assessment of tear film stability through the lipid layer pattern analysis is reported.We aim to design an automatic system to classify four different tear film lipid layer patterns,namely Color Fringe,Open Mesh-work,Wave and Closed Mesh-work,defined by Guillon[4]. The Amorphous category images are not used in the study as it rarely appears during disease diagnosis [5]. In the tear film images captured using Tearscope Plus, we employ deep learning (DL)techniques to classify the lipid layer patterns into four categories.To the best of our knowledge,this is the first work in literature that uses DL-based techniques for tear film classification.
In Table 1, we provide the characteristic features of the four interference patterns used in the present study.
2 Related works
Literature features a large volume of research works on eye imaging.When compared to retinabased blood vessel segmentation studies [6-9], the amount of research publications on tear film imaging is very less. The research contributions [5,10,11] published by VARPA group are the only reference available for this study. The works reported were based on machine learning techniques employing hand-crafted features.The published results used experiments with different colour channels,feature descriptors and feature selection techniques.The major work reported in[5],used texture and colour features extracted from RGB,grayscale and L*a*b color components.The texture features were generated using Gabor filters, Butterworth filters, Markov Random Fields, Discrete Wavelet Transform,and co-occurrence matrix.The feature selection is performed using the consistency-based filter,Correlation-Based Feature Selection,and INTERACT,followed by classification using the SVM classifier.The remaining works[10,11]were only subsidiary of[5]and hence,they were not discussed again.

Table 1: Examples of representative images obtained from VARPA dataset along with the typical characteristics of each class,namely open mesh-work,closed mesh-work,Wave,and Color Fringe
The proposed framework achieves classification efficiency via two stages. First, rather than using highly complex neural network architectures for training, our proposed technique employs a lightweight CNN architecture inspired by two light weight pre-trained mobile CNNs, namely EfficientnetB0[12]and MobilenetV2[13],that is simple enough to reduce computational loads while still providing high accuracy when trained on tearscope images.Moreover,deployment of network in mobile devices is possible with light CNNs.Second,instead of relying on an end to end deep learning framework for classifying tear film lipid layer patterns, we employ machine learning techniques to classify concatenated features extracted from the light-weight CNN architecture. The following sections provide a detailed explanation of the technique, which includes the method for generating features and then classifying them into different lipid pattern groups.
To summarize, the research works present in the literature for classifying Tearscope images use texture features derived from various colour channels.In addition,for reducing the processing time,the extracted feature set is passed through feature selection algorithms before it is finally fed to a classifier.In our work,instead of using handcrafted features,we employ convolutional neural networks for tear film classification.The main contributions are:
i. A novel deep learning framework for the classification of tear film images.
ii. The proposed design integrates light weight convolutional neural networks(CNN)with Marine Predator algorithm,a nature-inspired optimization technique,for the classification.
iii. The proposed framework utilized graph cut segmentation to extract the region of interest(ROI) from the Tearscope images, whereas state-of-the-art techniques employed complex segmentation algorithms requiring manual interventions.
3 Materials Used
The image datasets used in the present study were obtained from the Faculty of Optics and Optometry, University of Santiago De Compostela, Spain. The images were captured using an instrument named Tearscope Plus, and the annotations were made by a group of optometrists. The datasets are publicly available for research on the website of the VARPA1tinyurl.com/5cdf8cep.research group.The dataset features are elaborated on below:
1. VOPTICAL V_l1 dataset: The VOPTICAL l1 (V_l1) dataset contains 105 images of the preocular tear film taken over optimum illumination conditions, and acquired from healthy subjects with dark eyes and aged from 19 to 33 years. The dataset includes 29 Open Meshwork, 29 Closed Mesh-work, 25 Wave, and 22 Color Fringe images. All the images have a spatial resolution of 1024×768 pixels and have been acquired with the Tearscope Plus.
2. VOPTICAL L dataset:The VOPTICAL L(V_L)dataset contains 108 images of the preocular tear film taken over optimum illumination conditions,and acquired from healthy subjects aged from 19 to 33 years.The dataset includes 30 Open Mesh-work,28 Closed Mesh-work,27 Wave and 23 Color Fringe images.All the images have a spatial resolution of 1024×768 pixels and have been acquired with the Tearscope Plus.
4 Method
The architecture of the proposed framework is shown in Fig.1. The Tearscope eye images are initially passed through a graph cut segmentation module,which removes the region outside the iris for extracting the ROI.The segmented ROI is then applied to a combination of the two light weight pre-trained mobile CNNs,namely EfficientnetB0[12]and MobilenetV2[13].The features extracted from the last fully connected layers of EfficientnetB0 and MobilenetV2 are applied as input to the marine predator algorithm for feature selection. The selected features are finally used to train a knearest neighbor(KNN)classifier which classifies the images into four categories.The various stages of the proposed framework are explained in the following sections.
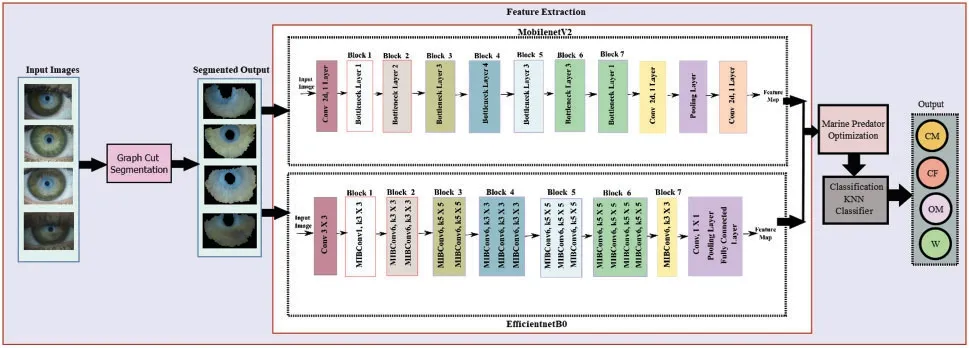
Figure 1: Architecture of the proposed DL framework for the classification lipid tear film patterns.From the input image,the ROI is initially segmented followed by feature extraction and prediction
4.1 Segmentation
The segmentation of ROI in the tearscopic images is accomplished using the graph cut technique[14,15]. The tear film area is effectively segmented out from the remaining anatomical structures present in an image. The segmentation procedure involves the generation of a network flow graph based on the input image. The image is represented as a graph structure with each pixels forming a vertex or node.Each pixel is connected by edges weighted by the affinity or similarity between its two vertices.The algorithm cuts along weak edges,achieving the delineation of objects in the image.The user needs to specify background and foreground seeds to perform the segmentation of the intended ROI. We used the publicly available graph cut implementation in the MATLAB Image Segmenter2https://tinyurl.com/2p89v8k6.application to segment the ROI present in a given image. Fig.2 shows few sample images and their corresponding segmented counterpart.
4.2 Feature Extraction
The proposed model utilizes two light weight pre-trained mobile CNNs, MobilenetV2 [13] and EfficientnetB0[12]for feature extraction.Mobile CNNs are having fewer parameters and are faster than the conventional CNNs.Deployment of networks in mobile devices is possible with light weight CNNs[16].Both the models accept images of size 224×224×3 as input.MobilenetV2 uses depthwise separable convolutions as its basic building block.In addition,the network uses linear bottleneck between layers to remove nonlinearities. Shortcut connections are used between the bottlenecks to provide faster training and improve performance.
EfficientnetB0 developed by Tan et al. [12] has the mobile inverted bottleneck as its main building block. The model used a compound scaling method which balances network width, depth and resolution for better performance. Both the CNNs were pre-trained on Imagenet database [17]which has images belonging to 1000 different classes.1000 features were extracted from the last fully connected layer of each CNNs.The concatenated feature set consisting of 2000 features is passed to nature inspired marine predator algorithm for feature selection.
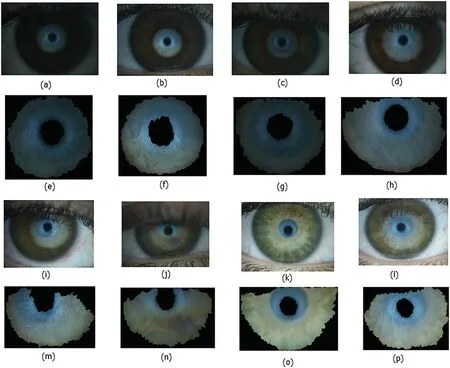
Figure 2: Sample images obtained from the VARPA datasets and their corresponding ROI images extracted using graph-cut technique. The first and third row corresponds to the raw sample images obtained from V_l1 and V_L datasets,respectively.Similarly,the second and fourth row corresponds to the extracted ROI images using the graph-cut technique.(a,e,i,m)represent Closed Mesh-work,(b,f,j,n)Color Fringe,(c,g,k,o)Open Mesh-work and(d,h,l,p)Wave tear film pattern images
4.3 Feature Selection
The selection of relevant features is done using an optimization technique namely, Marine Predator Algorithm(MPA)[18].Among the marine predators and prey,the predators use the major strategy called the Brownian and Levy random movement in foraging.This technique is adopted in MPA.Similar to most of the metaheuristics,MPA is a population based method,in which the initial solution is uniformly distributed over the search space as the first trial[18].A set ofnmembers of the prey is selected to be the initial population.The upper and the lower bound in the solution space is calculated using the following equation.

4.3.1 High-Velocity Ratio
This phase is where the velocity of the prey is greater than that of the predator [18]. At each iteration in this phase,Pis updated as follows:


4.3.2 Unit Velocity Ratio
In this phase,both predator and prey have the same velocity.This phase includes both exploration(Predator)and exploitation(Prey)[18].The rule used in this phase is that when the velocity is unity,the prey moves following the Levy strategy and the predator moves using the Brownian strategy.The mathematical representation of the rule is as follows:


4.3.3 Low-Velocity Ratio
In this phase,the predator is moving faster than the prey and is associated with high exploitation capability [18]. In this phase, the predator follows Levy strategy while the prey is moving in either Brownian or Levy.The updation is as follows:


4.4 Classification Using KNN
The k-nearest neighbor(KNN)classifier has been extensively used in the classification of biomedical data. Classification is carried out by comparing a given test data with training data of similar nature.The training samples are defined bynattributes and each sample represents a point in an ndimensional space.The KNN classifies an unknown samplex0,by searching for thektraining samples that are the closest to the unknown samplex0[19].Thesektraining samples represent theknearest neighbours ofx0. The new sample will be assigned the most frequent class label associated with thek-nearest neighbours.Closeness of the unknown samplex0with training instances is determined using the Euclidean distance metric[19].Euclidean distance for computing the distance ofkneighbours is evaluated as

whereNjandMjrepresent specific attribute in a given sample and j represents a variable from 1 toFwhereFis the number of used attributes[20].The value ofkis set empirically(k=3)in the proposed method.
5 Results and Discussion
The main objective of our work is to develop a general-purpose technique that can be tweaked and used in a variety of contexts.Despite the fact that our technique is similar to a number of existing deep learning classification techniques,we focus on reducing computational complexity and memory space requirements by using lightweight CNN frameworks,which could also result in improved classification efficiency.Our goal is to propose a method for accurately classifying lipid layer patterns while lowering the amount of computational operations (such as convolution, pooling, batch normalisation, and activations) and the amount of memory required to run the system-two key factors affecting the computational complexity of deep learning-based systems.A framework that produces positive results along these lines can be adapted for a range of scenarios, including deployment in mobile devices.Further exploration of the current approach in each context,however,was deemed outside the scope of the current study.
The experiments were performed on a 6 GB GPU machine with Intel Core i7 CPU,16 GB RAM and NVidia GTX 1060, using MATLAB software.For the performance evaluation of the proposed pipeline we computed accuracy,precision,recall,F1-score,and kappa score.
To perform the experiments, we randomly partitioned the data into two folds, each containing 50% of the data for training and validation. The proposed model comprising of EfficientnetB0,MobilenetV2, Marine predator feature optimization and KNN classifier showed an accuracy of 98.08% and 98.15% in datasets V_l1 and V_L, respectively. The confusion matrix and the various performance measures are displayed in Fig.3 and Table 2,respectively.

Figure 3:(a)Confusion Matrix corresponding to dataset V_l1,(b)Confusion Matrix corresponding to dataset V_L
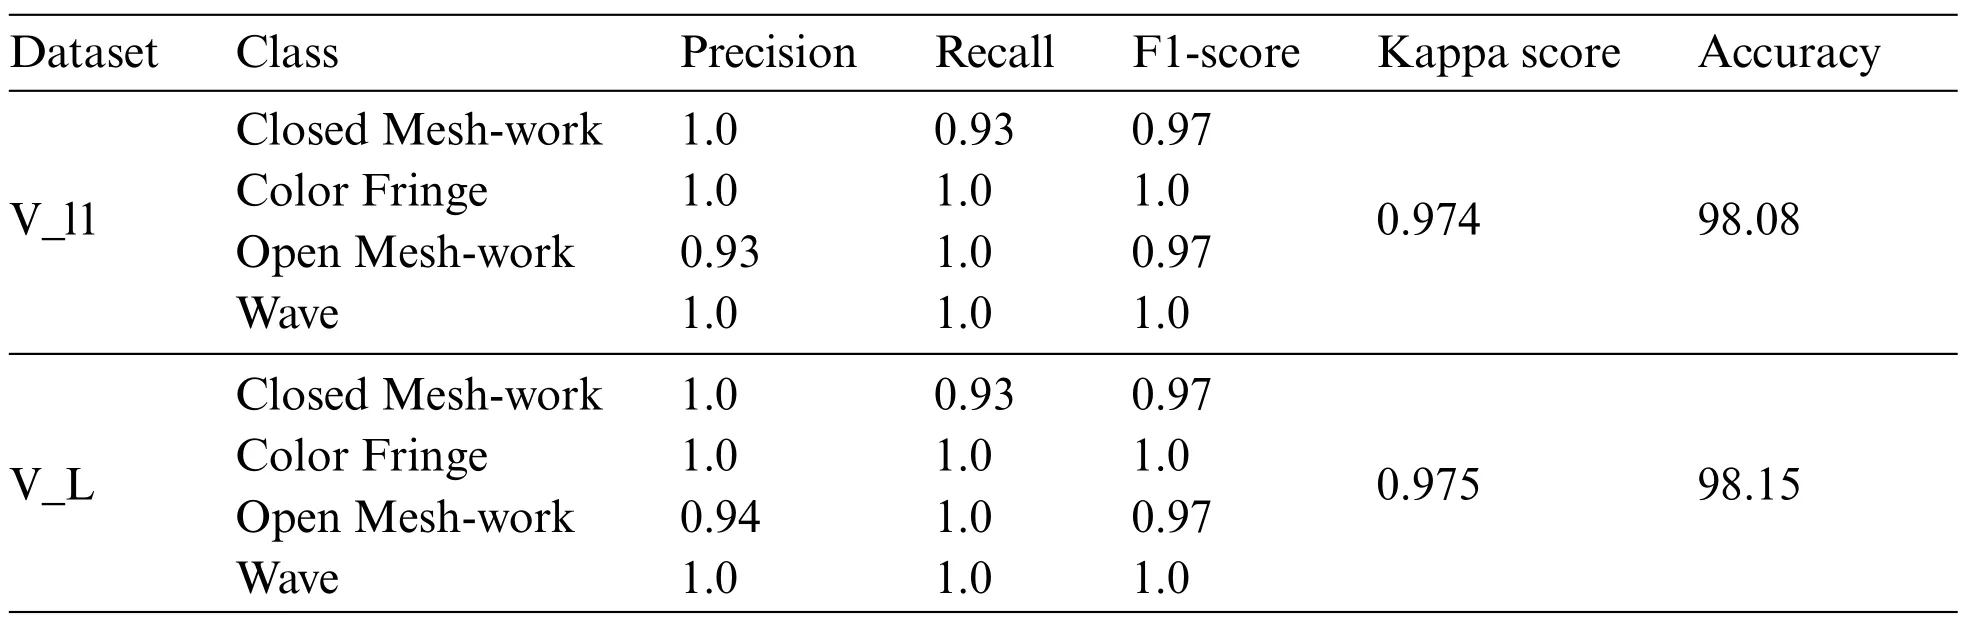
Table 2: The optimum performance obtained for the proposed pipeline. The result obtained for the framework composed of MobilenetV2,EfficientnetB0,marine predator algorithm and KNN classifier
The proposed architecture is selected based on the extensive experiments conducted on the VARPA data sets.In the following,the performance evaluation metrics of the different experiments are shown,which underlines the effectiveness of the proposed pipeline.
5.1 Comparison of Results Achieved Using Various CNNs
In the proposed study,instead of using traditional CNN frameworks we used light weight CNNs for feature extraction.The use of light weight CNN reduces both the computational complexity as well as model parameters of the proposed system. The combination of EfficientnetB0 and MobilenetV2 was selected based on experimental analysis using various light CNNs. First, we performed experiments using 4 different light-weight CNNs(MobilenetV2,EfficientnetB0,Shufflenet,NasnetMobile).The best performing CNNs were MobilenetV2 and EfficientnetB0. Then we combined features extracted using MobilenetV2 and EfficientnetB0. The combination of features from MobilenetV2 and EfficientnetB0 showed an improvement over the performance of various CNNs when used individually.
The experiments were performed using the V_l1 and V_L dataset. The results achieved using various pretrained CNNs are shown in Table 3. Fig.4 shows the comparison of accuracy achieved using various pre-trained CNNs in both datasets.
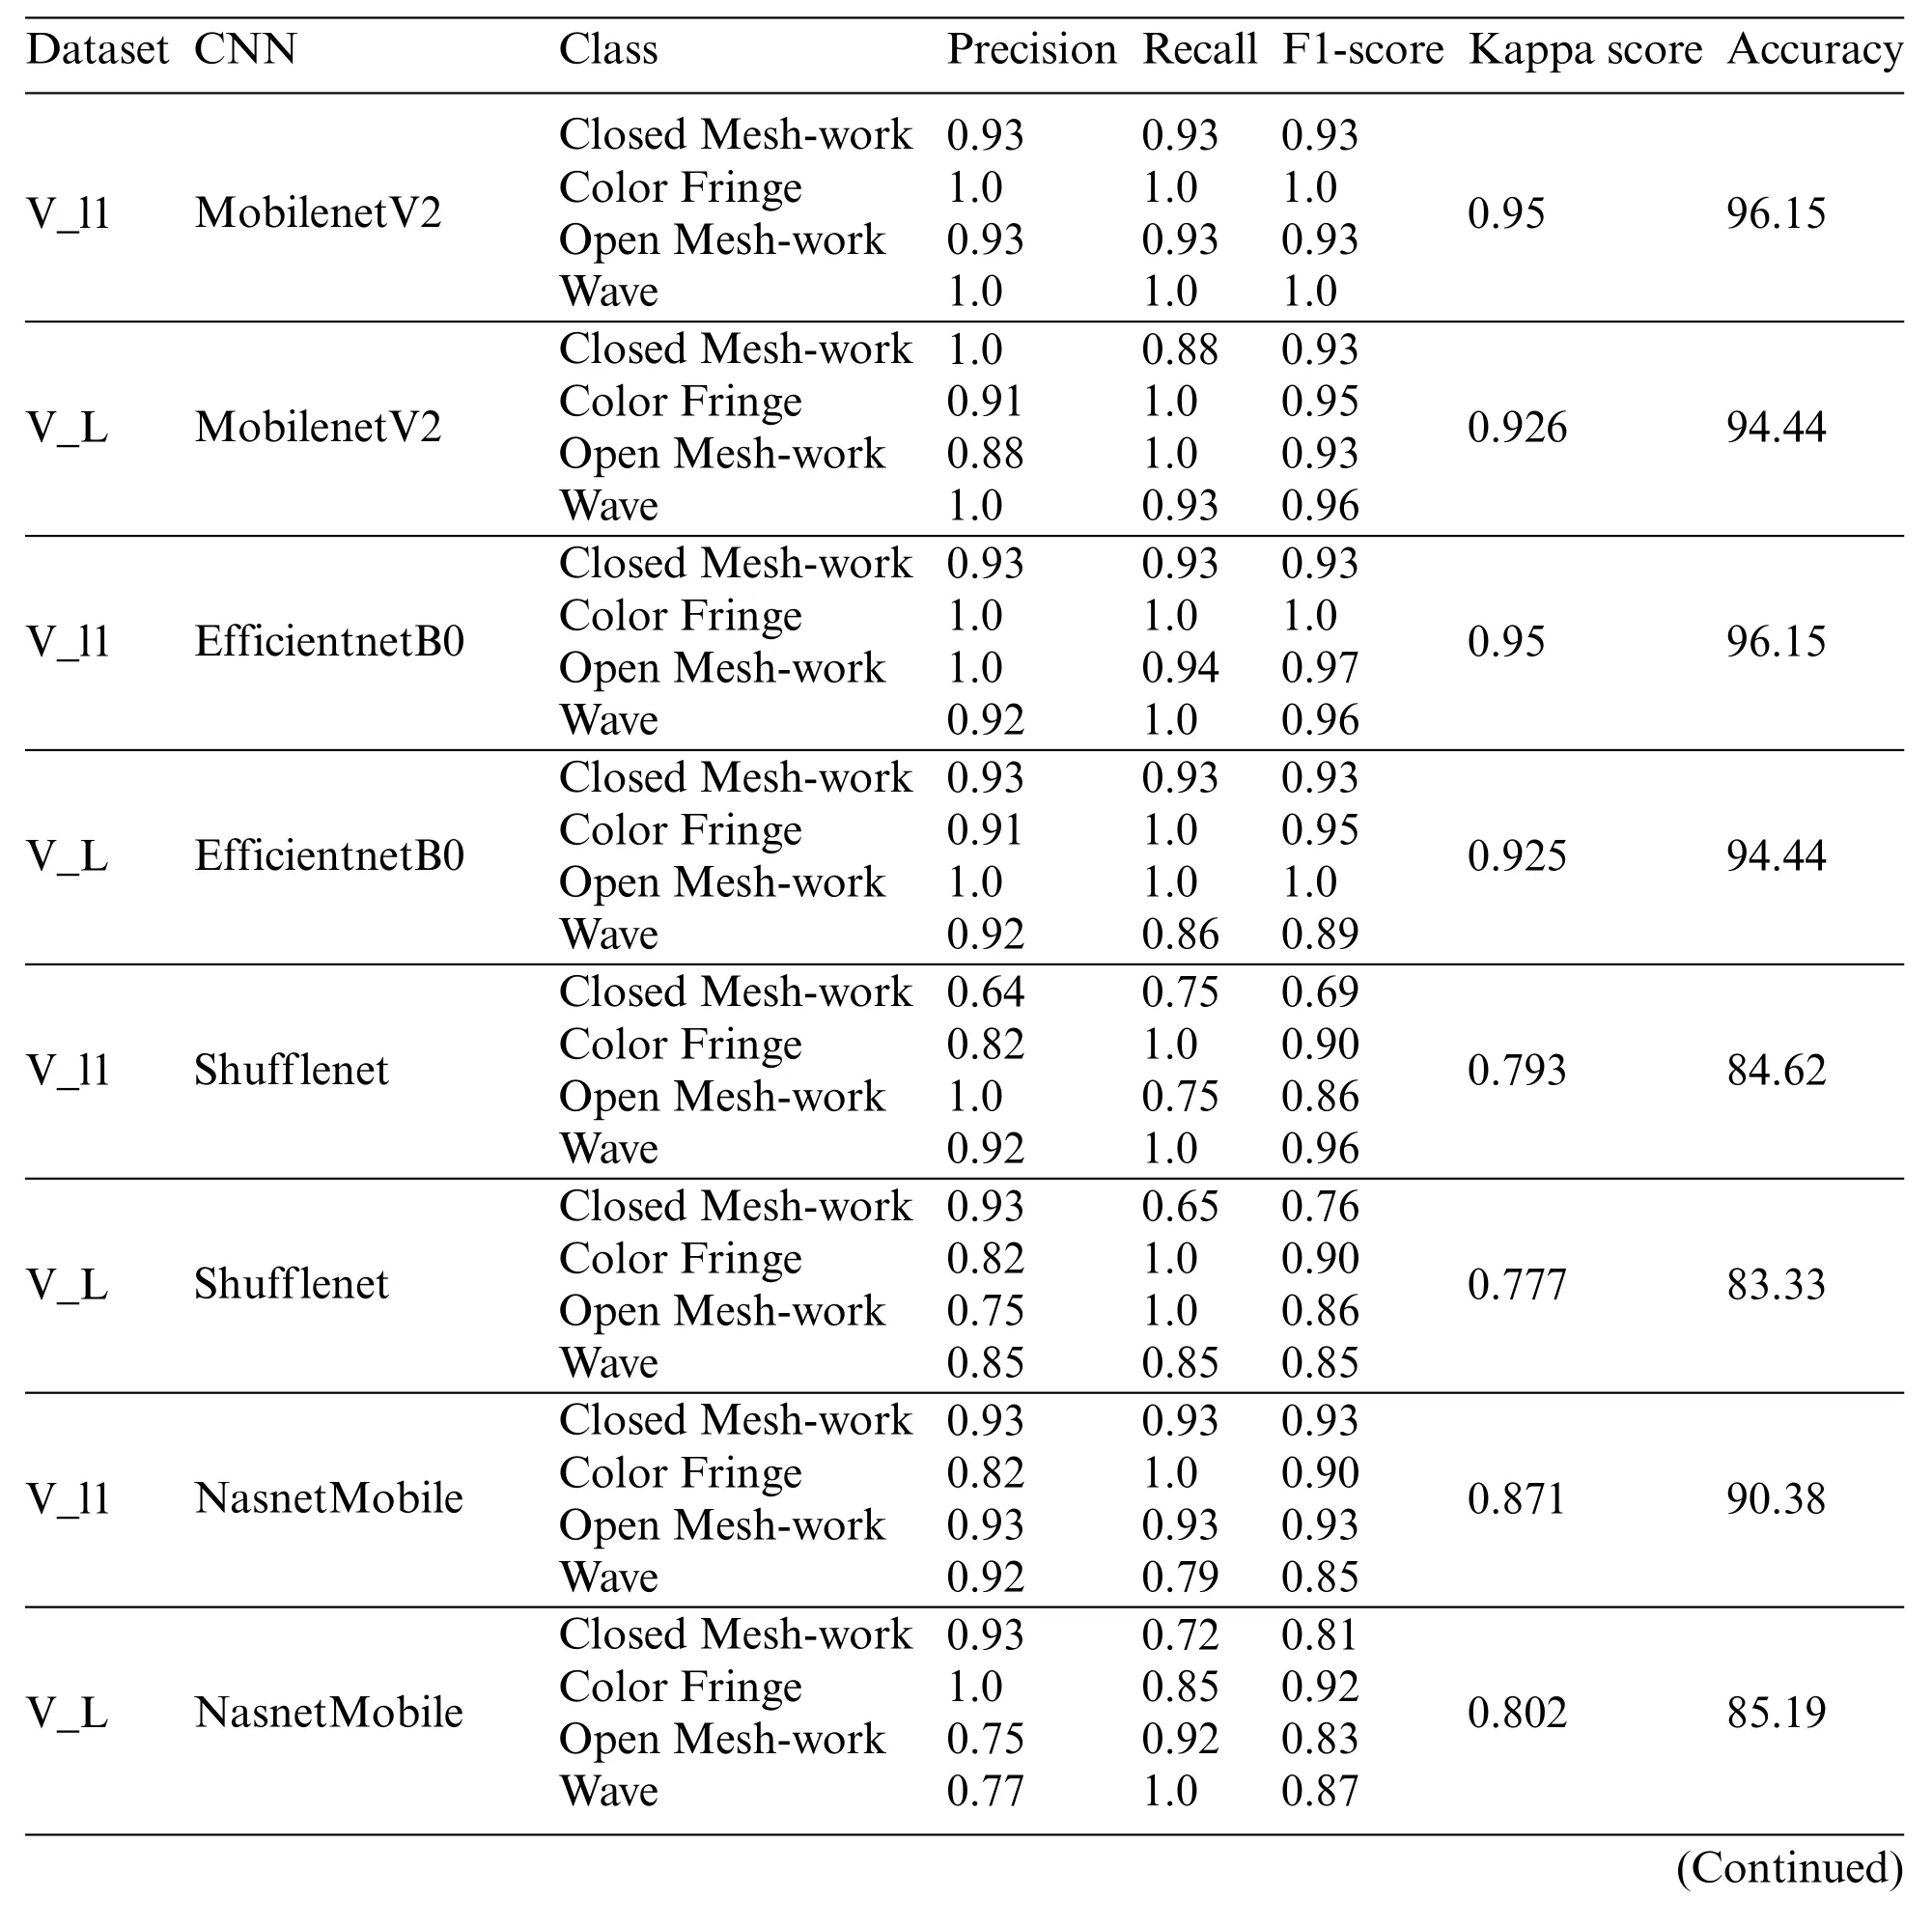
Table 3: Result of the proposed pipeline using various CNNs
Table 3 (continued)Dataset CNN Class Precision Recall F1-score Kappa score Accuracy V_l1 MobilenetV2+EfficientnetB0 Closed Mesh-work 1.0 0.93 0.97 0.974 98.08 Color Fringe 1.0 1.0 1.0 Open Mesh-work 0.93 1.0 0.97 Wave 1.0 1.0 1.0 V_L MobilenetV2+EfficientnetB0 Closed Mesh-work 1.0 0.93 0.97 0.975 98.15 Color Fringe 1.0 1.0 1.0 Open Mesh-work 0.94 1.0 0.97 Wave 1.0 1.0 1.0
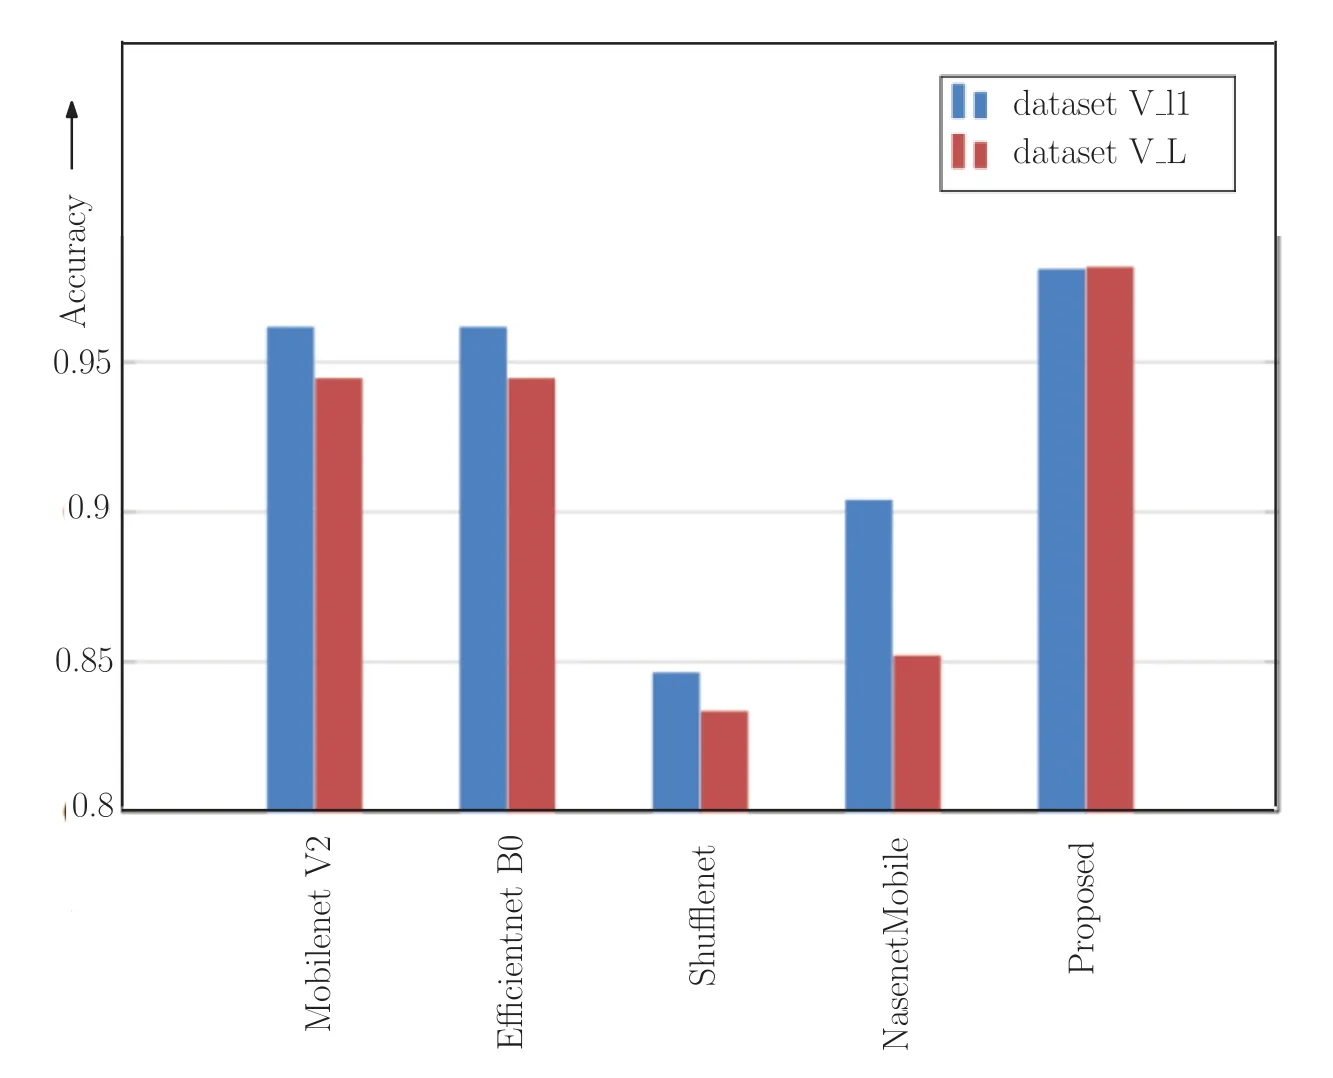
Figure 4: Comparison of accuracy achieved using various pre-trained CNNs in dataset V_l1 and dataset V_L
The proposed network has an improvement in accuracy of about 2%in V_l1 data set and 4%in V_L data set. Similar improvement can be seen in all other performance metric we considered. The importance of an accurate diagnosis cannot be underestimated,because diagnostic errors cause delays and mistakes in treatment that can be fatal.An accurate diagnosis is critical to prevent wasting precious time on the wrong course of treatment.
5.2 Comparison of Results Achieved Using Various Feature Selection Methods
A set of experiments were also conducted to evaluate the performance of the marine predator feature selection algorithm.The results suggest that the proposed MPA-KNN strategy is capable of selecting the most relevant and optimal characteristics.It outperformed the well-known metaheuristic algorithms we put to the test. The performance of five commonly used optimization algorithms for feature selection, namely Particle Swarm Optimization (PSO), Cuckoo Search Algorithm (CS),Artificial Butterfly Optimization (ABO) and Harmony Search (HS) were compared against MPA.Table 4 and Fig.5 illustrate the performance of various feature selection techniques in combination with the proposed multi-CNN and KNN classifier.The results achieved using MPA outperform other techniques in both the datasets.
Table 4: Results achieved using various feature selection methods
Table 4 (continued)Dataset Feature selection Class Precision Recall F1-score Kappa score Accuracy V_L ABO Closed Mesh-work 0.93 0.81 0.87 0.876 90.74 Color Fringe 0.91 1.0 0.95 Open Mesh-work 0.88 1.0 0.93 Wave 0.92 0.86 0.89 V_l1 HS Closed Mesh-work 0.93 0.93 0.93 0.948 96.15 Color Fringe 1.0 1.0 1.0 Open Mesh-work 0.93 0.93 0.93 Wave 1.0 1.0 1.0 V_L HS Closed Mesh-work 1.0 0.88 0.93 0.95 96.3 Color Fringe 1.0 1.0 1.0 Open Mesh-work 0.94 1.0 0.97 Wave 0.92 1.0 0.96

Figure 5:Comparison of accuracy achieved using various feature selection techniques in dataset V_l1 and dataset V_L
5.3 Analysis of Computational Complexity
Table 5a shows the computational time taken for feature extraction followed by feature selection and classification (in seconds) in each of the networks. Even though the results achieved using the proposed network is better,computational time is higher than the other networks.Table 5b provides the execution time taken by various feature selection techniques.All the techniques except ACO took a very less amount of time for feature selection.
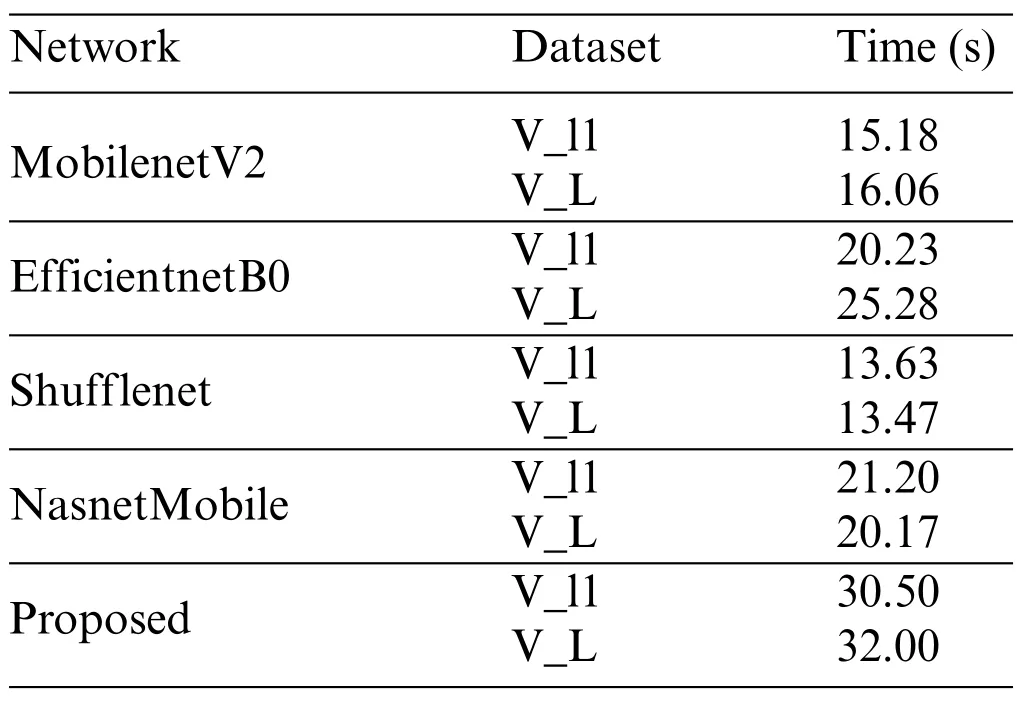
Table 5a: Execution time using various networks
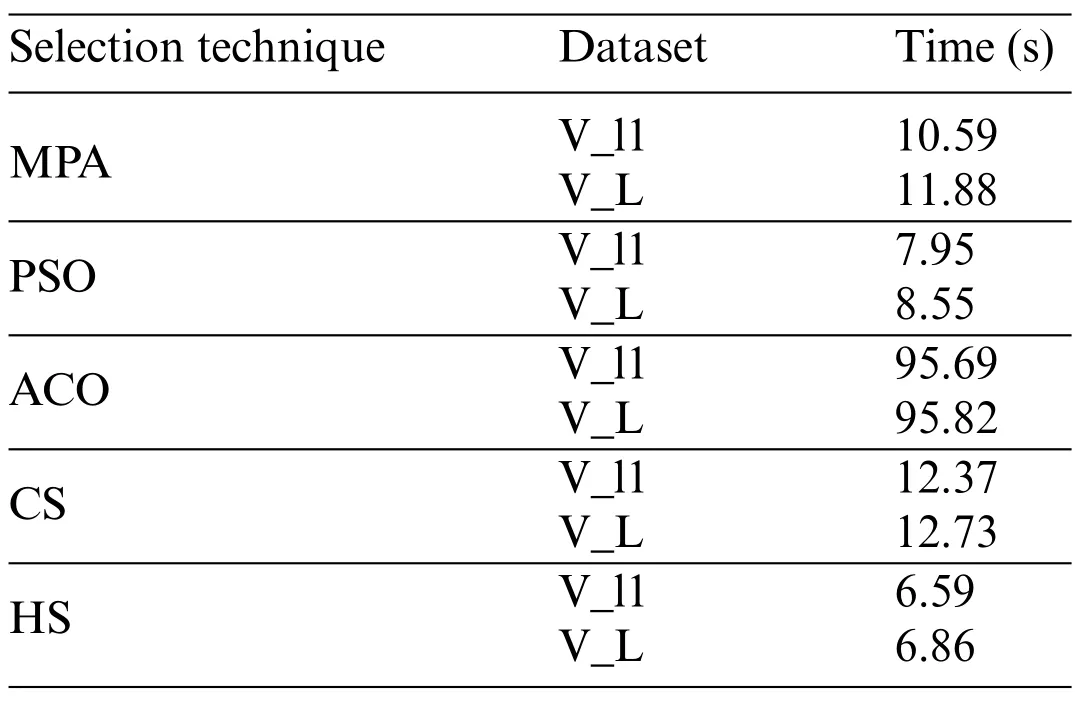
Table 5b: Execution time using various feature selection techniques
The proposed framework is a combination of two lightweight CNNs,namely MobilenetV2 and EfficientnetB0.Hence,it is obvious that the feature vector size is classified as having a large dimension as it contains the features derived using the two lightweight CNNs. With regard to processing time,the light weight CNNs execution time is better when used singly than in combination.It is worth to note that, even when used in combination, the execution time is only 30.50 s and 32 s, respectively for the datasets V_l1 and V_L,which is a significantly shorter time when considered for real medical applications.
5.4 Comparison of Results Achieved Using Various Classifiers
Next set of experiments was conducted to evaluate the performance of KNN against other classifiers.WEKA tool was used for the classification using Naive Bayes(NB),Bayesnet,SVM and Random Forest(RF).Features selected using MPA were passed to the classifiers.Default parameters in WEKA were used for the classification.The results of the classification are displayed in Table 6 and Fig.6.The results show the superior performance of the KNN classifier.
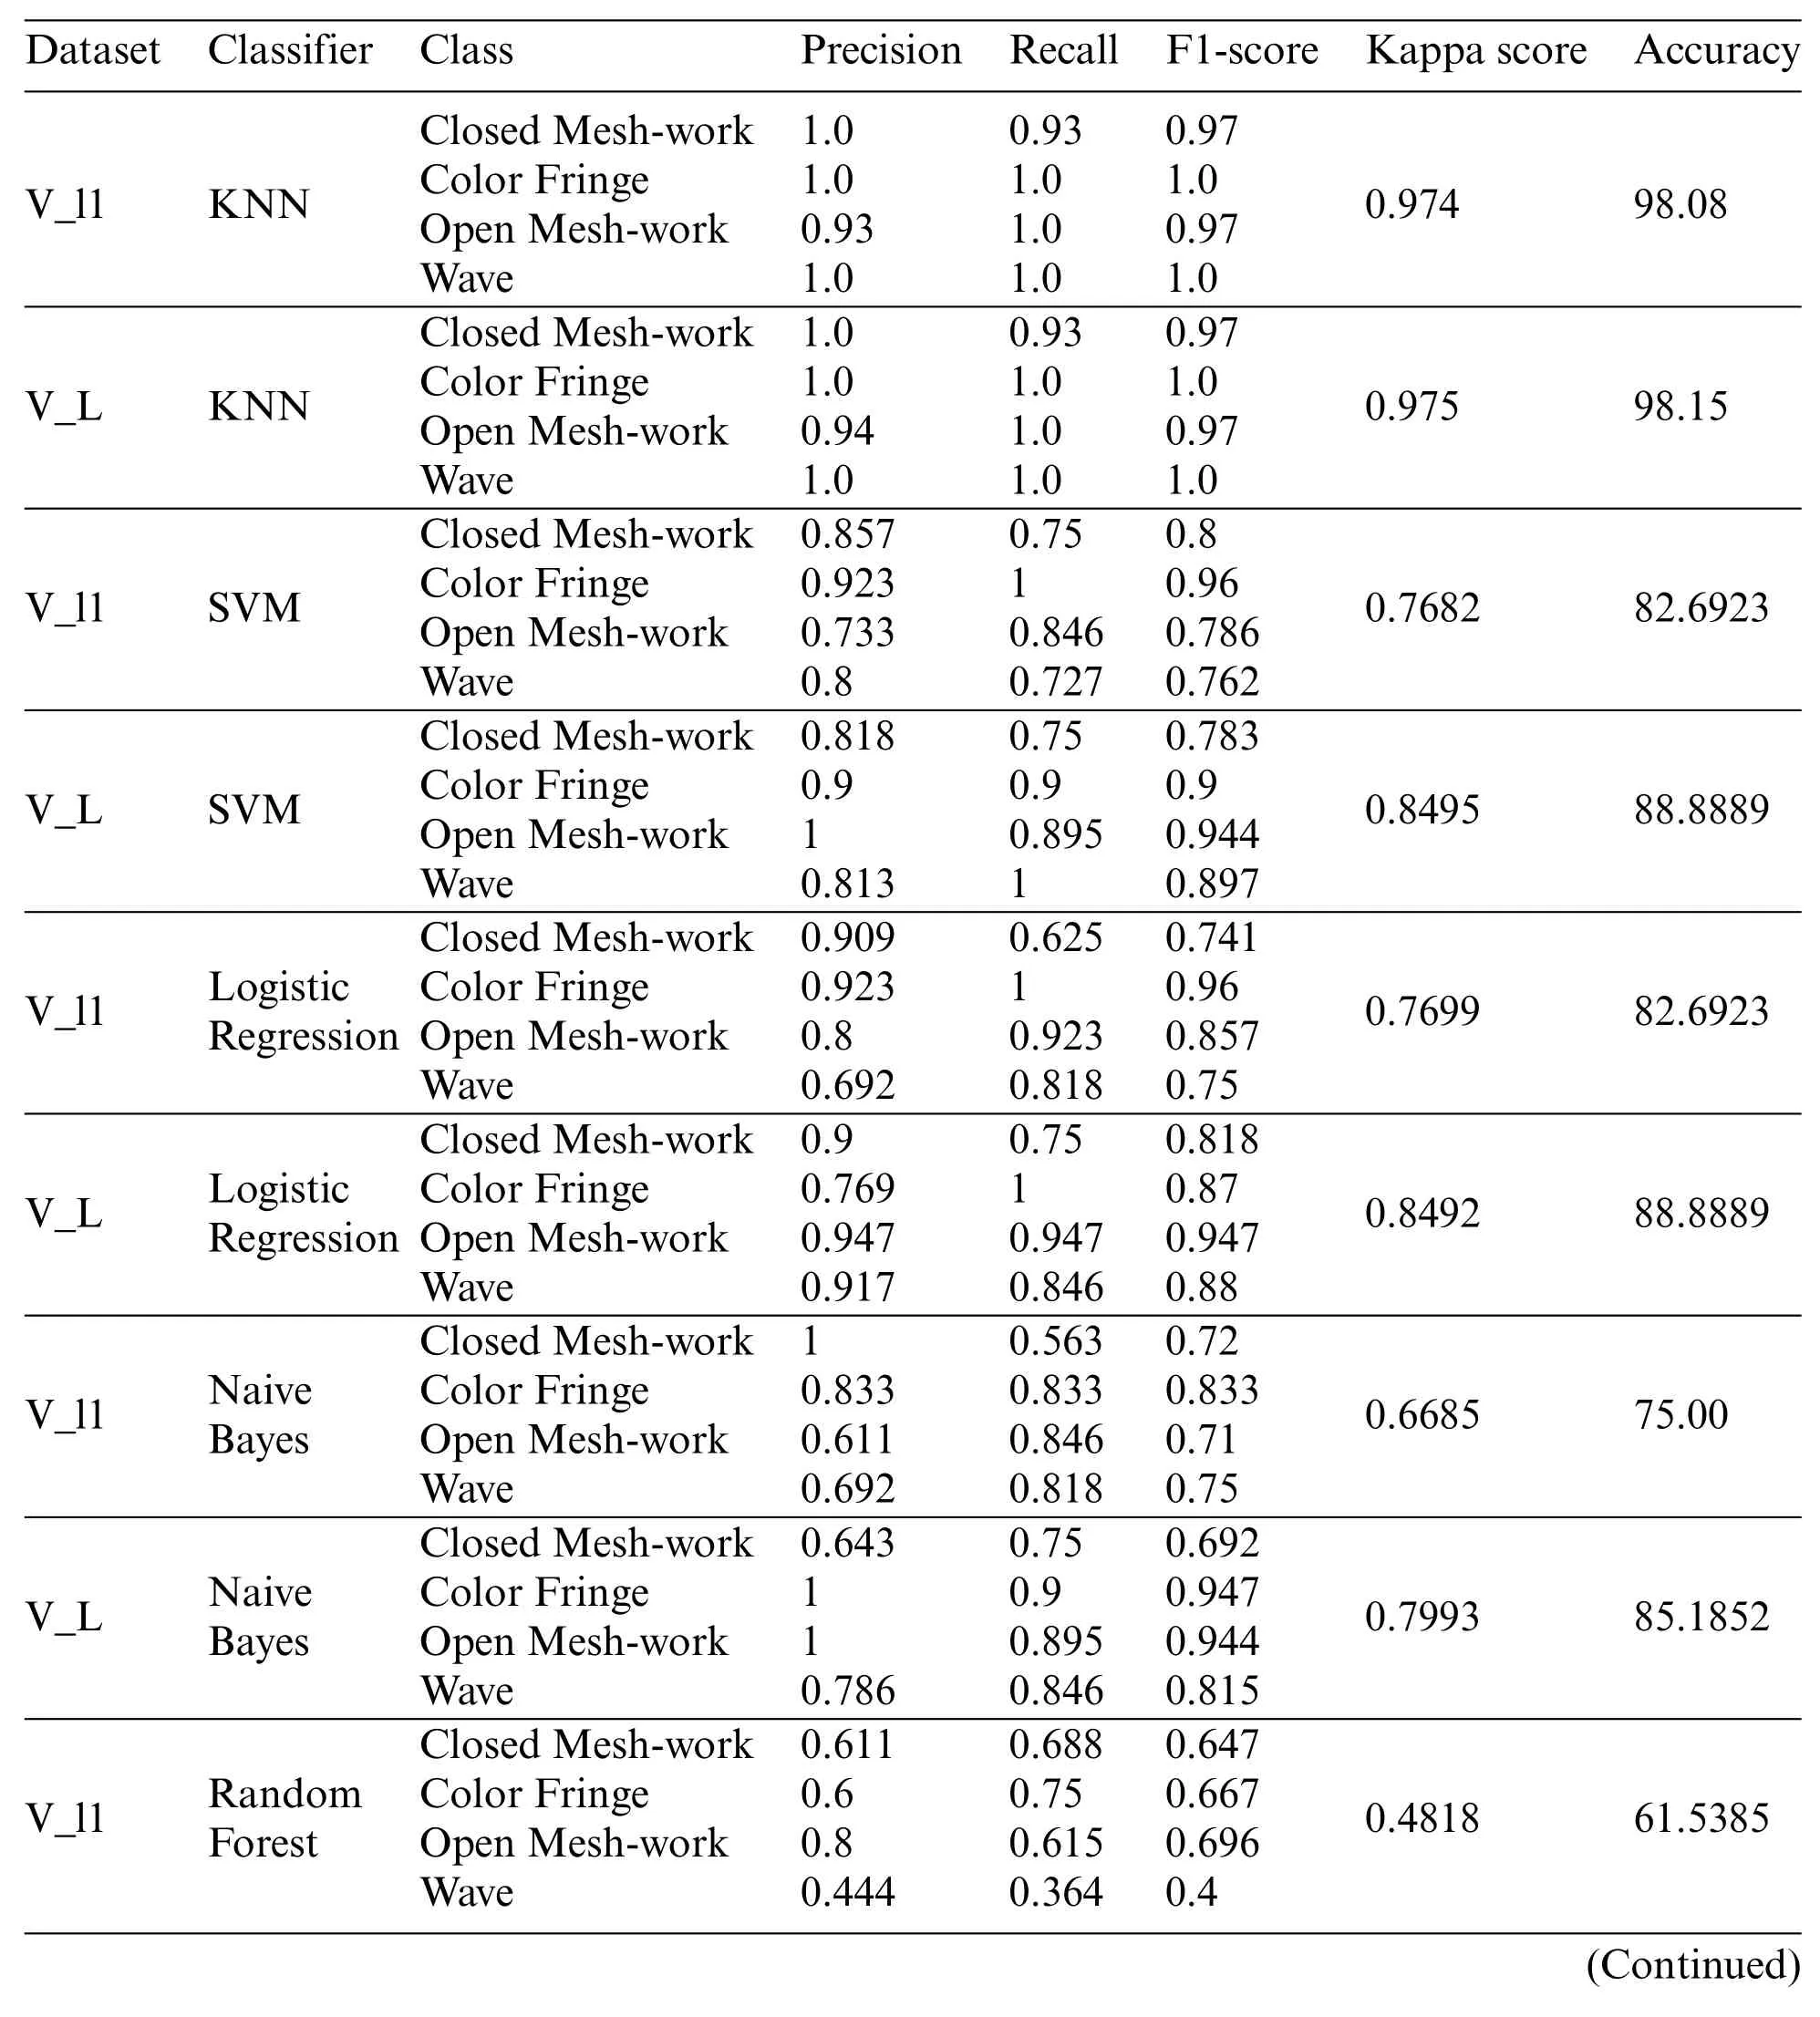
Table 6: Analysis of performance of various classifiers
Table 6 (continued)Dataset Classifier Class Precision Recall F1-score Kappa score Accuracy V_L Random Forest Closed Mesh-work 0.833 0.833 0.833 0.7025 77.7778 Color Fringe 0.75 0.9 0.818 Open Mesh-work 0.929 0.684 0.788 Wave 0.625 0.769 0.69
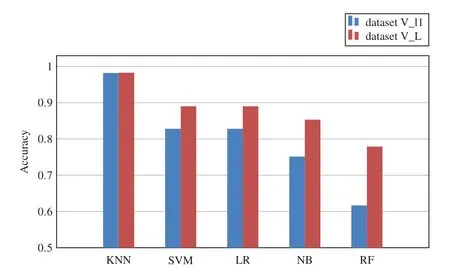
Figure 6:Comparison of accuracy achieved using various classifiers in dataset V_l1 and dataset V_L
5.5 Analysis of the Impact of ROI Segmentation
In addition to the experiments performed using various CNN frameworks and feature selection techniques,we also checked the effect of ROI-segmentation on the performance evaluation.Initially,the images were applied directly to the proposed network architecture without performing the segmentation of ROI.In the second step,using graph-based segmentation,ROI is extracted from the raw images and passed to the network.The experiments show that the best results are obtained for ROI based analysis.Table 7 and Fig.7 illustrate the impact of segmentation on the model’s performance.
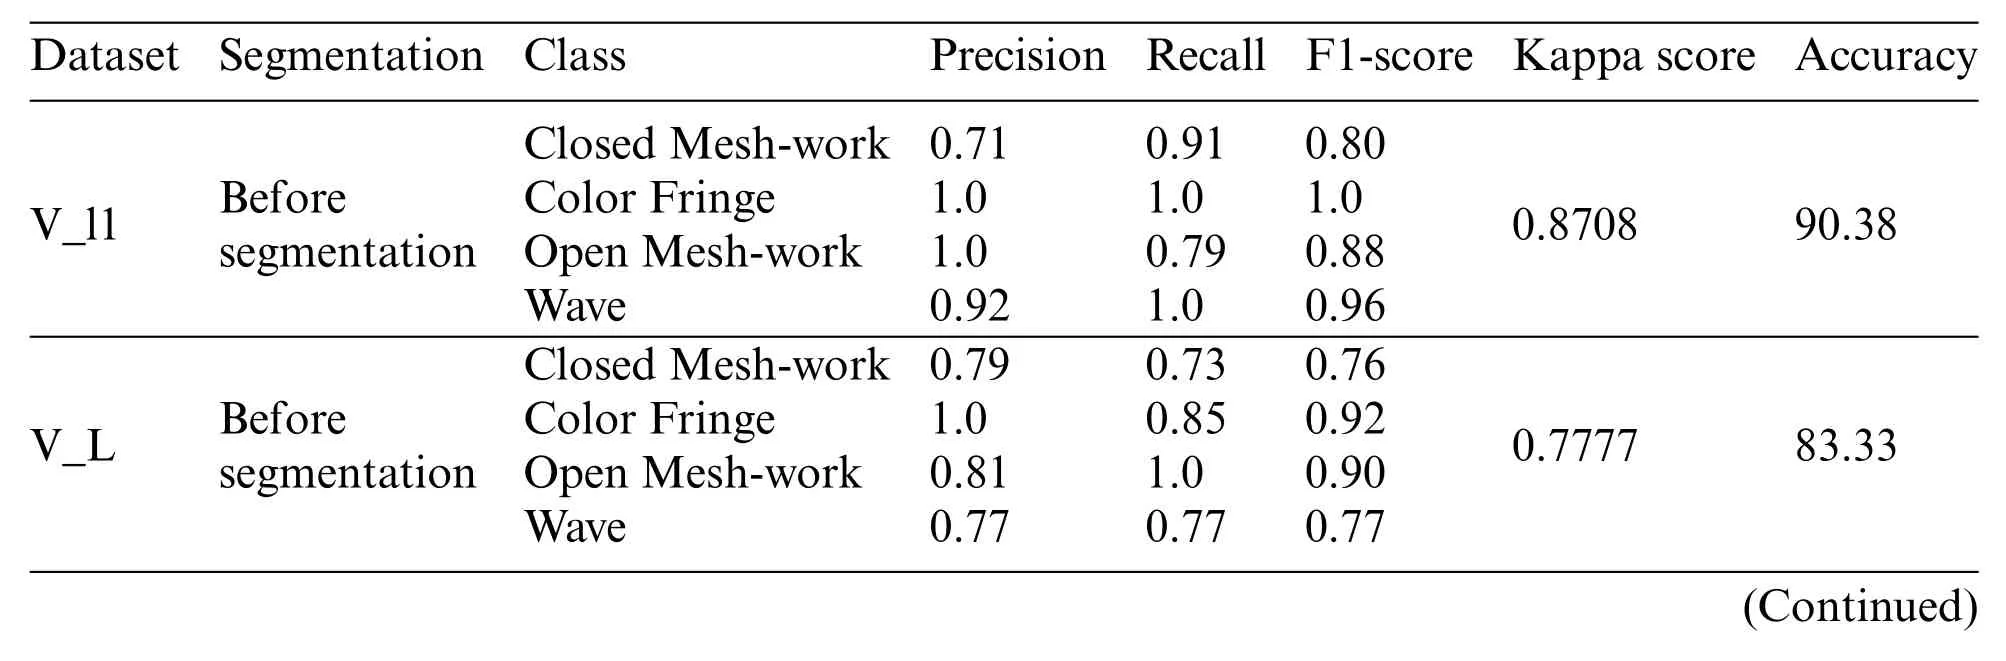
Table 7: Analysis of performance of the model after graph cut segmentation
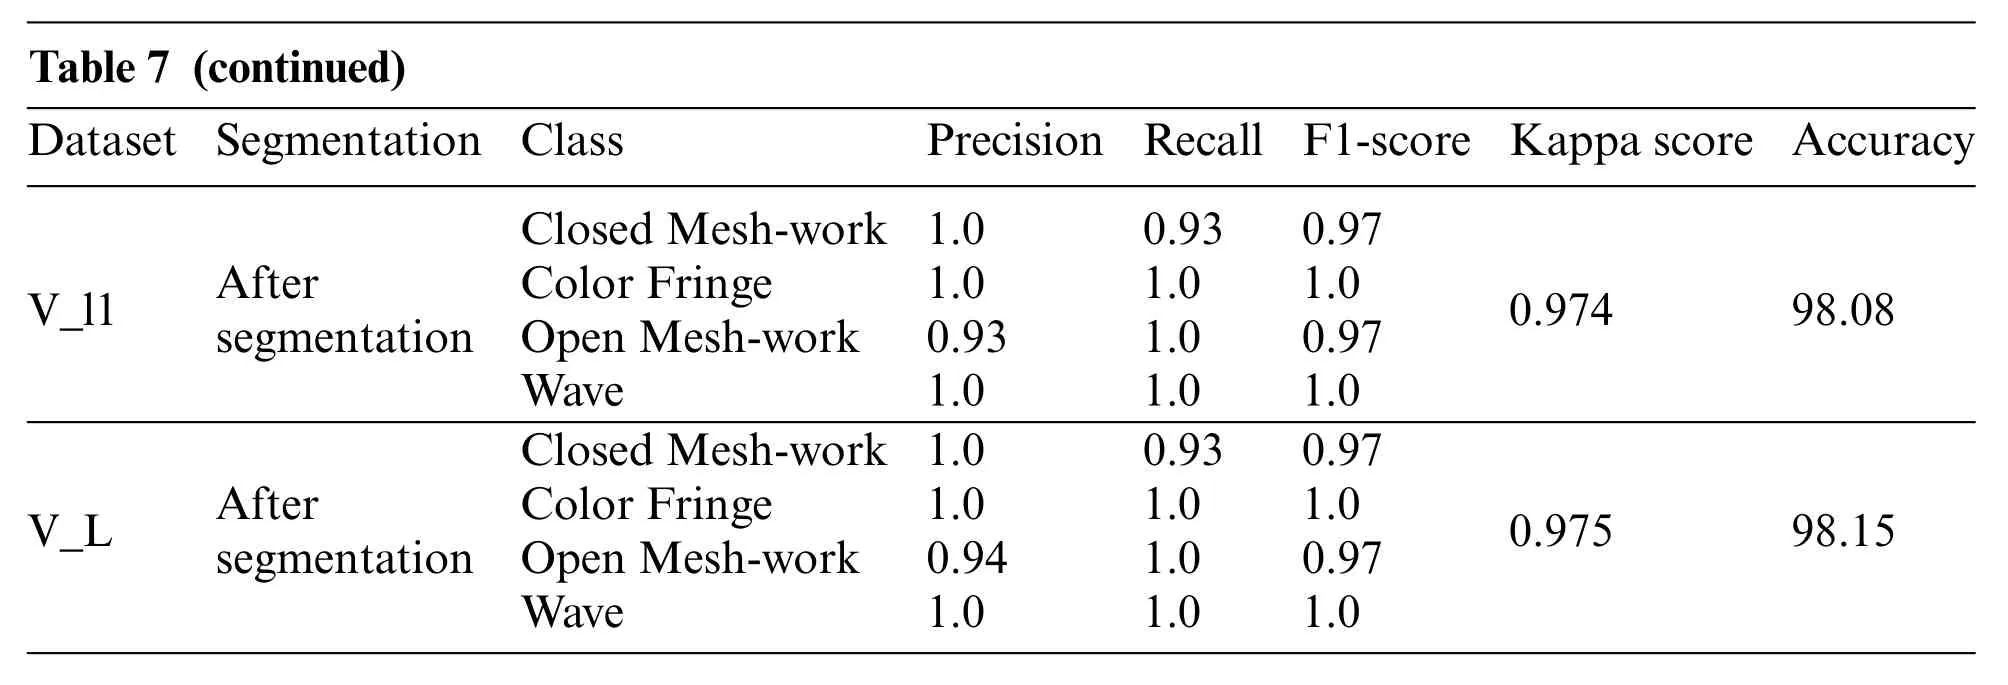
Table 7 (continued)Dataset Segmentation Class Precision Recall F1-score Kappa score Accuracy V_l1 After segmentation Closed Mesh-work 1.0 0.93 0.97 0.974 98.08 Color Fringe 1.0 1.0 1.0 Open Mesh-work 0.93 1.0 0.97 Wave 1.0 1.0 1.0 V_L After segmentation Closed Mesh-work 1.0 0.93 0.97 0.975 98.15 Color Fringe 1.0 1.0 1.0 Open Mesh-work 0.94 1.0 0.97 Wave 1.0 1.0 1.0
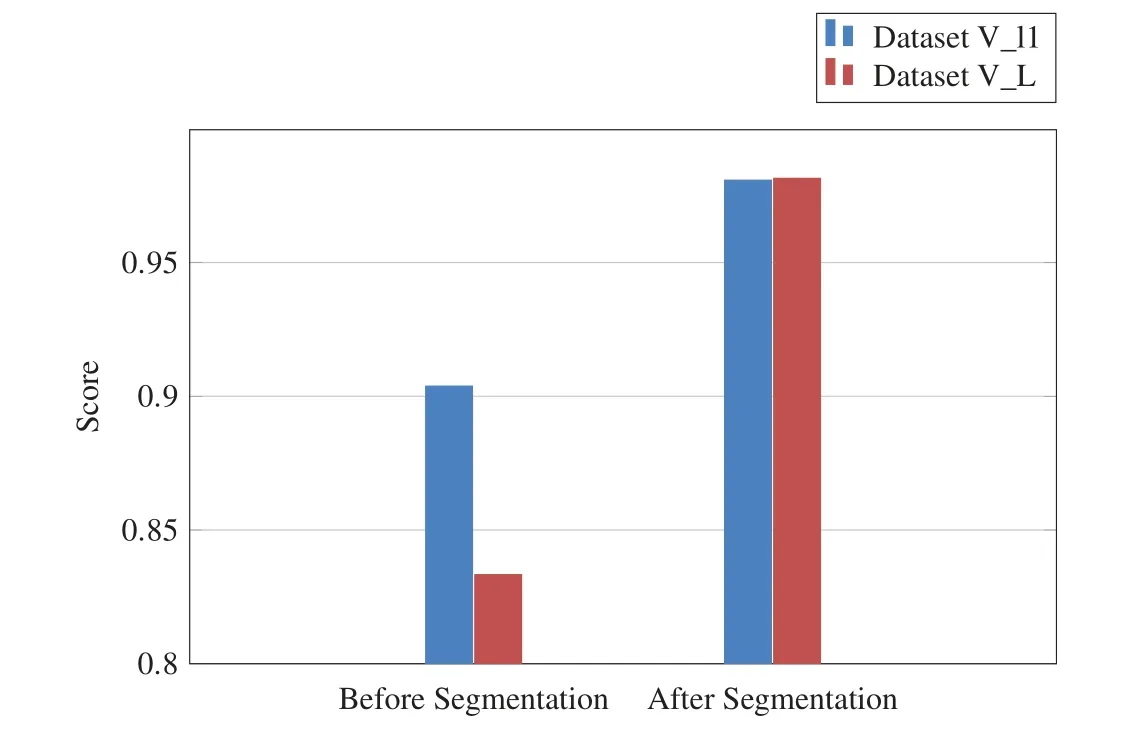
Figure 7:Analysis of the effect of segmentation on the model’s performance
5.6 Comparison with State-of-the-Art Methods
Table 8 shows the performance comparison of the proposed method with that of the state-of-theart methods.The method achieved superior performance than all other methods except[10].However,the results reported in[10]are solely based on the model’s performance in dataset V_l1 whereas,the proposed pipeline achieved promising results in both datasets.
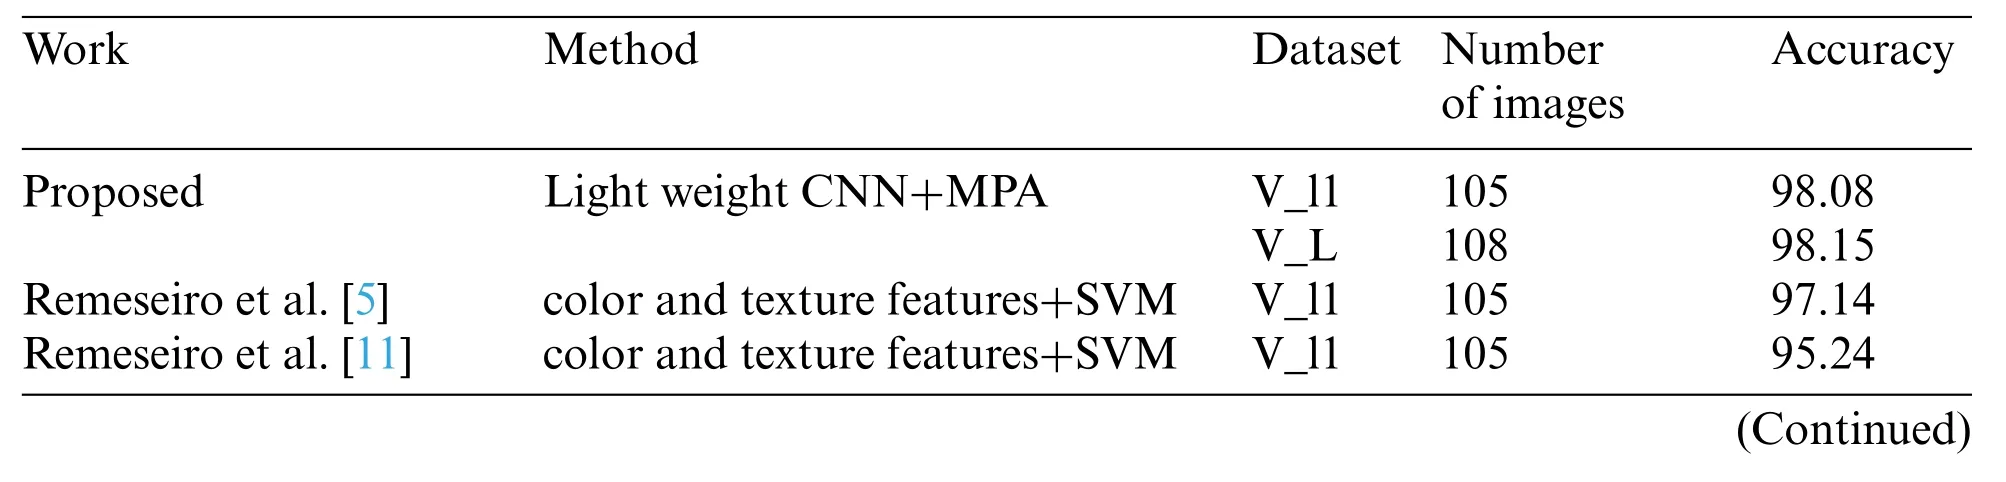
Table 8: Comparison of results with state-of-the-art methods

Table 8 (continued)Work Method Dataset Number of images Accuracy Ramos et al.[21] color and texture features+SVM V_l1 105 91.43 Bolón-Canedo et al.[22] color and texture features+ReliefF+SVM V_l1 105 92.00 Remeseiro et al.[10] color and texture features+PCA+SVM V_l1 105 98.10 Peteiro-Barral et al.[23] MCDM+Rank Correlation V_l1 105 96.00 Remeseiro et al.[24] color and texture features+feature selection+SVM V_l1 105 94.29 color and texture features+feature selection+SVM V_L 108 91.67
5.7 Limitations and Future Scope
The major hindrance in DES research is the non-availability of standard datasets for checking the developed algorithms.Even though the proposed method achieved promising results,the number of images available in the dataset was less.Hence,to ensure robustness of the method,the proposed algorithm needs to be tested in larger datasets.Another limitation of the study is the non-inclusion of Amorphous images in the classification framework. It is worth noting that the Amorphous class of images rarely occurs while diagnosing,and hence,similar research works also avoid the classification of the Amorphous category of images.
The proposed architecture employs pre-trained CNNs,trained using non-medical images for the classification of lipid layer patterns.As a future work,we propose to compile a dry eye disease dataset sufficiently larger to train a CNN from scratch. A custom-made CNN trained using a larger dryeye disease dataset could provide better results.Deployment of the network in mobile devices is also planned as a future work.
6 Conclusion
The study described in this paper presents a novel method integrating deep learning with nature inspired feature selection techniques for the diagnosis of dry eye syndrome.Among the various pretrained CNNs,and nature inspired feature selection techniques,the combination of MobilenetV2 and EfficientnetB0 with the Marine Predator algorithm demonstrated the best performance.The proposed method achieved promising results in the experimented datasets.Even though the method produced significant results,empirical studies on larger datasets are required for confirming the robustness of the proposed technique.The method can be used as a computer-aided tool for assisting clinicians after more trials.
Funding Statement:The authors received no specific funding for this study.
Conflicts of Interest:The authors declare that they have no conflicts of interest to report regarding the present study.
 Computer Modeling In Engineering&Sciences2023年7期
- Computer Modeling In Engineering&Sciences的其它文章
- Edge Intelligence with Distributed Processing of DNNs:A Survey
- Turbulent Kinetic Energy of Flow during Inhale and Exhale to Characterize the Severity of Obstructive Sleep Apnea Patient
- The Effects of the Particle Size Ratio on the Behaviors of Binary Granular Materials
- Implementation of Rapid Code Transformation Process Using Deep Learning Approaches
- A New Hybrid Hierarchical Parallel Algorithm to Enhance the Performance of Large-Scale Structural Analysis Based on Heterogeneous Multicore Clusters
- Topic Controlled Steganography via Graph-to-Text Generation