
A candidate protective factor in amyotrophic lateral sclerosis: heterogenous nuclear ribonucleoprotein G
2023-02-24 05:24FangYangWenZhiChenShiShiJiangXiaoHuaWangRenShiXu
中国神经再生研究(英文版) 2023年7期
Fang Yang ,Wen-Zhi Chen ,Shi-Shi Jiang ,Xiao-Hua Wang,Ren-Shi Xu
Abstract Heterogenous nuclear ribonucleoprotein G is down-regulated in the spinal cord of the Tg(SOD1*G93A)1Gur (TG) amyotrophic lateral sclerosis mouse model.However,most studies have only examined heterogenous nuclear ribonucleoprotein G expression in the amyotrophic lateral sclerosis model and heterogenous nuclear ribonucleoprotein G effects in amyotrophic lateral sclerosis pathogenesis such as in apoptosis are unknown.In this study,we studied the potential mechanism of heterogenous nuclear ribonucleoprotein G in neuronal death in the spinal cord of TG and wild-type mice and examined the mechanism by which heterogenous nuclear ribonucleoprotein G induces apoptosis.Heterogenous nuclear ribonucleoprotein G in spinal cord was analyzed using immunohistochemistry and western blotting,and cell proliferation and proteins (TAR DNA binding protein 43,superoxide dismutase 1,and Bax) were detected by the Cell Counting Kit-8 and western blot analysis in heterogenous nuclear ribonucleoprotein G siRNA-transfected PC12 cells.We analyzed heterogenous nuclear ribonucleoprotein G distribution in spinal cord in the amyotrophic lateral sclerosis model at various time points and the expressions of apoptosis and proliferation-related proteins.Heterogenous nuclear ribonucleoprotein G was mainly localized in neurons.Amyotrophic lateral sclerosis mice were examined at three stages: preonset (60–70 days),onset (90–100 days) and progression (120–130 days).The number of heterogenous nuclear ribonucleoprotein G-positive cells was significantly higher in the anterior horn of the lumbar spinal cord segment of TG mice at the preonset stage than that of control group but lower than that of the control group at the onset stage.The number of heterogenous nuclear ribonucleoprotein G-positive cells in both central canal and surrounding gray matter of the whole spinal cord of TG mice at the onset stage was significantly lower than that in the control group,whereas that of the lumbar spinal cord segment of TG mice was significantly higher than that in the control group at preonset stage and significantly lower than that in the control group at the progression stage.The numbers of heterogenous nuclear ribonucleoprotein G-positive cells in the posterior horn of cervical and thoracic segments of TG mice at preonset and progression stages were significantly lower than those in the control group.The expression of heterogenous nuclear ribonucleoprotein G in the cervical spinal cord segment of TG mice was significantly higher than that in the control group at the preonset stage but significantly lower at the progression stage.The expression of heterogenous nuclear ribonucleoprotein G in the thoracic spinal cord segment of TG mice was significantly increased at the preonset stage,significantly decreased at the onset stage,and significantly increased at the progression stage compared with the control group.heterogenous nuclear ribonucleoprotein G expression in the lumbar spinal cord segment of TG mice was significantly lower than that of the control group at the progression stage.After heterogenous nuclear ribonucleoprotein G gene silencing,PC12 cell survival was lower than that of control cells.Both TAR DNA binding protein 43 and Bax expressions were significantly increased in heterogenous nuclear ribonucleoprotein G-silenced cells compared with control cells.Our study suggests that abnormal distribution and expression of heterogenous nuclear ribonucleoprotein G might play a protective effect in amyotrophic lateral sclerosis development via preventing neuronal death by reducing abnormal TAR DNA binding protein 43 generation in the spinal cord.
Key Words:amyotrophic lateral sclerosis;Bax;heterogenous nuclear ribonucleoprotein G;heterogenous nuclear ribonucleoprotein G-siRNA;neuron death;superoxide dismutase 1;TAR DNA binding protein 43;TG(SOD1*G93A)1Gur mice
Introduction
Amyotrophic lateral sclerosis (ALS) is the most common motor neuron disease.ALS is characterized by damage of both upper and lower motor neurons and manifests as progressive weakness,muscular atrophy,fascicular fibrillation of muscle,and pyramidal tract signs.Most ALS patients die of respiratory paralysis within 3–5 years (Cook and Petrucelli,2019).The currently used drugs only slow disease progression and no drugs are available that can cure ALS.
ALS pathogenesis involves genetic factors,toxicity of excitatory amino acids,oxidative stress damage,damaged axonal transport,defective mitochondrial function,and abnormal aggregation of proteins,which exert synergistic effects on each other during ALS pathogenesis (Van Damme et al.,2017).Additional pathogenic mechanisms of ALS have recently been discovered,including RNA metabolic dysfunction,defective cytoplasmic transport in axons,and disrupted dynamics of ribonucleic acid (RNA) particles and other ribonucleoprotein bodies (Cook and Petrucelli,2019).These pathogenic factors lead to disordered gene transcription,splicing,translation,and other related processes and further damage cells and/or tissues.
The aggregation of abnormal proteins and generation of inclusion bodies are pathological characteristics of several neurodegenerative diseases including ALS.In ALS,cytoplasmic inclusion bodies aggregate in damaged motor neurons and oligodendrocytes in the spinal cord and multiple brain regions,such as the frontal cortex,temporal cortex,hippocampus,and cerebellum(Goutman et al.,2018;Jensen et al.,2022).These features are the most common in spinal motor neurons of ALS.Ubiquiti n-positive inclusion bodies are another sign of ALS pathology and are composed of abnormal proteins encoded by mutant genes,such as superoxide dismutase 1 (SOD1),TAR DNA binding protein 43 (TDP43),fused in sarcoma/translocated in liposarcoma(FUS),optineurin,ubiquilin2,and neurofilament heavy.The abnormal alteration of these proteins and aberrant structure and/or function contribute to inclusion body formation in ALS (Mackenzie et al.,2007;Polymenidou and Cleveland,2017;Trist et al.,2021).
In 1993,the first mutation of SOD1 gene (Rosen et al.,1993) in a patient with familial ALS was found.More than 50 potential ALS genes have been discovered since that time,including chromosome 9 open reading frame 72 (C9orf72),TDP43,FUS,heterologous ribonucleoprotein (hnRNP) A1,sequestosome 1,valosin-containing protein,optineurin,and profilin-1 genes(Maruyama et al.,2016).These genes can be divided into the following categories: genes involved in control of protein stability and expression,genes involved in the function and metabolism of RNA,and genes involved in cytoskeleton dynamics of distal axons of motor neurons.
The RNA-binding protein (RBP) TDP-43,which is normally found in the nucleus of cells in the brain and spinal cord of patients,was detected in the cytoplasm in ALS.Mislocalization of TDP-43 is a characteristic of sporadic ALS and the majority of familial ALS (Gao et al.,2019).The subsequent identification of mutations in ALS-associated proteins (such as FUS and hnRNP A1) that bind to RNA has highlighted the importance of RNA biology in the eti ology of ALS.Given the current rate of the discovery of RNA-binding protein gene mutations in neurodegenerative illnesses,it is evident that disruption of RNA processing and aggregation phagocytosis are key disease processes (Courati er et al.,2017).TDP-43,FUS,C9orf72,hnRNP A1,hnRNP A2/B1,matrin 3,senataxin,elongator subunit 3,ataxin-2,angiotensin,survival motor neuron 1,and survival motor neuron 2 are RNA-binding proteins related to ALS (Perri et al.,2017;Ghasemi and Brown,2018).Genetic variations in TDP-43,FUS,and C9orf72 are also associated with frontotemporal lobe.Many other RNAbinding proteins were found to exhibit altered subcellular distribution in neurons and/or glial cells of ALS patients,but no known mutations causing ALS were identified (Lehmkuhl et al.,2021).These results indicated that even if the genes of RNA-binding proteins are not mutated,they can cause disruption of RNA homeostasis in ALS or affect RNA metabolism during the development of ALS and stability.Mutations in the TDP-43 gene are found in only 4% of patients with familial ALS,yet TDP-43 protein mislocalization and inclusion bodies are present in 97% of all ALS patients.This suggests that cytoplasmic and intranuclear inclusion bodies are prevalent in ALS patients,even in the absence of mutations (Bakkar et al.,2018).
TDP43 and FUS have similar roles in RNA-related pathways,including RNA transcription,splicing,transportation,translation and microRNA production(Gagliardi et al.,2022).Both TDP43 and FUS interact directly with polyphase ribonucleoprotein complexes to regulate RNA splicing and transport(D’Ambrogio et al.,2009).Mutations in TDP-43 and FUS,as well as their mislocalization within the cytoplasm,are responsible for cytotoxicity,which can be attributed to the following: (1) loss of normal nuclear function leads to disordered nuclear RNA processing;(2) acquisition of additional cytoplasmic RNA binding acti vity;and (3) polymerization-dependent toxicity (Polymenidou and Cleveland,2017;Buratti,2021;Wang et al.,2021).Accumulating evidence shows that neurotoxicity is generated through various cellular pathways,including RNA mismatch and reduction of C9orf72 transcription,disordered nuclear/cytoplasmic transport,nuclear protein stress and DNA damage,which may lead to apoptosis (Farg et al.,2017;Walker et al.,2017;Zhang et al.,2018a,b,c;Loveland et al.,2022).
TDP43,FUS and hnRNP A1 are hnRNP family members that regulate RNA metabolism at each stage of the RNA life cycle (Kapeli et al.,2017;Wang et al.,2018;Milicevic et al.,2022).hnRNPs help control the maturation of newly formed hnRNA and pre-mRNA,stabilize mRNA,and control mRNA translation during transport within a cell (Dreyfuss et al.,1993).The steady states of mRNAs need to be strictly regulated for neuron survival;these steady states can be very vulnerable to dysfunctional RBP including hnRNPs (Nazarov et al.,2019).Research on ALS continues to evolve with the recent discovery of numerous genetic mutations in ALS patients,the majority of which are genes encoding RBPs including TDP-43,FUS,ataxin-2,TATA-box binding protein associated factor 15,Ewing’s sarcoma breakpoint region 1,hnRNPA1,hnRNPA2/B1,matrin 3 and T-cell-restricted intracellular antigen-1.Studies on these ALS-linked RBP suggested that RNA metabolism dysregulation,cytoplasmic RBP mislocalization,the dysfunction of RBP stress granule dynamics and the increase of mutant RBP result in their aggregation and might lead to the pathogenesis of ALS (Zhao et al.,2018).Heterogenous nuclear ribonucleoprotein G (hnRNP G) is a prominent RBP that is encoded by the RNA binding moti f protein X-linked gene and the only hnRNP that is glycosylated to directly bind to RNA (Liu et al.,2009;Ehrmann et al.,2019;Bampton et al.,2020).hnRNP G is a pre-splicing factor of mRNA and is involved in the selection of specific splicing sites;it can be bound by the nascent mRNA transcribed by the RNA polymerase II to regulate the selection of pre-mRNA alternative splicing sites (Hao et al.,2022).hnRNP G has been shown to regulate splicing mechanisms in neurodegenerative diseases.One study showed that hnRNP G promotes the expression of exon 7 of survival motor neuron mRNA,which is involved in spinal muscular atrophy,and homozygous deletion of the hnRNP G gene leads to spinal muscular atrophy(Hofmann and Wirth,2002).Another study showed that the microtubuleassociated protein Tau is regulated by interactions among cis-and transfactors,including hnRNP G;aberrant Tau splicing results in frontotemporal dementi a or Parkinson’s syndrome (Capano et al.,2022).Thus,hnRNP G has various and complex functions.
In our previous research,we discovered that the expression of hnRNP G protein in the spinal cord of Tg(SOD1*G93A)1Gur(TG) ALS model mice was considerably decreased (Zhang et al.,2018a).Combined with the previously known cytotoxicity of aggregated TDP-43 and FUS,we hypothesized that hnRNP G,which is also an RBP,may play a protective role in ALS development.We performed this study to determine whether if such a protective function exists and to determine the underlying mechanism.
Methods
Animals and cell line
The Tg(SOD1*G93A)1Gur mouse (TG) (Strain # 004435,RRID: IMSR_JAX:004435) is an animal model of ALS and one of the most common models to study the pathogenesis of ALS.The TG and wild-type (WT) mice were provided by the Institute of Model Animal Research,Nanjing University.A total of 24 mice were used in this study,including eight male mice at 60–70 days of age (corresponding to preonset of ALS),eight male mice at 90–100 days of age (onset of ALS),and 8 male mice at 120–130 days of age (ALS progression).The offspring produced by mating male TG mice and female WT mice were used for subsequent genotype identification and subsequent experiments.Animals were mated and housed in the Animal Center of Jiangxi Provincial People’s Hospital.All mice were housed in specific pathogen free conditions (three mice per cage) at 18–22°C,humidity 50–60%,and a 12-hour dark/light cycle;food and water were providedad libitum.All animal care procedures were conducted in accordance with the Guide for the Care and Use of Laboratory Animals of China published in 1996,and experimental protocols were reviewed and approved by the Animal Care and Use Ethics Committee (ACUEC Number 2019-11-02,approved on November 2,2019)of Jiangxi Provincial People’s Hospital,First Affiliated Hospital of Nanchang Medical College,China.
The rat pheochromocytoma cell (PC12) line (RRID: CVCL_0481,CLS Cat#500311/p701_PC-12) (Shui,2011) was obtained directly from the Cell Storage Center of Wuhan University.Cell line authentication was conducted by short tandem repeats analysis.PC12 cells were cultured in low-sugar Dulbecco’s modified Eagle’s medium (DMEM) (Sigma-Aldrich,St.Louis,MO,USA) at 37°C in an atmosphere of 5% CO2.
Experimental animal groups
Twenty-four male TG and WT mice were used in experiments.Only male TG and WT mice were used in this study to avoid any effect of sex on the experimental results.The mice were individually coded and samples were blindly stained and examined.
The experimental design is shown inFigure 1.At 20 days of age,the mice were genotyped and the experimental and control groups were distinguished from the SOD1 genotype identification results.We further divided the experimental and control mice into three groups depending on their age:preonset,onset,and progression.Eight mice in each group were used for subsequent experiments.The preonset,onset,and progression groups were monitored for 60–70,90–100,and 120–130 days,respectively.If a mouse died unexpectedly or specimen preparation was unsuccessful,another mouse was supplemented.The mice were sacrificed at the indicated time points;samples from five mice were used for immunofluorescence analysis and samples from three mice were used for western blot evaluation as described below.
SOD1 genotype identification by polymerase chain reaction
Mouse tail biopsies (approximately 0.3 cm) were placed in Eppendorf tubes with 75 µL 50 mM NaOH and incubated at 97°C for 30 minutes.After adding 7.5 µL 1 M Tris HCl (Sigma-Aldrich),tubes were centrifuged at 4000 ×gfor 1 minute.DNA was then extracted from the supernatant for subsequent polymerase chain reaction (PCR) analysis.
The PCR reaction conditions were as follows: 25 µL reaction mix solution,2µL primers (10 pmol/µL),2 µL template deoxyribonucleic acid (DNA),and 21 µL ddH2O in a 50 µL total volume.The PCR conditions were as follows:pre-denaturation at 95°C for 5 minutes,followed by 35 reaction cycles of denaturation at 94°C for 30 seconds,annealing at 60°C for 1 minute,and extension at 72°C for 1 minute,with a final extension at 72°C for 2 minutes and hold at 16°C.PCR products were observed by agarose gel (Sigma-Aldrich)electrophoresis (Bio-Rad,Hercules,CA,USA).The following PCR primers were used (Shanghai Biotechnology Company,Shanghai,China): forward mouse-SOD1*G93A primer: 5′-CAT CAG CCT ACT CCC TGA-3′;reverse mouse-SOD1*G93A primer: 5′-CGC GAC TAA CAA TCA ATC AAA GTG A-3′;forward mouse-IL2 primer: 5′-CTA GGC ACA GAA TTG AAA GAT CT-3′;and downstream mouse-IL2 primer: 5′-GTA GGT GGA AAA TTC TAG CAT CAT CC-3′.
Preparation of spinal cord samples
Spinal cords were dissected from mice at indicated time points.Mice were anestheti zed intraperitoneally by 1% sodium pentobarbital (Sigma-Aldrich) at 50 mg/kg body weight and then transcardially perfused with approximately 20 mL of pre-cooled 0.9% sodium chloride solution.For western blotting,spinal cord specimens were then immediately dissected and held at 4°C.For immunofluorescence,perfusion was conti nued with approximately 20 mL 4%paraformaldehyde (Sigma-Aldrich).Whole spinal cords were then dissected and immersed in 4% paraformaldehyde at 4°C overnight.After fixation,spinal cords were dehydrated in an alcohol gradient dehydration series(70%/80%/90%/95%/100%) and then immersed in sucrose solution at 4°C overnight.Dehydrated spinal cords were divided into the cervical,thoracic and lumbar segments and then embedded in optimal cutting temperature compound solution (Sakura Finetek Japan Co.,Ltd.,Tokyo,Japan).
Immunofluorescence staining
Frozen spinal cord sections (12 µm thick) were cut coronally on a Leica cryostat (Leica,Wetzlar,Germany).Sections were treated with 0.3% Triton X-100 (Sigma-Aldrich) for 10 minutes,washed with 0.01 M PBS for 5 minutes three times,blocked with 5% bovine serum albumin for 1 hour,and then incubated with the primary anti bodies rabbit anti -hnRNP G (1:200,Bioworld Technology,Cat# BS2274,RRID: AB_1663619) or/and mouse anti-neuronal nuclei (NeuN;1:400,Innovative Research,Cat# 187373,RRID: AB_431321)in the dark overnight at 4°C.Sections were then washed with 0.2%Tween-20 for 5 minutes five times and then incubated with the secondary antibodies goat anti-mouse IgG (fluorescein isothiocyanate,FITC) (1:200,Biorbyt,Cat# orb16661,RRID: AB_10926055) or donkey anti-rabbit IgG(tetramethyl rhodamine isothiocyanate,TRITC) (1:250,Antibodies-Online,Cat# ABIN400189,RRID: AB_10762075) in the dark at room temperature for 2 hours.Sections were then washed five times with 0.2% Tween-20 for 5 minutes each time and washed for 5 minutes with 0.01 M PBS three times.Coverslips were mounted using anti-fluorescence quenching sealing liquid(Shanghai Kanglang Biotechnology Co.,Ltd.,Shanghai,China).A Nikon Eclipse 80i fluorescence microscope (Nikon Corporation,Tokyo,Japan) with a camera was used to observe sections and record images.The images were processed with CS6 Photoshop software (Adobe Systems,San Jose,CA,USA).Images were examined and cells were counted as described below in the Image analysis section.
siRNA transfection
Preliminary experiments were performed to determine the optimal concentrations for siRNA transfections.The sequences of siRNAs (Shanghai GenePharma Co.,Ltd.,Shanghai,China) are as follows: hnRNP G siRNA1:forward,GCU CUU UAU UGG UGG GCU UTT and reverse,AAG CCC ACC AAU AAA GAG CTT;siRNA2: forward,CCC GAG AGA UGA UGG AUA UTT and reverse,AUA UCC AUC AUC UCU CGG GTT;and siRNA3: forward,GCG UGA CUA UUC GGA UCA UTT and reverse,AUG AUC CGA AUA GUC ACG CTT.Negative control sequences of siRNAs are the scrambled siRNA sequences.The results of the preliminary optimization experiments are shown inTable 1and2inAdditional file 1.
Before transfection,1–1.5 × 10⁵cells per well of a 12-well plate were cultured with 1 mL growth medium containing insulin,transferrin,hypoxanthine,thymidine,and trace elements;these components allow for a reduction in serum supplementation by at least 50%.Opti-MEM® medium (Opti-MEM®Reduced Serum Medium,Life Technologies Corporation,Gaithersburg,MD,USA) uses a sodium bicarbonate buffer system (2.4 g/L) and therefore requires a 5–10% CO2environment to maintain physiological pH for 18–24 hours.Lip2000 transfection reagent (YG0398,Shanghai Kemin Biotechnology Co.Ltd.,Shanghai,China) was mixed gently at room temperature before use.In a sterile EP tube,95 µL DMEM and 3 µL hnRNP G siRNA (20 µM) were mixed well,followed by addition of 2 µL Lip2000 transfection reagent.The mixture was incubated at room temperature for 20 minutes.Fresh DMEM (900µL) was added to each well,and the 100 µL transfection mixture was added to each well.The culture plate was gently shaken to mix well and cultured in a 5% CO2incubator (Memmert,Frankfurt,Maine,Germany) at 37°C.Total RNA was extracted after 24–96 hours.
RNA extraction and reverse transcription-PCR
Trizol (Sigma-Aldrich) (50–100 mg/mL) was added to PC12 cells and the lysed PC12 cells were placed in a ribozyme-free Eppendorf tube.Chloroform was added and the mixture was centrifuged at 12,000 ×gat 4°C for 20 minutes.The supernatant was placed into another tube with an equal volume of isopropanol and centrifuged at 12,000 ×gat 4°C for 15 minutes;the supernatant was then discarded.The pellet was washed with anhydrous ethanol,centrifuged at 12,000 ×gat 4°C for 10 minutes,and the supernatant was discarded.The RNA pellet was dissolved in diethyl pyrocarbonate water,and the RNA concentration was measured using a spectrophotometer(Thermo Fisher Scientific,Waltham,MA,USA).The extracted RNA was used for reverse transcription-PCR (RT-PCR).The RT-PCR reactions consisted of 2 µL 5× PrimescriptTMreverse transcription Master Mix containing random primers(TaKaRa,Tokyo,Japan),2 µL total RNA,and 6 µL RNase-free ddH2O.The RTPCR reaction was incubated at 37°C for 15 minutes and terminated by heating to 85°C for 5 seconds.
Quanti tative RT-PCR
The quanti tative RT-PCR (qRT-PCR) reactions contained 10 µL TB Green premix Ex Taq II (2×) (TaKaRa),0.8 µL PCR forward primer (10 µM),0.8 µL PCR reverse primer (10 µM),0.4 µL ROX reference dye or dye II (50×) (TaKaRa),2 µL 1×reverse transcription reaction solution (cDNA solution from RT-PCR),and 6 µL sterile water.The hnRNP G primers were,forward primer 5′-AAA CTT TGG ACC ACA CAT ATC C-3′ and reverse primer 5′-AAG CCA CGC TTA CAC ATACTA-3′,and the internal reference β-actin primers were forward primer 5′-CCG TGA AAA GAT GCC CAG AT-3′ and reverse primer 5′-GGA CAG TGA GGCCAGGATAGA-3′.
The qRT-PCR reactions were run on a StepOne plus real-time PCR system(Thermo Fisher Scientific) using the following amplification conditions: predenaturation at 95°C for 30 seconds and 40 cycles at 95°C for 5 seconds and 60°C for 30 seconds.An amplification curve and a fusion curve were generated after the completion of qRT-PCR.GraphPad Prism soft ware 9.3 was used for the analysis of these two curves (GraphPad Prism,Version X;San Diego,CA,USA,www.graphpad.com).Gene expression was normalized using the 2–∆∆CTmethod (Livak abd Schmittgen,2001) following the GraphPad Prism instructions,with β-actin mRNA expression as an internal reference.
Cell Counting Kit-8 cell growth assay
Cell growth of transfected PC12 cells was determined using the Cell Counting Kit-8 (CCK-8) (GIBCO BRL,Grand Island,NY,USA).PC12 cells were transfected in 96-well plates,and the transfection-containing medium was changed with fresh culture medium (low-sugar DMEM) (Sigma-Aldrich).Next,10 µL CCK8 solution was added to each well and cells were incubated at 37°C for 1 hour.The absorbance of each well was measured at 450 nM.GraphPad Prism soft ware (GraphPad Prism,version 9.3) was used to analyze the data.
Western blotting
Mouse spinal cord tissue was homogenized using a glass homogenizer and lysed with radioimmunoprecipitation assay (RIPA) lysis solution (Sigma-Aldrich)containing 1 mM phenylmethanesulfonyl fluoride (PMSF) (approximately 150–250 µL per 20 mg tissue).The lysed tissue was then centrifuged at 13,000 ×gat 4°C for 15 minutes.PC12 cells were lysed in 1 mL RIPA solution containing 10 µL PMSF and the lysate was centrifuged at 10,000–14,000 ×gat 4°C for 3–5 minutes.Protein concentrations were quantified using a BCA kit(Solarbio Co.Ltd.,Beijing,China).
Protein samples (20–50 µg) were separated by sodium dodecyl sulfate polyacrylamide gel electrophoresis at 100 mA and 80 V for 30 minutes followed by 120 V for 1–2 hours.Proteins were transferred to polyvinylidene fluoride membranes (Abcam,Cambridge,MA,USA) at 200 mA and 100 V for 30–60 minutes.Membranes were blocked in 5% skimmed milk solution(Sigma-Aldrich) for 1–2 hours at room temperature,washed with 1× Tris Buffered Saline with Tween (TBST) for 10 minutes three times,and incubated with primary anti body at 4°C overnight.The membranes were then washed with 1× TBST for 10 minutes three times,incubated with secondary anti bodies at room temperature for 1–2 hours,and washed for 10 minutes three times.Proteins were visualized by incubation of membranes with luminescent liquid (Sigma-Aldrich) for 0.5–2 minutes followed by exposure.ImageJ software (1.8.0 version,National Institutes of Health,Bethesda,MD,USA;Schneider et al.,2012) was used to analyze protein band density.The primary anti bodies were as follows: rabbit anti -α-tubulin (1:1000,MBL International,Cat# PM054-7,RRID: AB_10695326),rabbit anti -hnRNP G (1:1000,Bioworld Technology,Cat# BS2274,RRID: AB_1663619),rabbit anti-SOD1 (1:1000,Abcam,Cat# 1926-1,RRID: AB_765070),rabbit anti-BCL2-associated X protein (Bax) (1:1000,IMGENEX,Cat# IMG-5682,RRID: AB_1148415),rabbit anti -TDP43 (1:1000,PhosphoSolutions,Cat# 2000-TDP,RRID: AB_2492258),and mouse anti-β-actin (1:2000,Multi Sciences,Cat# 70-ab008-100,RRID:AB_2750915).The secondary antibodies were horseradish peroxidaseconjugated secondary anti body donkey anti -rabbit IgG (TRITC) (1:200,Multi Sciences,Cat# 70-ab008-100,RRID: AB_2750915) or goat anti-mouse IgG(FITC) (1:200,Biorbyt,Cat# orb16661,RRID: AB_10926055).
To verify the specificity of primary antibodies,negative controls for immunohistochemical staining and western blots were conducted in the absence of primary antibody or in the presence of non-immune normal serum at the same dilution as the primary antibody.Antigen-antibody preabsorption experiments with native anti gen were also performed.
Image analysis
ImageJ software was used to quantify hnRNP G-positive cells in immunofluorescence images and measure gray values of western blot images.Relative protein expression was normalized to tubulin.Photoshop was used to adjust the images.The total numbers of hnRNP G-positive cells in each distinct anatomical region of the spinal cord were counted in 10 sections at 200× magnification.The sum of hnRNP G-positive cells of all 10 sections was divided by 10.Five mice per group were used and the average number of hnRNP G-positive cells was used for quanti tative analysis.
Stati stical analysis
All data were analyzed using IBM SPSS Statistics 25.0 (IBM Corp.,Armonk,NY,USA).Student’st-test and Mann-WhitneyUtest were used to esti mate the differences between the two groups,and one-way analysis of variance with Tukey’spost hoctest was used to compare more than two groups (for details seeAdditional file 1).P<0.05 was considered to indicate stati stical difference.
Results
Distribution of hnRNP G-positive cells in mouse spinal cord
The experimental overview is shown inFigure 1.We examined the distribution of hnRNPG-positive cells in sections of the spinal cord in the ALS model (TG)mice and WT mice at various time points: age 60–70 days (preonset of ALS),age 90–100 days (onset of ALS),and age 120–130 days (ALS progression)(Zhang et al.,2018a,b;Figures 2–4).
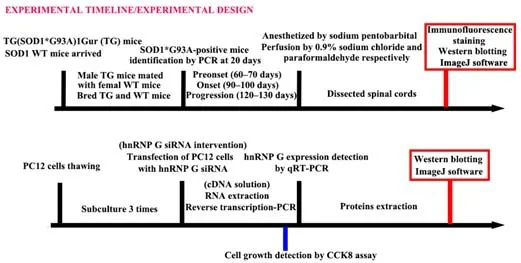
Figure 1|Study design.
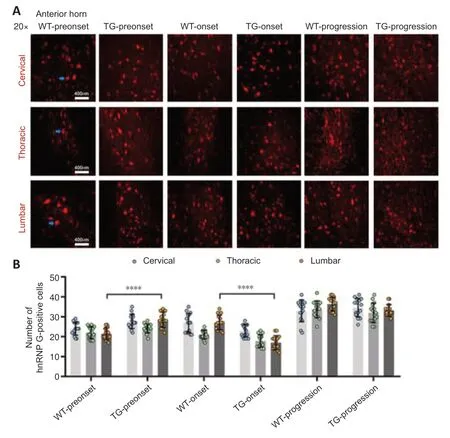
Figure 2|The distribution of hnRNP G in the anterior horn of the spinal cord of TG and WT mice at different stages.
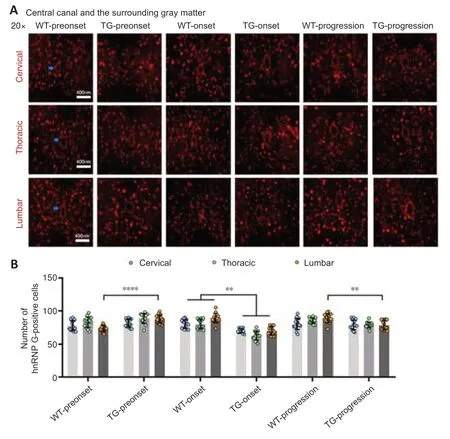
Figure 3|The distribution of hnRNP G in the central canal and the surrounding gray matter of the spinal cord of TG and WT mice at different stages.
In WT mice,hnRNP G-positive cells were widely distributed in the anterior horn,the central canal,the posterior horn and other parts of the spinal cord;there were marked differences in the distribution of hnRNP G-positive cells in the different segments of the spinal cord and in the different regions of the same segments.The distribution of hnRNP G-positive cells from most to least in the cervical,thoracic and lumbar segments of spinal cord was as follows: cervical,thoracic and lumbar segments of WT mice was that in the posterior horn were more than that in the central canal more than that in the peripheral gray matter more than that in the anterior horn (hnRNP G-positive cells in the posterior horn >central canal >peripheral gray >anterior horn).
In the TG group,the number of hnRNP G-positive cells in the anterior horn of the lumbar spinal cord was significantly higher at the preonset stage (60–70 days) than that in the WT group mice (P<0.0001,Figure 2,for detailed data seeTables 1–3inAdditional file 2).Significantly more hnRNP G-positive cells were also detected in both the central canal and surrounding gray matter in the lumbar spinal cord in the preonset TG group mice compared with WT mice (P<0.0001,Figure 3,for detailed data seeTables 1–3inAdditional file 3).There were significantly fewer hnRNP G–positive cells in the posterior horn of the thoracic spinal cord in the preonset TG group mice compared with the WT group mice (P<0.01,Figure 4,for detailed data seeTables 1–3inAdditional file 4).
The number of hnRNP G-positive cells in the anterior horn of the lumber spinal cord in the onset TG group (90–100 days) was significantly lower than that in the WT group (P<0.001,Figure 2,for detailed data seeTables 1–3inAdditional file 2).The number of hnRNP G-positive cells in both the central canal and its surrounding gray matter of each segment in the onset TG group was significantly reduced compared with that in the WT group (P <0.01,Figure 3,for detailed data seeTables 1–3inAdditional file 3).The number of hnRNP G-positive cells in the posterior horn of both cervical and thoracic segments of both the preonset and progression TG groups (aged 120–130 days) was significantly lower than that of the WT group (P=0.037,Figure 4,for detailed data seeTables 1–3inAdditional file 4).The number of hnRNP G-positive cells in both the central canal and its surrounding gray matter of the lumbar spinal cord in the progression TG group was also significantly decreased compared with that in the WT group (P<0.01,Figure 3,for detailed data seeTables 1–3inAdditional file 3).
Identification of hnRNP G expression in spinal cord by immunofluorescence
The hnRNP G anti body and the NeuN anti body (neuron marker) were used to double-label sections from the different spinal cord segments of mice in the onset TG group (Figure 5).We observed co-localization of hnRNP G and NeuN in different anatomic regions in the different spinal segments at the onset stage.These results showed that the hnRNP G was expressed in neurons of the spinal cord.
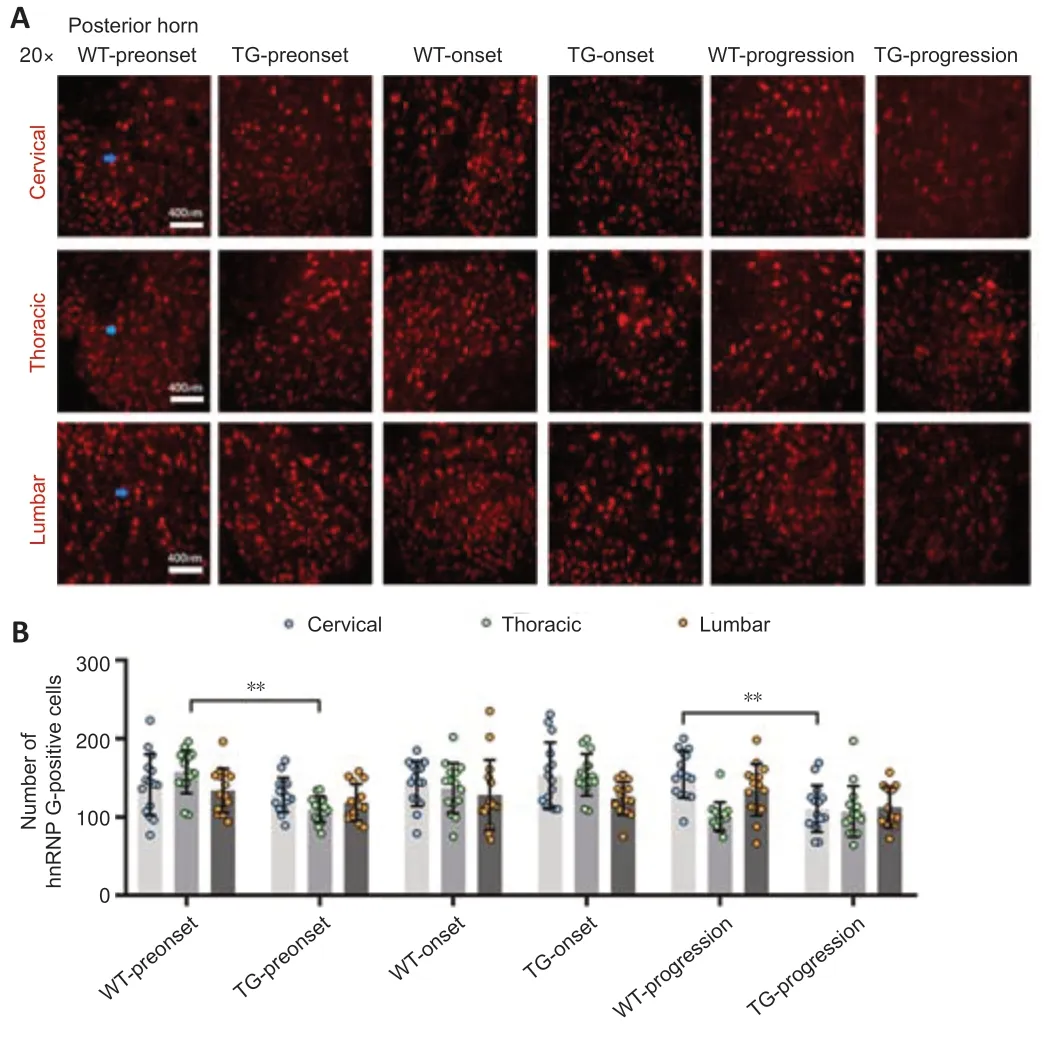
Figure 4|The distribution of hnRNP G in the posterior horn of the spinal cord of TG and WT mice at different stages.
Identification of hnRNP G expression in spinal cord by western blotting
Western blotting was used to analyze the expression of hnRNP G protein in the spinal cord in WT and TG mice at various stages (Figure 6,for detailed data seeTables 1–3inAdditional file 5).hnRNP G protein expression in the cervical segment of TG mice was significantly higher compared with that of WT mice in the preonset groups (P=0.0007),whereas hnRNP G protein expression in TG mice was significantly lower than that in WT mice in the progression groups (P=0.0159;Figure 6A,for detailed data seeTable 1inAdditional file 5).The expression of hnRNP G protein in the thoracic segment of TG mice was significantly higher than that of WT mice in the preonset groups (P=0.0132),whereas hnRNP G protein expression in TG mice was significantly lower compared with that in WT mice in the onset groups (P=0.0334).However,the expression of hnRNP G protein in TG mice was significantly higher than that in WT mice in the progression groups(P=0.003) (Figure 6B,for detailed data seeTable 2inAdditional file 5).The expression of hnRNP G protein in the lumbar segment was decreased significantly in TG mice compared with the WT mice in the progression groups (P<0.0001) (Figure 6C,for detailed data seeTable 3inAdditional file 5).
Suppression of hnRNP G expression by gene silencing in in vitro experiments
We next used siRNA-mediated silencing to examine the functions of hnRNP in more detail using three siRNA sequences.The PC12 cell line,derived from a rat adrenal medullary tumor (pheochromocytoma),has been widely used as a model for the study of neuronal differenti ation (Shui,2011),and therefore we used these cells for analysis.qRT-PCR confirmed significantly lower expression of hnRNP G mRNA in the hnRNP G gene-silenced PC12 cells compared with that in the control groups (Figure 7A,for detailed data seeTable 1inAdditional file 6).Quanti tative analysis of western blot analysis of hnRNP G protein in PC12 cells further confirmed that hnRNP G protein expressions in all hnRNP G gene-silenced groups were significantly less compared with that in the control groups (P<0.001;Figure 7BandC,for detailed data seeTable 2inAdditional file 6).The growth curve of PC12 cells without any treatment was determined by CCK8 assay,and the results showed a gradual increase in proliferation from 24 hours to 72 hours (Figure 8A).We next performed CCK8 assays to examine the influence of hnRNP G on cell survival.PC12 cells treated with hnRNP G-siRNA showed a significant decrease in cell viability after 48 hours (P<0.01,Figure 8B,for detailed data seeTables 1–3inAdditional file 7).
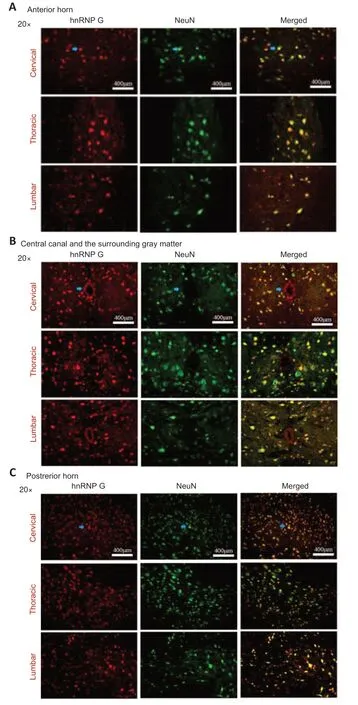
Figure 5|Double immunofluorescence staining of hnRNP G and NeuN in the anterior horn,the central canal and the surrounding gray matter and the posterior horn of different spinal cord segments of TG mice in the onset phase.
Expression of TDP43/Bax/SOD1 in PC12 cells after hnRNP G gene silencing
Based on the hypothesis regarding the protective effect of hnRNP G involving the reduction of apoptosis,which might be related to expression alteration of pathogenic proteins such as TDP43,SOD1 and the apoptosis protein Bax,western blotting was used to detect the expression of TDP43,SOD1 and Bax in the absence of PC12 (Figure 8C–F,for detailed data seeTables 4–9inAdditional file 7).The expression of SOD1 was not significantly changed in PC12 cells after hnRNP G-siRNA treatment;however,the expression levels of Bax and TDP43 were significantly increased compared with controls (P<0.05 andP<0.01,respectively),indicating that hnRNP G might be involved in apoptosis and the abnormal accumulation of TDP43.
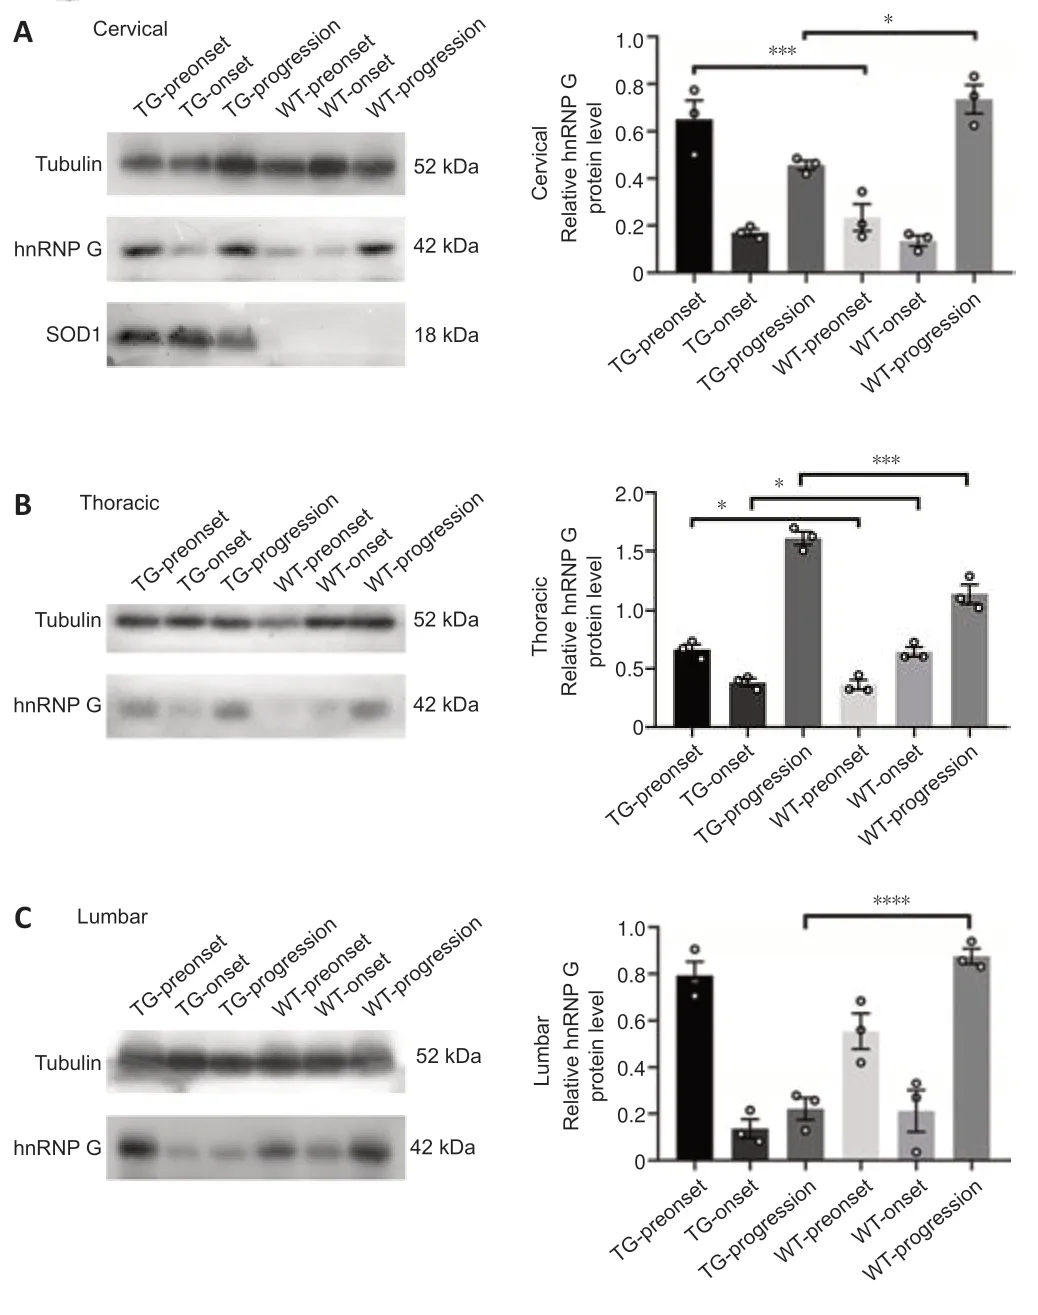
Figure 6|hnRNP G protein expression in the different spinal cord segments of both TG and WT mice at the different stages.
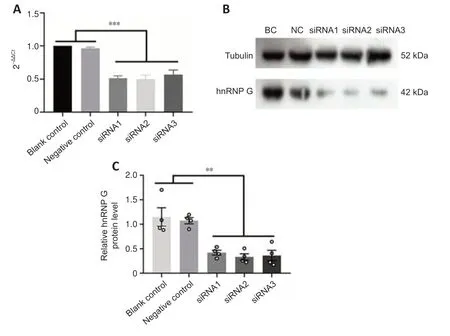
Figure 7|hnRNP G-siRNA silencing efficiency in PC12 cells.
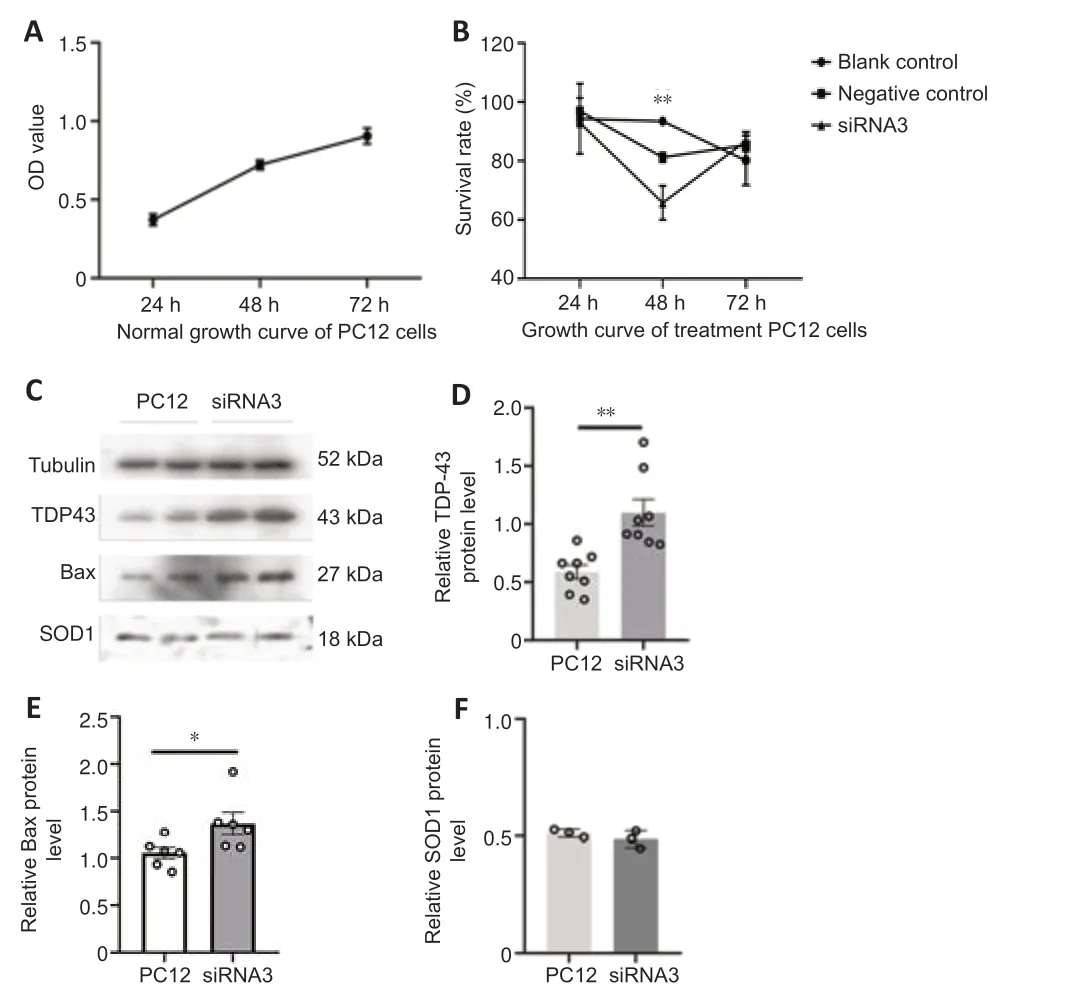
Figure 8|Cell growth curve before and after hnRNP G gene silencing,and the semiquanti tative analysis of TDP43,Bax,and SOD1 expression in PC12 cells after hnRNP G-siRNA interference.
Discussion
In this study,we examined hnRNP G expression and distribution in the spinal cord of TG and WT mice and quantitatively analyzed the expression of ALS pathogenic proteins (TDP43,SOD1,and Bax) and cell proliferation in PC12 cells after hnRNP G gene silencing.The aim of our study was to explore the expression and potential mechanism of hnRNP G in the pathogenesis of ALS.Our results showed that hnRNP G was widely distributed in the anterior horn,central canal and surrounding gray area,posterior horn and other regions of the spinal cord of WT mice.There were significant differences in the distribution of hnRNP G in various spinal cord segments and regions of the same segments in WT mice.Moreover,the results of our preliminary study found that the hnRNP G increase in spinal cord was closely related to the pathogenesis of ALS (Zhang et al.,2018a).In ALS,most damage occurs in the motor neuron of anterior horn in spinal cord.Thus,we hypothesized that the hnRNP G distribution features in spinal cord might be closely associated with the selectively damaged motor neurons in the anterior horn of cervical and lumbar segments in the development of ALS.The precise relationship and mechanism regarding the pathogenesis of ALS will need to be explored in future studies.The expression of hnRNP G protein in the spinal cord of TG mice was significantly increased at the preonset stage but significantly decreased at both onset and progression stages (besides the thoracic segment) compared with WT mice.The TG and WT mice were matched with regard to background strain and age to rule out potenti al confounders,and therefore the elevation of hnRNP G in TG mice in the preonset phase may be because of disease mechanisms.For example,hnRNP G expression increase at the preonset stage might be a stress protective response at the early stage of disease;this stress response gradually decreases with disease progression,resulting in hnRNP G expression progressively decreasing at onset and progression stages.These observations suggest that hnRNP G protein may play a protective role in the pathogenesis of ALS model mice,and decreased expression of hnRNP G protein at both onset and progression stages may promote the development of ALS in mice.Thus,intervention of hnRNP G expression might be a candidate strategy of treating ALS.Our study provides preliminary evidence for further studying the potenti al roles of hnRNP G in the pathogenesis of ALS.
Our study implied that abnormal distribution and expression of hnRNP G might play a protective effect in ALS development via preventing neuronal death by reducing abnormal apoptosis induction in the spinal cord.To examine the potenti al role of hnRNP G in neuronal damage or apoptosis,we conducted hnRNP G silencing in PC12 cells.Our results showed the significant decrease of PC12 cell survival rate after reducing the expression of hnRNP G in PC12 cells along with the significant increase of both TDP43 and Bax expressions.Decreased expression of hnRNP G might lead to the abnormal generation and aggregation of TDP43,ultimately causing neuronal damage and death and promoting the occurrence and development of ALS (Mackenzie et al.,2007;D’Ambrogio et al.,2009;Gao et al.,2019;Buratti,2021).hnRNP G also might play a role controlling apoptosis in the occurrence and development of ALS by regulating the expression of the apoptogenic factor Bax,as excessive expression of Bax accelerates neuronal apoptosis (Pišlar et al.,2022).We found that hnRNP G is extensively expressed in neurons.Most of the cells that are damaged in ALS are neurons (Goutman et al.,2018;Cook and Petrucelli,2019),and therefore we speculate that hnRNP G may be closely associated with the death of neurons in ALS.Increasing hnRNP G expression or preventing hnRNP G expression decrease in ALS may be an approach to prevent the neuron death caused by aberrant expression of TDP43 and Bax in ALS.
The expression of hnRNP G was increased in the early stage of neuron damage and then gradually decreased to a normal level.Previous studies reported a co-localization between hnRNP G and activated caspase-3 in neurons (Elliottet al.,2019).Caspase-3 is an important regulator of apoptosis that plays a key role in the pathological neuron death in the nervous system.In adult mice with acute spinal cord injury,the expression of hnRNP G in neurons peaked on the first day after injury and then returned to the base level at 14 days (Liu et al.,2022).hnRNP G is also involved in brain formation in zebrafish.Knockdown of hnRNP G gene in zebrafish leads to characteristic morphological defects of the brain,such as the enlarged tectum and ventricles,and abnormal development of nerve,muscle and spinal cord (Raznahan and Disteche,2021).The role of hnRNP G in zebrafish brain development suggests that human hnRNP G may be involved in the functional and behavioral defects caused by damage of the central nervous system (Graves et al.,2002).In our study,we found the increased expression of hnRNP G protein in the spinal cord of TG mice at the preonset stage with significantly decreased expression at both onset and progression stages;however,the expression was increased at the progression stage relative to the onset stage,which was consistent with previously reported results of increased expression and then decreased expression of hnRNP G in neurons after spinal cord injury (Liu et al.,2022).These findings suggest that a neuroprotective stress response occurs in the early phases of ALS,and this stress response was associated with an increase in hnRNP G expression.As ALS progresses to the onset and progressive stages,this protective stress response gradually disappears,accompanied by a gradual decrease in hnRNP G expression unti l it returns to its baseline.hnRNP G may exert its function by activating caspase-3 induced neuron apoptosis.
In the previous study,the expression of hnRNP G was mainly increased in both neurons and astrocytes but not microglia in rats following spinal cord injury.In addition,both hnRNP G and proliferating cellular nuclear antigen were detected in astrocytes,and both hnRNP G and activated caspase-3 were detected in neurons (Liu et al.,2022).The expressions of B-cell lymphoma-2(Bcl-2),Bax,and activated caspase-3 in mice with acute spinal cord injury are also markedly changed,leading to secondary tissue injury,regeneration damage,and cell dysfunction (Tian et al.,2013;Chen et al.,2020).In our study,hnRNP G co-localized with the neuron marker NeuN and its expression gradually decreased from the onset to progression stage compared with the significant increase at the pre-onset stage.Therefore,the relative decrease of hnRNP G expression in the related anatomic regions of the spinal cord at both onset and progression stage may be related to the death of spinal neuronal damage and/or apoptosis related to the abnormal Bcl-2,Bax,and activated caspase-3 expression in TG mice.
hnRNP A1 is a member of the hnRNP family that is involved in RNA metabolism (Clarke et al.,2021).In cell models,hnRNP A1 negatively regulates its own mRNA by inhibiting intron 10 splicing of the hnRNP A1 pre-mRNA.This mechanism might self-regulate hnRNP A1 expression,and a low level of hnRNP A1 expression can cause cytotoxicity by activating mitochondrial apoptosis (Davidson et al.,2017;Suzuki and Matsuoka,2017).The level of hnRNP A1 is strictly controlled by this mechanism to prevent cytotoxicity under physiological conditions.Whether hnRNPs related to ALS play independent or synergistic roles is unclear.Like many other RBPs,the functions of TDP43 and hnRNP A1 may be extremely dose sensitive,so that they self-regulate by binding their own mRNA in the nucleus (Guo and Shorter,2017;Suzuki and Matsuoka,2017).When cytoplasmic aggregates deplete TDP43 in the nucleus,the level of TDP43 is up-regulated because of the lack of self-regulation (Klim et al.,2019),which results in a cycle of increased TDP43 RNA expression and cytoplasmic aggregation.Deshaies et al.(2018) reported that the loss of TDP43 function resulted in increased hnRNP A1 levels in the cytoplasm and that the level of hnRNP A1 protein was decreased in the nuclei of ALS neurons.The activation of RBP compensation in ALS patients with a TDP43 gene mutation leads to increased splicing repressor expression to offset the loss of TDP43 function.The overexpression of hnRNP u and hnRNP A1/A2 can inhibit TDP43-induced neuronal cell death in mice (Duan et al.,2019).
The expression of hnRNP G was significantly increased at the preonset stage in TG mice and then decreased to the base level at the progression stage(besides the thoracic segment).This may be because hnRNP G,like other hnRNPs such as hnRNP u and hnRNP A1/A2,negatively regulates itself by binding with its own mRNA in the nucleus,but this needs to be further confirmed.Silencing of hnRNP G in PC12 cells reduced the proliferation of PC12 cells compared with the controls,and the expressions of TDP43 and Bax in PC12 cells were significantly increased.The absence of hnRNP G might,therefore,stimulate an increase in TDP43 transcription,disrupt the automatic regulation of TDP43 mRNA,or slow down degradation of TDP43 protein at both onset and progression stages in the spinal cord of TG mice,leading to abnormal aggregation of TDP43 and neuronal apoptosis in ALS.
Our study also has some limitations.First,some conclusions were slightly difficult to follow from the present data.For example,immunostaining showed specific increases in hnRNP G expression in spinal cord sections during ALS progression at 90–120 days post-birth;however,we cannot completely conclude the increase is because of a “protective responsive.” hnRNP G also decreases in later stages,and we cannot completely conclude that the decreased expression is related to a “promotion of the development of ALS.” We have thus introduced these as speculations not formal conclusions.Second,our data only showed changes in expression in one mouse model;thus,our interpretations of conclusions may be limited and the changes in hnRNP G expression could be correlative rather than causative.Third,our results also showed that knockdown in PC12 cells influenced proliferation and apoptotic proteins;however,as hnRNP G regulates mRNAs of multiple genes and proliferation-related genes,these proteins may or may not be the targets of hnRNP G in ALS.Therefore,more data are required to determine the extent to which hnRNP G functions in the mechanism in ALS through experiments in other ALS models or a knockout mouse or targeted knockout that would address the question of the precise role of hnRNP G in ALS.
Author contributions:Designed the study and wrote the manuscript: FY,WZC,SSJ,XHW,RSX;performed western blots,immunohistochemistry,cell culture experiment: FY,WZC,SSJ;performed the stati stical analysis and animal dissection for isolating spinal cord: FY,WZC;generated the TG(SOD1*G93A)1Gur transgenic mice: FY,WZC;did character isolation and validation of the transgenic mice model: FY,WZC.All authors approved the final version of this manuscript for publication.
Conflicts of interest:The authors declare that they have no conflict of interest.
Author statement:This paper has been posted as a preprint on Research Square with doi: https://doi.org/10.21203/rs.3.rs-580041/v2,which is available from: https://assets.researchsquare.com/files/rs-580041/v2/0758021a-9199-41e6-b753-8b4bb7a44505.pdf?c=1632408643.
Availability of data and materials:All data generated or analyzed during this study are included in this published article and its supplementary information files.
Open access statement:This is an open access journal,andarticles are distributed under the terms of the Creative Commons AttributionNonCommercial-ShareAlike 4.0 License,which allows others to remix,tweak,and build upon the work non-commercially,as long as appropriate credit is given and the new creations are licensed under the identical terms.
Additional files:
Additional file 1:The transfection gradient experiment.
Additional file 2:The data of Figure 2.
Additional file 3:The data of Figure 3.
Additional file 4:The data of Figure 4.
Additional file 5:The data of Figure 6.
Additional file 6:The data of Figure 7.
Additional file 7:The data of Figure 8.

- 中国神经再生研究(英文版)的其它文章
- Bystanders or not? Microglia and lymphocytes in aging and stroke
- Alzheimer’s disease risk after COVID-19: a view from the perspective of the infecti ous hypothesis of neurodegeneration
- Serine and arginine rich splicing factor 1: a potenti al target for neuroprotection and other diseases
- Can glial cells save neurons in epilepsy?
- Lights for epilepsy: can photobiomodulation reduce seizures and offer neuroprotection?
- The landscape of cognitive impairment in superoxide dismutase 1-amyotrophic lateral sclerosis