
Magnetic resonance imaging focused on the ferritin heavy chain 1 reporter gene detects neuronal differenti ation in stem cells
2023-02-24 05:25XiaoYaHeYiRuiZhouTongMuYiFanLiaoLiJiangYongQinJinHuaCai
中国神经再生研究(英文版) 2023年7期
Xiao-Ya He ,Yi-Rui Zhou ,Tong Mu ,Yi-Fan Liao,Li Jiang,Yong QinJin-Hua Cai
Abstract The neuronal differentiation of mesenchymal stem cells offers a new strategy for the treatment of neurological disorders.Thus,there is a need to identify a noninvasive and sensitive in vivo imaging approach for real-time monitoring of transplanted stem cells.Our previous study confirmed that magnetic resonance imaging,with a focus on the ferritin heavy chain 1 reporter gene,could track the proliferation and differentiation of bone marrow mesenchymal stem cells that had been transduced with lentivirus carrying the ferritin heavy chain 1 reporter gene.However,we could not determine whether or when bone marrow mesenchymal stem cells had undergone neuronal differentiation based on changes in the magnetic resonance imaging signal.To solve this problem,we identified a neuron-specific enolase that can be differentially expressed before and after neuronal differentiation in stem cells.In this study,we successfully constructed a lentivirus carrying the neuron-specific enolase promoter and expressing the ferritin heavy chain 1 reporter gene;we used this lentivirus to transduce bone marrow mesenchymal stem cells.Cellular and animal studies showed that the neuron-specific enolase promoter effectively drove the expression of ferritin heavy chain 1 after neuronal differentiation of bone marrow mesenchymal stem cells;this led to intracellular accumulation of iron and corresponding changes in the magnetic resonance imaging signal.In summary,we established an innovative magnetic resonance imaging approach focused on the induction of reporter gene expression by a neuron-specific promoter.This imaging method can be used to noninvasively and sensitively detect neuronal differentiation in stem cells,which may be useful in stem cell-based therapies.
Key Words:ferric ammonium citrate;ferritin heavy chain 1 gene;magnetic resonance imaging;mesenchymal stem cells;molecular imaging;neuronal differentiation;neuron-like cells;neurons;neuron-specific enolase;promoter
Introduction
Over the past 10 years,advancements in stem cell studies have highlighted potenti al applications of exogenous cell therapy in the treatment of various neurological diseases.Numerous animal and preclinical studies have shown that the transplantation of stem cells into damaged neural tissues can yield favorable results (Saracino et al.,2013;Gennai et al.,2015;Ge et al.,2016).In terms of cell types for clinical applications,mesenchymal stem cells (MSCs)are considered ideal candidates because they have self-renewal ability,multi directional differenti ation potenti al,no major ethical problems,and low immunogenicity (Bedini et al.,2018;Singh et al.,2020;Deng et al.,2022).Efforts to understand the biological behaviors of transplanted cells (e.g.,distribution,proliferation,and differenti ation) require a noninvasive method to monitor transplanted stem cells (Janowski et al.,2014;Dash et al.,2015;Ngen et al.,2015).Optical imaging,nuclear medicine imaging,and magnetic resonance imaging (MRI) are the main methods used for cell tracking (Silachev et al.,2016;Hwang et al.,2017;Namestnikova et al.,2017).Among these three imaging methods,MRI is ideal for clinical translation because it requires no radiation,has deep tissue penetration,and exhibits sufficient tissue contrast (Jurgielewicz et al.,2017;Ngen and Artemov,2017).
Currently,two types of stem cell MRI tracking strategies are available: direct imaging (focused on intracellular magnetic labeling) and indirect imaging(focused on reporter genes).In direct imaging,the MRI signal produced by intracellular magnetic labeling can fade with stem cell proliferation,which hinders long-term cell tracking (Cai et al.,2007,2008;Lee et al.,2014;Watada et al.,2015;Qin et al.,2018).The reporter gene-based imaging approach resolves this problem.Reporter genes can be integrated into the stem cell genome and sustainably expressed regardless of cell proliferation or differenti ation;this leads to the accumulation of extracellular iron inside the cells,which facilitates MRI-based detection (Zheng et al.,2017).Thus far,many MRI reporter genes have been investigated;ferritin heavy chain 1 (FTH1)is most commonly studied because of its clear iron accumulation effect and safety (Vande Velde et al.,2013;He et al.,2016;Sun et al.,2021).
In our previous study,we transduced the FTH1 gene into MSCs,then conducted MRI analyses to longitudinally detect the transduced cells during proliferation and differentiation (Mu et al.,2018).We found that the FTH1 gene was clearly expressed in both stem cells and differentiated neuronlike cells (NLCs),which suggested that FTH1-based MRI could be used for long-term tracking of stem cells.However,this method cannot distinguish whether cells have undergone differentiation.Thus,it cannot be used to determine whether and/or when stem cells have differentiated into NLCs;this information is essenti al when evaluating cell fate.To solve this problem,we searched for a gene with distinct expression patterns in differentiated and undifferentiated cells.We hypothesized that we could detect the differenti ation event in stem cells by using the promoter for the gene with differenti ation-specific expression to activate reporter gene expression.
In this study,we added a neuron-specific enolase (NSE) promoter upstream of theFTH1gene,then transduced the modified reporter gene into MSCs;we observed changes in FTH1 expression and the MRI signal during stem cell differenti ation.Our approach of inducing FTH1 gene expression via the NSE promoter may facilitate MRI-based detection of stem cell differenti ation into NLCs.
Methods
Ethics statement
Animal experiments in this study were approved by the Animal Ethics Committee of the Children’s Hospital of Chongqing Medical University,China,on January 20,2021 (approval No.CHCMU-IACUC20210114).The experimental protocols and procedures were conducted in accordance with the Guide for the Care and Use of Laboratory Animals (8thed) (National Institutes of Health,2011).All possible efforts were made to alleviate animal suffering.
Preparation of MSCs
Bone marrow MSCs were obtained from two male Sprague-Dawley rats (grade:specific pathogen-free;age,4 weeks;weight,~50 g) from the Experimental Animal Center of Chongqing Medical University,Chongqing,China (license No.SCXK (Yu) 2018-0003).MSCs were isolated from bone marrow using a previously reported protocol (Cai et al.,2008).The isolated MSCs were grown in Dulbecco’s modified Eagle’s medium (Gibco,Grand Island,NY,USA) with 10% fetal bovine serum (HyClone,Logan,UT,USA) at 37°C in 95% humidity with 5% CO2.When MSCs reached 80–90% confluence,they were passaged by trypsinization.Third-passage MSCs were collected for experiments.To identi fy MSCs,cells were incubated with anti -rat anti bodies to CD34,CD45,CD29,and CD44 (Beyotime,Nanjing,China) for 30 minutes in the dark,then transferred into 0.4 mL of phosphate-buffered saline (PBS);subsequently,they were sorted and quantified by flow cytometry.
Preparation of recombinant lenti viral vector
The upstream region of theNSEgene (NSE promoter,1.8 kb) was amplified by polymerase chain reaction (PCR) using rat genomic DNA as a template,in accordance with previous reports (Peel and Klein,2000).The following primers were used: forward,5′-ATG CTC TAG ACT CGA GAG CTC TGA GCT CCT CCT CTG CTC GC-3′;reverse,5′-CAT GGT GGC GAC CGG TTC GAG GAC TGC AGA CTC AGC CG-3′.The ratFTH1gene (NM_012848) was synthesized by PCR using the following primers: forward,5′-AGG TCG ACT CTA GAG GAT CCG GGC CCT ACG TGC TGT CTC ACA CAG CC-3′;and reverse,5′-ACC GTA AGT TAT GTG CTA GCT TAT TTG TCG TCA TCA TCC TTA TAG TC-3′.FTH1was inserted into the lenti viral vector through digestion withEcoRI andBamHI to obtain the recombinant lenti viral vector pLV/CMV-FTH1.Then,the cytomegalovirus (CMV) promoter in pLV/CMV-FTH1 was replaced by the NSE promoter (NSE) usingClaI andEcoRI digestion to obtain pLV/NSE-FTH1,in which the NSE promoter controlled the expression of FTH1 (Figure 1A).The recombinant complementary DNA sequences of theFTH1gene andNSEpromoter were confirmed by DNA sequencing and PCR.The recombinant vectors were confirmed by DNA sequencing,a double digestion system,and agarose gel electrophoresis.The pLV/NSE-FTH1 or pLV/CMV-FTH1 vectors and the packaging plasmids pMD2G and pSPAX2 (Hanbio Biotechnology Co.,Ltd.Shanghai,China;Cat# LV011)were co-transfected into 293T packaging cells (Chinese Academy of Sciences,Beijing,China;Cat# GNHu 43;RRID: CVCL_0045) to obtain lentiviruses for transduction experiments.Six hours after transfection,fresh medium with 10%fetal bovine serum was supplemented;viral medium was collected 48 and 72 hours later.Centrifugation at 4000 ×gwas performed for 10 minutes at 4°C to remove cellular debris.Virus particles were collected by centrifugation at 82,700 ×gfor 2 hours at 4°C,then stored at–80°C.
Lenti viral transduction
For cell transduction,MSCs at 30–40% confluence were transduced with lentiviruses carrying LV/NSE-FTH1 or LV/CMV-FTH1,in the presence of 5µg/mL polybrene (Sigma-Aldrich,St.Louis,MO,USA).To determine the appropriate conditions for transduction,MSCs were transduced with lenti viruses at various multi plicities of infection (MOIs;5,10,15,20,or 30).MSCs treated with PBS were used as a control group.The expression patterns of green fluorescence protein were evaluated via fluorescence microscopy(Shanghai Piem Optical Instrument Co.,Ltd.,Shanghai,China) at 24,48,and 72 hours after transduction to determine the opti mal MOI.Puromycin (Sigma-Aldrich) at different concentrations (0.1,0.5,1,2,3,4,or 5 µg/mL) was added to the transduced MSCs,then cultured for 7 days to determine the minimum lethal concentration.After treatment with puromycin at the minimum lethal dose for 7 days and then at half of the minimum lethal dose for 3 days,the resulting clonal cells were named MSCs/NSE-FTH1 and MSCs/CMV-FTH1.
Neuronal induction and assessment
To induce the cells (MSCs,MSCs/CMV-FTH1,and MSCs/NSE-FTH1) to undergo neuronal differentiation,a previously reported two-step neuronal induction protocol (Bi et al.,2010) was used.Briefly,stem cells were pre-induced for 24 hours by incubation with 1 mmol/mL all-trans retinoic acid (ATRA);they were induced for another 24 hours by incubation with modified neuronal induction medium (containing 200 µM butylated hydroxyanisole [Meilun Biological Products Co.,Ltd.,Dalian,China],20 mM KCl [Sangon Biotechnology Co.,Ltd.,Shanghai,China],8 µM forskolin [AmyJet Scientific Inc.,Wuhan,China],1.6 mM sodium valproate [Meilun Biological Products Co.,Ltd.],0.8µM hydrocorti sone [Meilun Biological Products Co.,Ltd.],and 4 µg/mL insulin[Meilun Biological Products Co.,Ltd.]).Cells subjected to neuronal induction in the three groups were designated NLCs,NLCs/CMV-FTH1,and NLCs/NSE-FTH1.
Before and after induction,the expression patterns of the neuronal markers NSE and microtubule-associated protein-2 (MAP-2) were evaluated by immunofluorescence.Dissociated cells (250 cells/mm2) were seeded onto coverslips and incubated for 12 hours;subsequently,they were fixed with 4% paraformaldehyde for 20 minutes,permeabilized in 0.02% Triton X-100,and then blocked with 5% bovine serum albumin (Sigma-Aldrich)for 1 hour.Next,the cells were incubated with the primary rabbit anti-NSE monoclonal antibody (1:150,Abcam,Cambridge,UK;Cat# ab 180943;RRID: AB_11031988) or rabbit anti-MAP-2 monoclonal antibody (1:200,Proteintech,Chicago,IL,USA;Cat# 67015-1-Ig;RRID: AB_2882331) overnight at 4°C.Subsequently,the cells were washed with PBS and incubated with the appropriate goat anti -rabbit DyLight 594-conjugated secondary anti body(1:1000,Proteintech,Cat# rba594;RRID: AB_ 2631390) in the dark for 1 hour at 37°C.Then,the cell nuclei were counterstained with 4′,6-diamidino-2-phenylindole (Proteintech) for 30 minutes.Immunofluorescence staining was observed under a fluorescence microscope (TE2000-S,Nikon,Tokyo,Japan).
The mRNA expression levels ofNSEandMAP-2before and after neuronal induction were measured via real-time PCR (RT-PCR).Total cellular RNA was isolated using TRIzol (Invitrogen,Carlsbad,CA,USA).Complementary DNA was obtained by reverse transcription of RNA with the PrimeScript RT Reagent Kit (TaKaRa,Tokyo,Japan).Using the synthesized complementary DNA as a template,PCR was conducted with the following primers:NSEforward,5′-CCC ACT GAT CCT TCC CGA TAC AT-3′ andNSEreverse,5′-CGA TCT GGT TGA CCT TGA GCA-3′;MAP-2forward,5′-CCA TTT GCA ACA GGA AGA CAC-3′ andMAP-2reverse,5′-CAG CTC AAA TGC TTT GCA ACT AT-3′;and glyceraldehyde-3-phosphate dehydrogenase (GAPDH) forward,5′-TTC AGC TCT GGG ATG ACC TT-3′ andGAPDHreverse,5′-TGC CAC TCA GAA GAC TGT GG-3′.Real-time PCR amplification was conducted using a real-time PCR instrument (Funglyn Biotech,Shanghai,China).One microliter of cDNA was used as template in a 10-µL PCR reaction system that included 5 µL of PCR buffer (Western Biotechnology,Chongqing,China),1 µL of forward and 1 µL of reverse primers,and 3 µL of diethyl pyrocarbonate-treated water (Sigma-Aldrich).The amplification conditions were as follows: 94°C for 4 minutes,followed by 30 cycles of 94°C for 20 seconds,60°C for 30 seconds,and 72°C for 30 seconds.The mRNA expression levels ofNSEandMAP-2were determined using the 2–∆∆Ctcalculation method (Xu et al.,2019),and the results were expressed as fold changes relative to the levels ofGAPDH.
Evaluation of FTH1 gene expression
To evaluate the expression ofFTH1before and after neuronal induction of the transduced MSCs,western blotting was conducted in accordance with a previously reported protocol (He et al.,2015).Briefly,cells in each group were harvested and lysed with radioimmunoprecipitation assay buffer (Beyotime)and purified by centrifugation for 15 minutes (14,000 ×g,4°C).The total protein concentration was calculated using the bicinchoninic acid method(Beyotime) (Goldring,2019),and the final concentration was adjusted to 5 g/µL.Each sample was mixed with sodium dodecyl sulfate loading buffer (1:4 ratio) and heated at 95°C for 5 minutes.Protein samples (30 µg each) were separated by sodium dodecyl sulfate-polyacrylamide gel electrophoresis and transferred to polyvinylidene fluoride membranes (Millipore,Madrid,Spain).After the membranes had been blocked with 5% bovine serum albumin in Trisbuffered saline containing Tween-20,they were incubated with rabbit anti-FTH1 anti body (1:1000;Abcam;Cat# ab 183781;RRID: AB_11001434) or rabbit anti-GAPDH antibody (1:1000;Abcam;Cat# ab 181602;RRID: AB_2630358)overnight at 4°C.After three washes in Tris-buffered saline containing Tween-20,the membranes were incubated with the horseradish peroxidasetagged secondary anti body anti -rabbit (1:5000,Abgent,San Diego,CA,USA;Cat# ab11839c;RRID: AB_10819356) for 1 hour at 37°C;they were then visualized with a chemiluminescent detection reagent (Beyotime).The level of FTH1 expression was measured and standardized to the level of GAPDH expression.Additionally,the levels and patterns of FTH1 expression in cells before and after neuronal induction were assayed by immunofluorescence and RT-PCR,using the methods described above for NSE and MAP-2.
Effects of iron loading on cell viability and differenti ation efficiency
Before evaluation of the iron transport efficiency with respect to FTH1 expression,ferric ammonium citrate (FAC) was added into the medium to provide iron for intracellular uptake.To determine the opti mal concentration of FAC,2 × 103MSCs seeded in 96-well plates were treated with 1 × 100,1 ×101,1 × 102,2 × 102,5 × 102,1 × 103,2 × 103,5 × 103,or 1 × 10⁴µM FAC for 72 hours;cell viability was then assayed.Cell viability and cell proliferation in the three groups (MSCs,MSCs/CMV-FTH1,and MSCs/NSE-FTH1) were evaluated at the opti mal concentration of FAC.A Cell Counting Kit-8 method(Dojindo Laboratories,Kumamoto,Japan) was used,in accordance with the manufacturer’s protocol.Briefly,cells were cultured with 10% Cell Counting Kit-8 reagent for up to 4 hours;the optical density of the cells was then measured with a microplate reader (Thermo Fisher Scientific,New York,NY,USA) at a wavelength of 450 nm.The measurements were repeated three times.Differenti ation efficiency was also measured in the three groups (MSCs,MSCs/CMV-FTH1,and MSCs/NSE-FTH1).On images of NSE immunofluorescence,the numbers of NSE-positive and axon-forming cells were counted under 10 randomly selected fields of view.The proportion of these cells to all cells was regarded as the differentiation efficiency.Additionally,cell axon length was calculated using Quanti ty One 4.6 soft ware (Bio-Rad,Hercules,CA,USA).All measurements were conducted three times independently.
Cellular MRI
After treatment with the opti mal concentration of FAC,each group of cells(MSCs,MSCs/CMV-FTH1,MSCs/NSE-FTH1,NLCs,NLCs/CMV-FTH1,and NLCs/NSE-FTH1) was washed with PBS to eliminate free iron,then harvested by trypsinization and centrifugation (1000 r/min,10 minutes).Cell phantoms for MRI were prepared by uniformly embedding 5 × 10⁶cells into 0.5 mL of 1%agarose in 600-µL Eppendorf tubes.A T2-weighted imaging (T2WI) sequence and a multi-echo sequence were performed on a 7.0 Tesla MRI scanning system (Bruker,Karlsruhe,Germany).The scanning parameters were set in accordance with our previously published protocol for cell phantom imaging(Sun et al.,2021).The multi-echo images were postprocessed to obtain T2 maps,which were used to measureR2values within a circular region of interest (ROI).The circular ROI in each group was drawn to cover the enti re cell suspension at the largest possible diameter (~5 mm).Each measurement was repeated three times independently.
Intracellular iron detection
Accumulation of intracellular iron was qualitatively assessed via Prussian blue iron staining in accordance with a previously reported protocol (Cai et al.,2008).Briefly,cells grown on coverslips after 48 hours of treatment with FAC were thoroughly washed and fixed in 4% paraformaldehyde for 30 minutes before staining;the coverslips were then treated with Prussian blue staining solution (Beyotime) for 30 minutes.Cell nuclei were counterstained with Nucleoside red solution (Beyotime).The coverslips were observed by light microscopy (Nikon).
For quantification of intracellular iron content,1 × 105cells per group were subjected to iron measurement by atomic absorption spectrophotometry,in accordance with a previously reported protocol (Cao et al.,2018).At least three measurements were conducted for each sample.The mean iron content per cell is presented in picograms per cell.
In vivo experiments
Nine male Sprague-Dawley rats (age,8 weeks;body weight,~250 g)were randomly divided into three groups (n=3/group) and subjected to intracerebral transplantation of MSCs,MSCs/CMV-FTH1,or MSCs/NSE-FTH1.For each rat,5 × 105cells were prepared by preinduction with 0.5 µM ATRA for 24 hours and suspension in 10 µL of modified neuronal induction medium.The rats were anestheti zed by intraperitoneal injection of 1% pentobarbital sodium (50 mg/kg;Sigma-Aldrich),then positioned on a motorized stereotaxic frame (Beijing Jinyuan Science and Technology Co.,Ltd.,Beijing,China).After the rats’ heads had been shaved,a skin incision was made at the cranial midline,and a tiny hole was drilled 2 mm right of the striatum (bregma coordinates: 3 mm mediolateral,0.4 mm anteroposterior,4 mm dorsoventral).A microsyringe was gently and slowly inserted into the right brain parenchyma(striatum);the cell suspension was then injected over a period of 5 minutes.The syringe was maintained in this position for approximately 5 minutes;it was then carefully removed and the skin incision was sutured.To increase the iron concentration in brain tissue for enhanced cellular uptake,the rats were provided 5 mg/L of FAC in drinking water.
At 1,3,and 7 days after cell transplantation,anestheti zed rats were subjected to MRI examination.T2WI and multi -echo sequences were performed on a 7.0 Tesla MR scanning system.The T2WI scanning parameters were as follows:repeti tion time=2500 ms,echo time=35 ms,matrix=380 × 300,field of view=160 mm,and slice thickness=1.2 mm.The multi-echo parameters were as follows: repeti tion time=2000 ms and echo time=8–200 ms with a step size of 8 ms (25-point T2 mapping);the matrix,field of view,and slice thickness were identical to the parameters used for T2WI.Based on the multi -echo imaging data,T2 maps were acquired and R2 values were measured within ROIs.The minimum ROI size was 50 pixels,covering all areas of low signal intensity in a blinded manner.Each measurement was repeated threetimes independently.
Immediately after MRI examination,the rats were deeply anestheti zed with 3% pentobarbital sodium (Sigma-Aldrich),then sacrificed by asphyxiation with a high concentration of CO2(95%,5 L/min).The brains were extracted,fixed in 4% paraformaldehyde,dehydrated in alcohol and xylol,embedded in paraffin,and sliced into 4-µm-thick sections.The accumulation of iron in brain tissue was detected by Prussian blue staining.Additionally,iron content in brain tissue was quantified using the method described above.Three measurements were conducted for each sample,and the mean iron content was expressed in milligrams per gram.
Stati stical analysis
No statistical methods were used to predetermine sample sizes;however,our sample sizes were similar to the numbers of animals used in a previous study (Minn et al.,2015).No rats were excluded from this analysis.Each test was repeated at least three times;the quantitative data are shown as means ± standard deviations (SDs).These data were analyzed using GraphPad Prism 5.01 (GraphPad Software,Inc.,San Diego,CA,USA) and SPSS 17.0 statistical software (SPSS Inc.,Chicago,IL,USA).Student’st-test was used for comparisons between experimental and control groups.Multiple group comparisons were performed using one-way analysis of variance,followed by Tukey’spost hoctest.P-values <0.05 were considered stati stically significant.
Results
Lenti viral construction and transduction
To ensure FTH1 was expressed only when MSCs differentiated into NLCs,FTH1 expression was controlled by theNSEpromoter.PCR confirmed that the length of the recombinantFTH1andNSEmRNA construct was between 2000 and 3000 bp (Figure 1B),which was consistent with the sum of their individual lengths.Furthermore,gene sequencing confirmed that the sequences of theFTH1gene andNSEpromoter were correct (Additional file 1).Green fluorescence was observed after transduction in 293T cells,indicating successful virus packaging.Assessments of fluorescence intensity and cell state (Figure 1C) after transduction revealed that the best MOIs of CMV-FTH1 and NSE-FTH1 for MSCs were 15 and 10,respectively.MSCs/CMVFTH1 and MSCs/NSE-FTH1 were constructed by transducing the recombinant lenti virus CMV-FTH1 or NSE-FTH1 into MSCs at the selected MOIs.
Identification of MSCs and NLCs
Microscopy showed that MSCs had a triangular or spindle-like morphology(Figure 2A).Flow cytometry revealed that 99.8% and 97.4% of MSCs expressed CD29 and CD44,respectively,whereas 0.26% and 0.84% of MSCs expressed CD34 and CD45,respectively.These findings were consistent with the surface anti gen profile of MSCs (Figure 2B).
After neuronal induction,the cells became more transparent,and the cytoplasm contracted toward the nucleus.Additionally,most cells exhibited long and thin processes that were connected to adjacent cells.These morphological features were consistent with neuronal morphology (Figure 2A).Immunofluorescence assays showed that the neuron-specific markers NSE and MAP-2 were expressed in all three groups of cells after neuronal induction,whereas they were not expressed before neuronal induction (Figure 2C).PCR showed the mRNA levels of NSE and MAP-2 were both higher in postinduction cells (NLCs,NLCs/CMV-FTH1,and NLCs/NSE-FTH1) than in preinduction cells (Figure 2D).
Specific induction of reporter gene expression by NSE promoter after neuronal differenti ation
The mRNA or protein expression ofFTH1in each group of cells was determined by PCR,western blotting,or immunofluorescence staining.PCR revealed remarkably greater mRNA expression ofFTH1in NLCs/NSE-FTH1 than in MSCs/NSE-FTH1.No considerable differences were found in the mRNA expression ofFTH1between MSCs and NLCs or between MSCs/CMVFTH1 and NLCs/CMV-FTH1 (Figure 3A).The results of western blotting and immunofluorescence staining were consistent with the results of PCR (Figure 3BandC).The above findings suggested that theNSEpromoter specifically induced reporter gene expression after neuronal differenti ation,whereas the CMV promoter induced constitutive reporter gene expression (i.e.,regardless of neuronal differenti ation).
Lack of changes in cell viability or differenti ation efficiency according to FTH1 expression or iron transport
FAC affected cell viability in a concentration-dependent manner.As the concentration of FAC increased,cell viability decreased;it began rapidly decreasing at a concentration of 200 µM FAC,which was subsequently selected as the optimal concentration of FAC (Figure 4A).During 96 hours of culture with the optimal concentration of FAC,no differences in cell proliferation were observed among the three groups of preinduction MSCs(Figure 4B).Additionally,no differences in the neuronal differentiation rate were observed among the three groups,regardless of FAC treatment (Figure 4C).The mean axonal length also did not significantly differ among the three groups after neuronal differenti ation,regardless of FAC treatment (Figure 4D).These data indicated that neither cell proliferation nor neuronal differenti ation was affected by FTH1 expression and/or its effect on iron transport.
Changes in cellular MRI contrast according to NSE promoter acti vity
The MRI signal contrast of MSCs before and after neuronal differentiation was evaluated by T2WI and multi-echo sequences.As shown inFigure 5AandB,compared with MSCs/NSE-FTH1,NLCs/NSE-FTH1 showed remarkably decreased T2WI signal intensity and remarkably increased R2values.However,no differences in T2WI signal intensity or R2values were found between MSCs and NLCs or between MSCs/CMV-FTH1 and NLCs/CMV-FTH1.
Accumulation of intracellular iron caused by activation of NSE promoter
The FTH1-induced accumulation of intracellular iron was qualitatively analyzed via Prussian blue staining and quanti tively assayed via cellular iron measurements.Prussian blue staining revealed greater accumulation of intracellular iron particles in MSCs/CMV-FTH1,NLCs/CMV-FTH1,and NLCs/NSE-FTH1,compared with MSCs,MSCs/NSE-FTH1,and NLCs,respectively(Figure 5C).These results were consistent with thein vitroMRI findings,indicating that theNSEpromoter was activated by neuronal differenti ation and therefore induced FTH1 expression,which led to accumulation of intracellular iron.Quanti tative analysis revealed remarkably higher intracellular iron content in postinduction cells (NLCs/NSE-FTH1) than in preinduction cells (MSCs/NSEFTH1).No significant differences were observed between MSCs and NLCs or between MSCs/CMV-FTH1 and NLCs/CMV-FTH1 (Figure 5D).
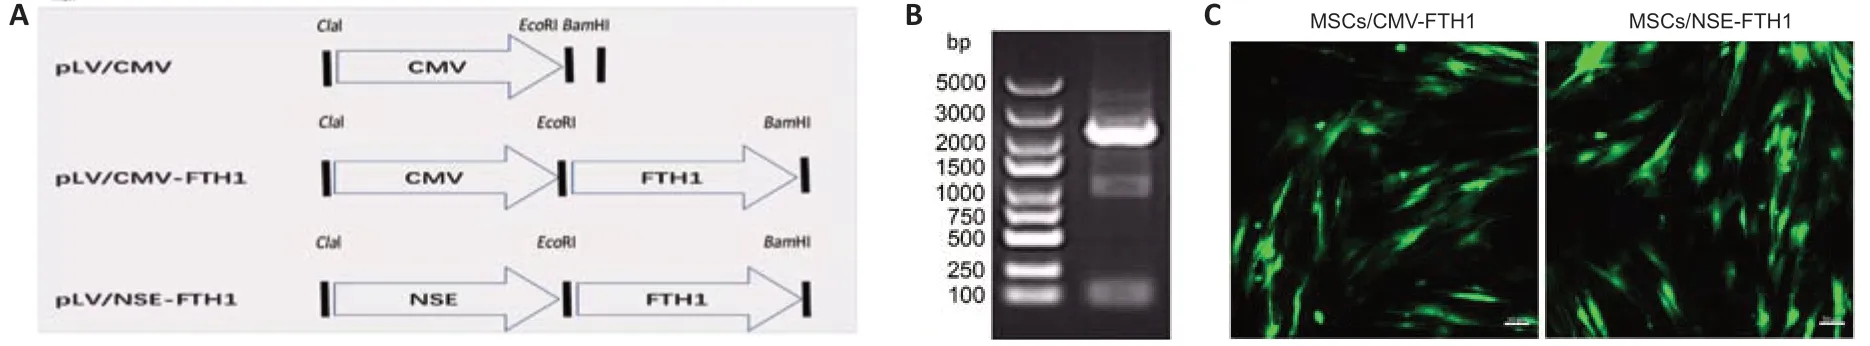
Figure 1|Lenti viral construction and mesenchymal stem cell transduction.
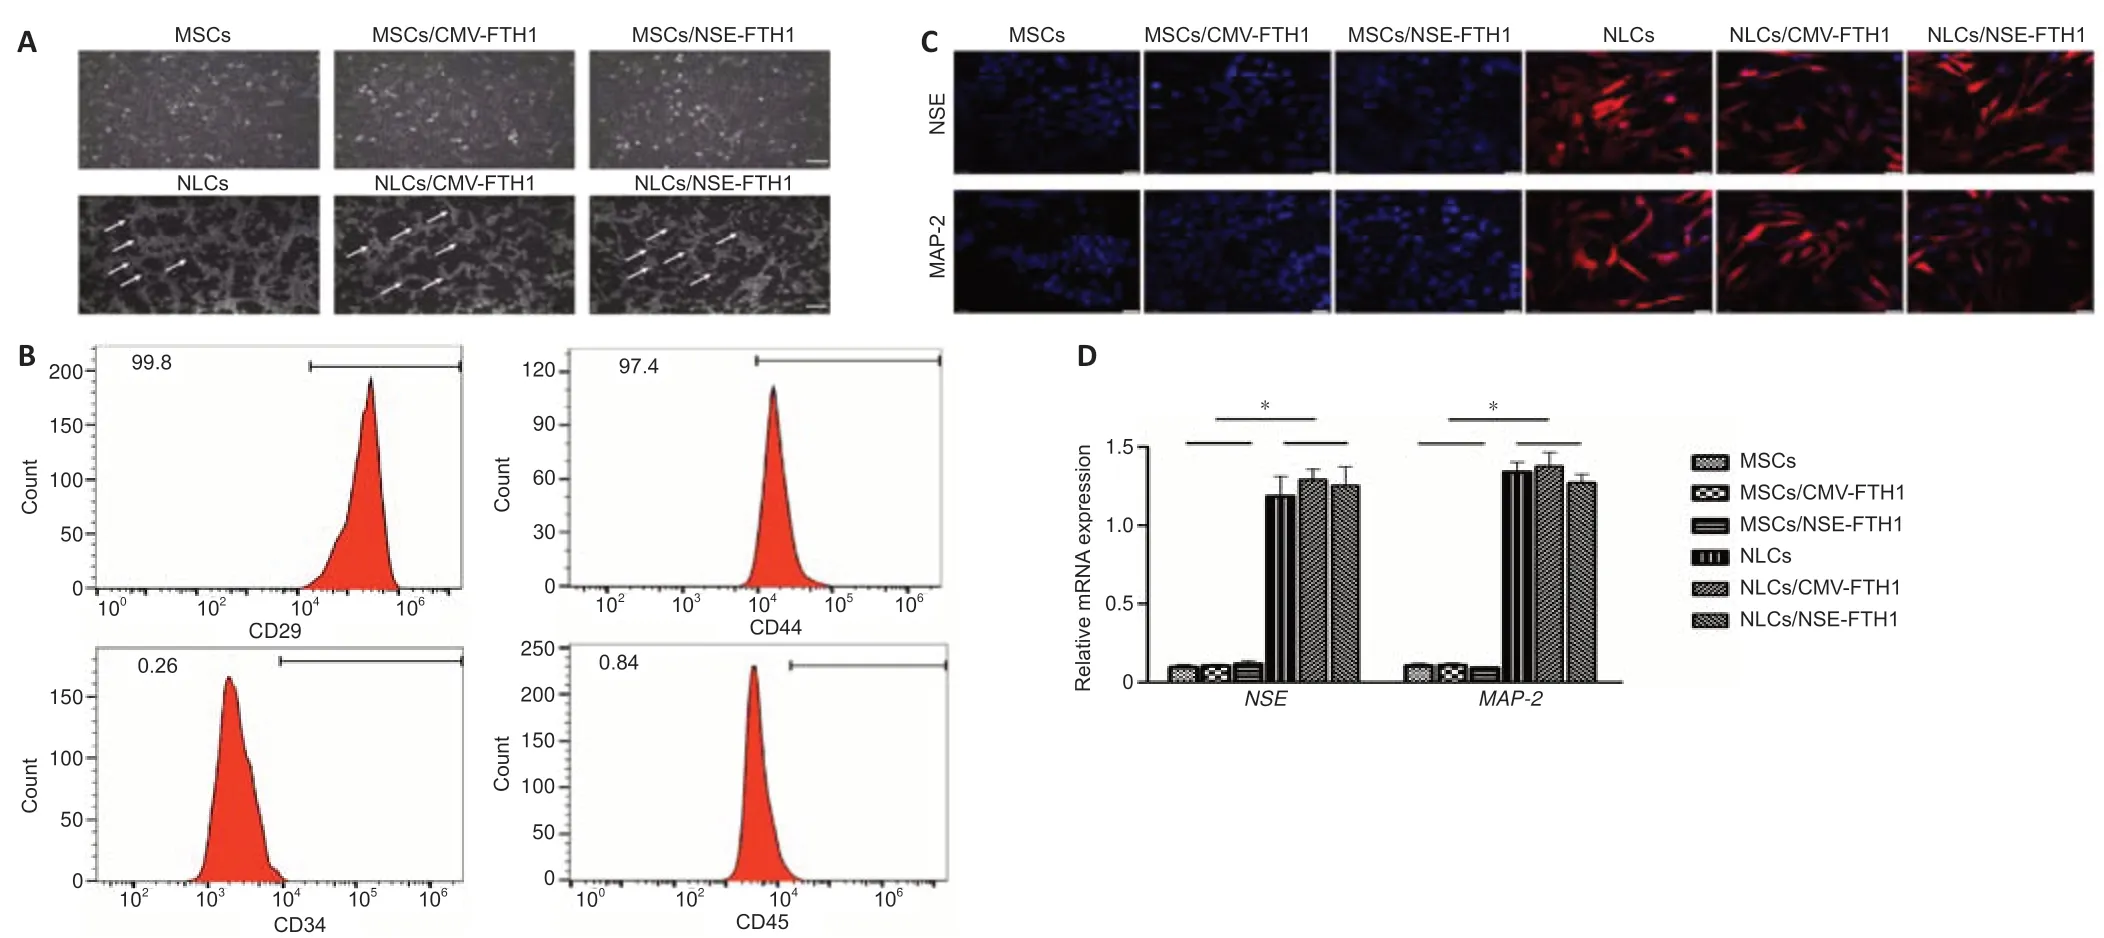
Figure 2|Identification of MSCs and NLCs.
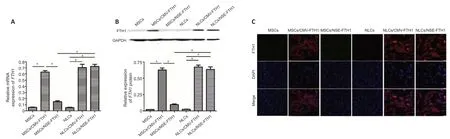
Figure 3|FTH1 expression in cells before and after neuronal differenti ation.
Rat MRI validation
MRI examinations were performed after intracerebral transplantation of the three groups of cells.In the MSCs/CMV-FTH1 group,the T2WI signal intensity remarkably decreased (Figure 6A) at 3 and 7 days after cell transplantation,whereas the R2values did not significantly change between the two time points (Figure 6B).However,in the MSCs/NSE-FTH1 group,the T2WI signal intensity moderately decreased at 3 days but remarkably decreased at 7 days(Figure6A),and there was a significant difference in R2values between 3 and 7 days after cell transplantation (Figure 6D).The difference in MRI signal between 3 and 7 days in the MSCs/NSE-FTH1 group could have resulted from differences in neuronal differenti ation among the transplanted cells.Prussian blue staining revealed numerous iron particles distributed in brain tissue at both 3 and 7 days after cell transplantation in the MSCs/CMVFTH1 group (Figure 6C).Iron content did not significantly differ between the two time points (Figure 6D),which was consistent with the findings of rat MRI examinations.In the MSCs/NSE-FTH1 group,few iron particles were observed at 3 days,whereas numerous iron particles were detected at 7 days(Figure 6C).The tissue iron content was remarkably different between 3 and 7 days after cell transplantation (Figure 6D).These results showed thatNSEpromoter-driven FTH1 expression was dependent on neuronal differenti ation,whereas CMV-driven reporter gene expression could not indicate whether cells had undergone differenti ation.
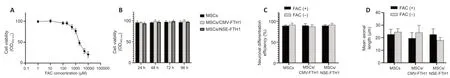
Figure 4|Effects of iron on the proliferation and differenti ation of MSCs.
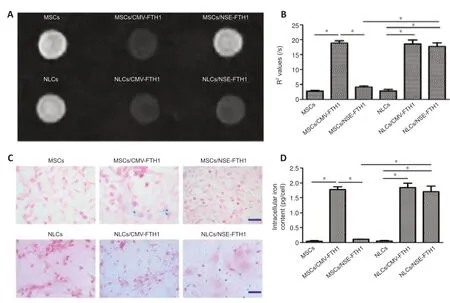
Figure 5|In vitro MRI analysis and iron assay before and after neuronal differenti ation.
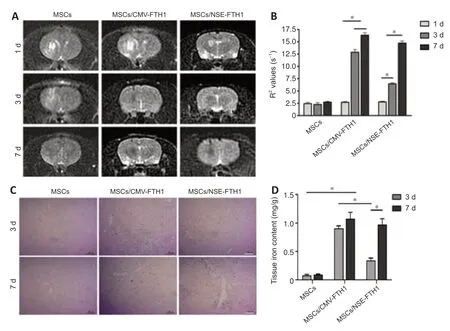
Figure 6|In vivo validation of magnetic resonance imaging for assessment of stem cell differenti ation-induced reporter gene expression.
Discussion
In stem cell-based therapies,transplanted cell monitoring is necessary to understand cell fate (James et al.,2021;Zhang et al.,2021).In this study,we sought to noninvasively detect neuronal differenti ation in stem cells;we developed an activatable reporter gene system in which the neuron-specific promoterNSEacted as a genetic switch that controlled the expression of FTH1.This system allowed cell type-dependent expression of the reporter gene,whereby the reporter gene was initi ally silenced but became activated when the cells underwent neuronal differentiation.To our knowledge,this is the first study to uti lize NSE as a promoter to induce FTH1 expression and facilitate MRI-based monitoring of neuronal differentiation in MSCs.Our findings indicated that FTH1 expression was remarkably increased after stem cells had undergone neuronal differenti ation;the resulting intracellular iron content was sufficient for detection by MRI.In combination with this novel reporter gene system,MRI can be used to determine whether and/or when cell differenti ation occurs after the original stem cells are transplanted;this approach will facilitate broader implementation of stem cell replacement therapies.
In the past 10 years,there has been increasing evidence that MSCs can differenti ate into neuronal cells in a particular biological environment (Bi et al.,2014;Mu et al.,2018;Shokati et al.,2021;Rahmani-Moghadam et al.,2022).Various strategies have been used to induce stem cells to undergo neuronal differentiation (Bi et al.,2014;Shokati et al.,2021;Rahmani-Moghadam et al.,2022).In this study,to improve neuronal differenti ation efficiency,MSCs were pretreated with 1 mmol/mL ATRA for 24 hours and then cultured with modified neuronal induction medium.After this two-step neuronal induction method,the induced cells exhibited a morphology similar to neuronal morphology;they also expressed particularly high levels of NSE and MAP-2,consistent with previously reports (Bi et al.,2010;Mu et al.,2018).Although the induced cells were similar to neurons in terms of morphology and some cellular markers,they remain distinct from true neurons.Thus,we regard them as NLCs.Although these induced cells can promote functional recovery in rats with brain injury (Liu et al.,2008),their true functionsin vivoand their abilities to establish reciprocal connections with host neurons remain unknown.In the present study,after pretreated MSCs had been transplanted into rat striatum for 3 days,Prussian blue staining revealed accumulation of intracellular iron,which may be a result of NSE expression;this finding indicated that the grafted cells had begun to differentiate into NLCs.The duration of time needed forin vivodifferenti ation differed from the duration of time needed forin vitrodifferenti ation.This difference may be attributed to differences in the environments in which the cells were induced.
Cell differentiation involves the selective expression of genes in time and space,where the expression of different genes is switched on or off,with effects on the production of marker proteins (Li et al.,2022;Wang et al.,2022).Some specific promoters are closely involved in cell differentiation processes and play key roles in determining cell lineage commitment by controlling the expression patterns of specific genes.In this context,a tissuespecific promoter could be used for specific induction of reporter gene expression in cells or tissues of interest.In this study,we sought to achieve real-time monitoring of neuronal differenti ation in stem cells;this required identifying a gene that was specifically expressed in neuronal cells,then using its promoter to induce reporter gene expression.Genes specifically expressed in neuron cells include synaptic protein 1 (synapsin),doublecorti n,and NSE (Hwang et al.,2008;Pohlkamp et al.,2014;Tennstaedt et al.,2015;Yun et al.,2018).As a protein present in synaptic vesicles,synaptic protein 1 is upregulated in mature neurons.It is nearly undetectable in the initi al phase of neuronal differentiation in stem cells,which suggests that the use of a synaptic protein 1-driven reporter gene may not enable the early detection of neuronal differenti ation in stem cells (Tennstaedt et al.,2015).Doublecortin is a specific marker in the early phase of neuronal differenti ation,but it is nearly undetectable in differenti ated mature neurons.Therefore,the doublecortin promoter cannot drive reporter gene expression in mature neuronal cells (Tennstaedt et al.,2015).NSE is highly active in both immature and mature nerve cells (Pohlkamp et al.,2014);its promoter is ideal for use in a reporter gene imaging strategy to achieve noninvasive detection of neuronal differenti ation.In the present study,the NSE promoter was used to control FTH1 expression,then compared with expression under the CMV promoter,during neuronal differenti ation in stem cells.Our results indicated that FTH1 expression was remarkably higher in NLCs/NSE-FTH1 than in MSCs/NSEFTH1;it was also comparable between NLCs/NSE-FTH1 and NLCs/CMV-FTH1,suggesting that similar activation of FTH1 expression could be achieved by the NSE promoter and the CMV promoter during neuronal differenti ation in stem cells.
For the tissue-specific reporter imaging strategy,changes in the imaging signal were determined by promoter acti vity.Our results showed clear changes in the MRI signal after stem cells had undergone neuronal differentiation.In vitroanalyses showed a significant decrease in the MRI signal in NLCs/NSEFTH1,compared with MSCs/NSE-FTH1,consistent with the results of western blotting and Prussian blue staining.However,the MRI signal did not differ between NLCs/CMV-FTH1 and MSCs/CMV-FTH1.These results demonstrated that FTH1 expression was successfully induced by the NSE promoter,which is only activated in cells that have undergone neuronal differenti ation.Forin vivoanalyses,transgenic MSCs pretreated with ATRA were engrafted into the rat striatum.In the MSCs/CMV-FTH1 group,the MRI signal was remarkably lower than the signal in the control group,and no difference was found between 3 and 7 days after cell transplantation.However,in the MSCs/NSEFTH1 group,the MRI signal intensity moderately decreased at 3 days but remarkably decreased at 7 days after cell transplantation.These differences in signal dynamics between the two groups could be attributed to the NSE activation status.In the MSCs/CMV-FTH1 group,the CMV promoter was not influenced by cell differentiation status,and the reporter gene was constitutively expressed regardless of cell differentiation.However,in the MSCs/NSE-FTH1 group,FTH1 expression was driven by the NSE promoter;its acti vity was influenced by cell differenti ation status.The difference in the MRI signal between 3 and 7 days in the MSCs/NSE-FTH1 group could be the result of differences in NSE activation during the progression of neuronal differenti ation.
Although the findings provided preliminary confirmation of the feasibility of MRI-based detection of neuronal differenti ation by promoter-driven reporter gene expression,this study had some limitations.First,to confirm the effect of reporter gene expression on intracellular iron transport,we added a specific concentration of FAC to cells or tissuesin vitroandin vivo;this provided a sufficient source of iron for intracellular iron uptake,thereby enabling MRI contrast generation.Such an arti ficial iron environment can be used in animal experiments to compensate for the low sensiti vity of iron detection by MRI,but it is not appropriate for clinical applications of reporter gene imaging strategies (He et al.,2015;Sun et al.,2021).As new technologies become available,we expect that new-generation MRI will have sufficient sensiti vity to detect the accumulation of intracellular iron caused by reporter gene expression in the context of endogenous iron concentrations;this sensiti vity should be investigated in future studies.Second,because the main purpose of ourin vivoexperiment was to confirm the feasibility of MRI-based detection of stem cell differentiation-induced reporter gene expression,and because of animal welfare considerations,we did not conduct additional assessments of stem cell fate.Future longitudinal studies are needed to assess the differenti ation of grafted cells into NLCs,the survival of those cells,and the ability of those cells to integrate into (and function within) normal neuraltissue.Third,we only used a two-step method to induce MSC differenti ation into NLCs;in this method,theNSEpromoter was used to initiate reporter gene expression.However,in clinical applications,stem cells from diverse sources may differentiate into nerve cells with various functions,such as cholinergic and dopaminergic cells (Tantrawatpan et al.,2013;Kirkeby et al.,2017;Han and Hu,2020;Stricker et al.,2021);other cell-specific promoters will be needed to drive the reporter gene expression in those cells.Finally,only male rats were used in thein vivoexperiment to maintain consistency betweenin vivoandin vitroexperiments (we extracted MSCs from male rats for thein vitroanalysis),and to reduce immune rejection after cell transplantation.Future studies should use female rats to determine whether this reporter system is influenced by sex-related differences.
In conclusion,we established a reporter system in which expression of theFTH1gene was controlled by a neuron-specific promoter,then used the system to confirm the feasibility of MRI-based detection of neuronal differenti ation in stem cells.In this reporter system,the reporter gene was initially silenced but became activated when the cells underwent neuronal differentiation.This differential expression allowed differentiation-based activation of the reporter gene and enabled MRI to sensitively detect the onset of neuronal differentiation in stem cells.This neuron-specific MRI monitoring system could facilitate broader use of stem cell-based therapeutic strategies by noninvasively indicating whether and/or when stem cells undergo neuronal differenti ation.
Acknowledgments:We are grateful to the Key Laboratory of Pediatrics in Chongqing for providing parts of the experimental apparatus.
Author contributions:Study conception and design: JHC;sample preparation and processing: XYH,YRZ,YFL;cell preparation: XYH,YRZ,TM,YFL;dataacquisition,analysis,and interpretation: XYH,YRZ,TM,YFL;stati stical analysis:XYH,YRZ,TM;manuscript draft ing: XYH,YRZ;experiment study: XYH,YRZ,TM,YFL,YQ,LJ;study supervision: JHC.All authors reviewed and approved the final version of the manuscript.
Conflicts of interest:The authors have no conflicts of interest to disclose.
Availability of data and materials:All data generated or analyzed during this study are included in this published article and its supplementary information files.
Open access statement:This is an open access journal,andarticles are distributed under the terms of the Creative Commons AttributionNonCommercial-ShareAlike 4.0 License,which allows others to remix,tweak,and build upon the work non-commercially,as long as appropriate credit is given and the new creations are licensed under the identical terms.
Additional file:
Additional file 1:The sequences of the FTH1 gene and NSE promoter.

- 中国神经再生研究(英文版)的其它文章
- Bystanders or not? Microglia and lymphocytes in aging and stroke
- Alzheimer’s disease risk after COVID-19: a view from the perspective of the infecti ous hypothesis of neurodegeneration
- Serine and arginine rich splicing factor 1: a potenti al target for neuroprotection and other diseases
- Can glial cells save neurons in epilepsy?
- Lights for epilepsy: can photobiomodulation reduce seizures and offer neuroprotection?
- The landscape of cognitive impairment in superoxide dismutase 1-amyotrophic lateral sclerosis