
Computational Modeling of Intergranular Crack Propagation in an Intermetallic Compound Layer
2023-02-26 10:18TongAnRuiZhouFeiQinPeiChenYanweiDaiandYanpengGong
Tong An,Rui Zhou,Fei Qin,Pei Chen,Yanwei Dai and Yanpeng Gong
1Institute of Electronics Packaging Technology and Reliability,Faculty of Materials and Manufacturing,Beijing University of Technology,Beijing,100124,China
2Beijing Key Laboratory of Advanced Manufacturing Technology,Beijing University of Technology,Beijing,100124,China
ABSTRACT A micromechanical model is presented to study the initiation and propagation of microcracks of intermetallic compounds (IMCs) in solder joints.The effects of the grain aggregate morphology,the grain boundary defects and the sensitivity of the various cohesive zone parameters in predicting the overall mechanical response are investigated.The overall strength is predominantly determined by the weak grain interfaces; both the grain aggregate morphology and the weak grain interfaces control the crack configuration; the different normal and tangential strengths of grain interfaces result in different intergranular cracking behaviors and play a critical role in determining the macroscopic mechanical response of the system.
KEYWORDS Cohesive zone element;intergranular cracking;polycrystalline material;intermetallic compound(IMC)
Nomenclature
aithe coordinates of the nuclei
Athe area of the IMC layer
Aelthe area of the cohesive interface element
bithe coordinates of the nuclei
Dlocthe cohesive constitutive tangent stiffness matrix
Ethe Young’s modulus
Felthe nodal force vector of the interface element
Gcthe critical energy release rate
H the matrix of the shape function
J the Jacobian matrix
knthe unloading/reloading stiffness in the normal direction
ktthe unloading/reloading stiffness in the tangential direction
Kelthe tangential stiffness of the interface element
KIthe stress intensity factor
Lthe width of the IMC layer
Nthe shape function
pia nucleus
Pa set ofnnucleus in a plane
qthe coupling parameter
rthe coupling parameter
tmthe average thickness of the IMC layer
T the traction vector
ΔTnthe increment of the normal traction
Tnthe normal traction component
Tn,maxthe maximum normal traction
ΔTtt he increment of the tangential traction
Ttthe tangential traction component
Tt,maxthe maximum tangential traction
Tlocthe local traction vector
uIthe nodal displacement vector
utopIthe nodal displacements of the top nodes
ΔuIthe relative displacements between each pair of the nodes
Δulocthe local separating displacement vector
Wthe width of the cohesive interface element
xithe center points of each regular hexagon
XIthe initial coordinates of the nodes on the mid-line
yithe center points of each regular hexagon
κthe Weibull parameter
νthe Poisson’s ratio
Θthe transformation matrix
αthe contact stiffness
δthe separating displacement vector
δcr,nthe critical normal separating displacement
δnthe normal separating displacement
Δδnthe increment of the normal separating displacement
δcr,tthe critical tangential separating displacement
δtthe tangential separating displacement
Δδtthe increment of the tangential separating displacement
the value ofδnafter complete shear separation
δtolthe specific penetration tolerance
λthe Weibull parameter
φnthe cohesive energy under the pure mode-I(opening)
φtthe cohesive energy under the pure mode-II(shearing)
ξthe local element coordinate
IMC intermetallic compounds
UEL user subroutine to define an element in the finite element code ABAQUS
VCFEM Voronoi cell finite element model
1 Introduction
Solder joint is a key factor affecting the electrical,thermal,and mechanical performance of electronic packages.At the solder joint-Cu pad interface,the intermetallic compound(IMC)is crucial for forming a functional metallurgical bonding.However,excessive growth of IMC layer is considered to be an initiation site for microcracks,which will degrade the mechanical strength of the solder joint[1].To achieve improved performance,effective modeling for understanding the failure mechanism of the IMC layer in the solder joint is indispensable for the reliable design of electronic packages.
As a polycrystalline quasi-brittle material,the morphological characteristics of the IMC microstructure,such as the grain shape,size and defects,have a great influence on the failure mechanism of the IMC.However,most of the previous research [2,3] focused on the macroscopic failure behavior,not the microstructural damage evolution of the IMC.These works cannot account for the microstructure characteristics of the IMC and the grain boundary defects with random distribution in the IMC layer.As a result,finite element (FE) analysis results are not consistent with the experimental results.Therefore,a model accounting for the microstructure-based mechanism of IMC failure is important for understanding the micromechanical behavior of the IMC layer that controls the macroscopic response.
Some efforts have been made to develop an effective numerical procedure to describe material intergranular cracking in polycrystalline brittle material using the FE analysis[4,5].With such models,the explicit discrete nature of the polycrystalline microstructure was retained,and the interface elements were applied to simulate the intergranular cracking behavior.The material failure in these models was not limited by specific fracture criteria; therefore,the initiation and propagation of microcracks were a natural outcome of the material response,the boundary constraints and the applied loading.
The three essential factors of the method are the geometric characterization of microstructure of polycrystalline materials,the description of the grain boundary defects and the numerical simulation of the grain interface behavior.
Geometric representation of grain microstructure.Typically,regular or irregular microstructures are generated in numerical modeling to reflect the geometry of polycrystalline structures on the microscopic scale.For example,Onck et al.[6]used regular hexagonal grains to study intergranular creep cracking of polycrystalline materials.In addition,a voronoi cell finite element model(VCFEM)which can be used to simulate the arbitrary microstructure of a multiphase material was proposed by Ghosh et al.[7].Two-dimensional voronoi tessellations were applied to generate a micromechanical model for describing the brittle compressive fracture of polycrystalline ice [8,9].Furthermore,the voronoi tessellation-based simulation was extended to three-dimensional modeling,which was employed to study the cracking process of brittle ceramics[10]and to account for the heterogeneity of polycrystalline materials[11,12].Both regular and irregular microstructures have been extensively used in computational materials science [13–16].In this analysis,regular hexahedral grains and irregular polygonal grains are established and applied to study the influence of the grain aggregate morphology on the crack configuration and the overall response.
Grain boundary defects.It has been realized that the existence of pre-existing flaws at grain boundaries have great influence on the mechanical properties of polycrystalline materials [17,18].Therefore,grain boundary defects should be considered in the model[4,14].In this analysis,the grain interface properties are described by a Weibull distribution to account for the grain boundary defects,and their influence on the crack configuration and the overall response is discussed.
Numerical modeling of grain interface behavior.The constitutive description of the grain interface should account for the relevant physical mechanisms,such as grain boundary sliding,separation,and microcracking by coalescence.The cohesive zone model has been considered a feasible tool for describing the debonding behavior of material interfaces.The concept of the cohesive zone model was originally proposed by Barenblatt[19]and Dugdale[20].Needleman[21]used the traction-separation relationship specified by the cohesive zone law to investigate void nucleation and fracture growth at particle-matrix interfaces.In this analysis,the cohesive interface element is applied,and the behavior of the element is governed by the cohesive zone law.
The parameters of the cohesive zone law play a crucial role in determining the macroscopic mechanical response of materials.The magnitudes of the parameters vary widely,ranging from MPa to GPa for traction,J to kJ for energy,and nm to mm for separating displacement.The effect of various parameters in the cohesive zone law on the macroscopic failure of materials has been examined in the literature[22–25].It is commonly believed that the failure behavior is dominated primarily by the energy that controls separation;thus,cohesive energy is the most important parameter.The question raised here is as follows:Can changing the maximum traction applied at the grain interfaces change the micro and macro mechanical response of a polycrystalline material,even if the cohesive energy is the same?To answer the question,we compared the predictions of the models with different maximum tractions applied in the normal and tangential directions of grain interfaces.
In this paper,a micromechanical model of an IMC layer is constructed.The polycrystalline microstructure is represented by the polygonal grains generated by voronoi tessellation.The cohesive zone elements,which are carried out by using a user-defined subroutine (UEL) in ABAQUS,are embedded along the grain interfaces to simulate the microcrack cracking process.The influence of the grain aggregate morphology,stochastically distributed grain boundary defects,and various cohesive zone parameters on the overall mechanical response and failure behavior are considered and discussed.
2 Grain-Level Micromechanical Model of the IMC Layer
2.1 Microstructure of the IMC
Fig.1 presents a schematic diagram of the cross-section of a solder joint.The Cu6Sn5η-phase and Cu3Snε-phase are the two phases formed between the Cu substrate and the Sn-based solder during the soldering and aging process.Before aging,only a layer of Cu6Sn5was observed,and the Cu3Sn was too thin to be observed(Fig.2a).The solder/IMC interface showed scallop shape and was extremely rough.After isothermal aging,an IMC layer consisting of both the Cu6Sn5and Cu3Sn layers can be observed.Both layers became thicker and the solder/IMC interface became more planar(Fig.2b)[26].Figs.2c and 2d show the SEM micrographs of the Cu6Sn5grains.Before aging,the Cu6Sn5grains appeared to be round-like,and typical polygonal Cu6Sn5grains can be observed after isothermal aging.According to experimental observations,delamination and cleavage of the IMC mainly occur in the layer of Cu6Sn5grains,and the Cu3Sn grains remain mostly intact[27].This suggests that we should pay more attention to the Cu6Sn5layer rather than the Cu3Sn layer when modeling the solder joint.
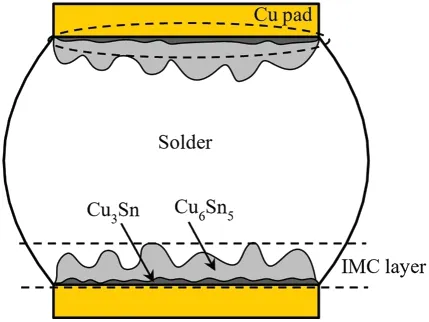
Figure 1:Schematic diagram of solder joint section
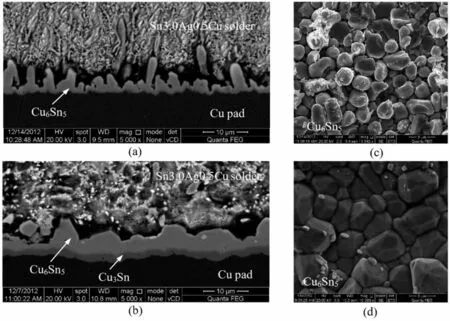
Figure 2:SEM images of the Sn3.0Ag0.5Cu/Cu interface aged at 150°C for(a)0 h,(b)500 h and the top views of the IMC layer aged for(c)0 h and(d)500 h
2.2 Geometrical Features of Grain-Level Modeling
Voronoi tessellation is widely applied to generate the geometry of the grain microstructure of polycrystalline materials[28,29].Supposepiis a point in a plane that can be called a nucleus,andPrepresents a set ofnpoints.To divide the plane intoncells,the voronoi tessellation ofPis
whereqis a point lying in the cell,and d(q,pi)denotes the Euclidean distance betweenqandpi.
The shape and aggregate morphology of the grains are defined by the nuclei;thus,the distribution of nuclei should be predefined carefully.The center points of the regular polygon were (xi,yi).The coordinates of the nuclei(ai,bi)were chosen randomly around the center points,which wereai∈(xi−αxi,xi+αxi)andbi∈(yi−βyi,yi+βyi).Theαandβwere applied to control the location of the nucleus within the polygon.Here,the models of regular polygon(Fig.3a)and irregular polygon(Fig.3b)are established.The vertex coordinates of the cells generated by MATLAB,and the geometric model of the polycrystalline microstructure were established by Python scripting language and ABAQUS/CAE.
2.3 Constitutive Behavior of the Cohesive Zone Element
Cohesive zone law.A cohesive zone law is described by the relation between the traction T on the interface and the corresponding separating displacementδ[30–32].Here,a modified exponential cohesive zone law [33] was applied,as shown in Fig.4.The normal tractionTnand the tangential tractionTtare expressed as
whereδnandδtare separating displacements in the normal and tangential directions,respectively;δcr,nandδcr,tare the critical separating displacements;ΔδnandΔδtare the increments of the separating displacement;φnandφtare the cohesive energies under opening and shearing failure,respectively.The modified cohesive zone law preserves most features of the original exponential cohesive zone law proposed by Xu et al.[30] and includes a more advantageous controllable coupling effect.This modified cohesive zone law describes the mixed-mode decohesion process better and provides the possibility to account for different values forφnandφt[33].
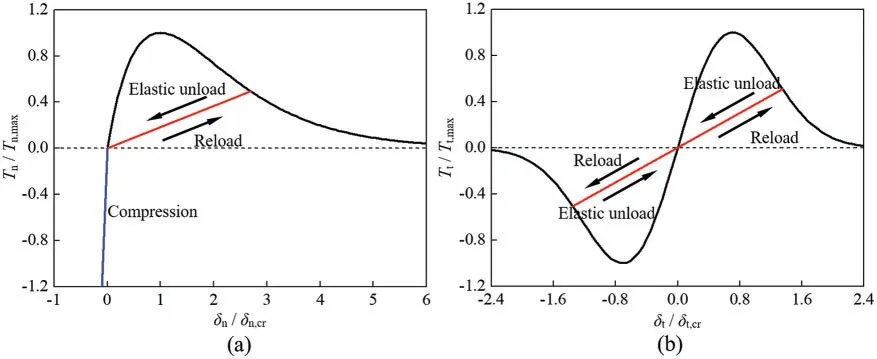
Figure 4:The cohesive zone law:(a)The normal traction-separation relationship;(b)The tangential traction-separation relationship
Unloading and reloading.In the cohesive zone element,after the maximum traction is reached,the cohesive zone element shows an irreversible response,and the traction-separation curve for unloading/reloading shows an elastic relation,as shown in Fig.3,i.e.,
whereΔTnandΔTtare the increments of the normal and tangential tractions,respectively,andknandktare the unloading/reloading stiffnesses in the normal and tangential directions,respectively.
Compression.When the cohesive zone element is under compression,the interpenetration of the two volume elements which connected by the cohesive zone elements may occur.To ensure that the interpenetration is tolerable,some efforts have been made,including applying a contact algorithm at the interfaces[34],choosing the normal stiffness value carefully[35],and modifying the constitutive equation in compression[36].Here,when the normal displacement is negative,an extra compressive tractionTcis applied,i.e.,ifδn<0,
whereαis the contact stiffness andδtolis a specific interpenetration tolerance.This extra compressive traction improves the compressive capacity of the cohesive zone element,and interpenetration can be prevented.
2.4 Cohesive Zone Element
The cohesive zone element connects the two adjacent volume elements during the fracture process.In this section,the basic formulation of the cohesive interface element used in this paper is presented[37,38].
Fig.5 shows a two-dimensional quadrilateral cohesive zone element with two integration points,four nodes,and a local element coordinateξ(−1≤ξ≤1)defined along the midline of the element.The initial thickness of the cohesive zone element is zero,as shown in Fig.5a.When the adjacent volume elements deform,the two surfaces of the cohesive zone element separate,and the midline deforms.Another local coordinate system (n,t) connected with the deformed midline is defined in order to describe the traction-separation relation,as shown in Fig.5b.
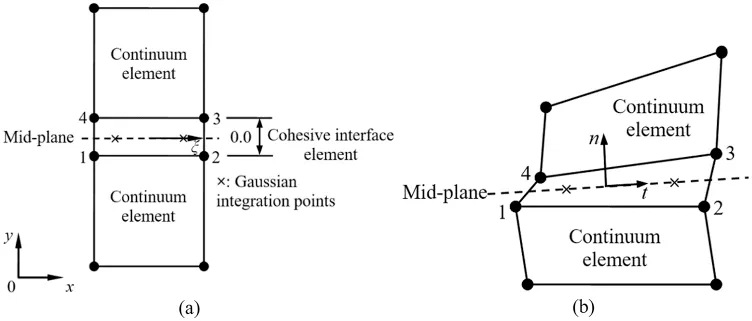
Figure 5: The cohesive interface element in (a) The initial configuration and (b) The deformed configuration
The nodal displacement vector of the four-node cohesive zone element is
The nodal displacements of the bottom and top nodes are
The separating displacement of the element is then expressed as
The continuous separating displacement field within the element is
With
where H(ξ)is a matrix of the shape function.
The nodal force vector is
where the tractions,T,are computed from the separating displacements via the cohesive zone law,which is shown in Section 2.3,andAelis the area of the cohesive zone element.The tangential stiffness is computed by
where D is the cohesive constitutive tangent stiffness matrix derived by differentiating the traction with respect to the separation.
3 Result and Discussion
3.1 Effect of the Grain Aggregate Morphology on the Failure Behavior
Two-dimensional finite element models including a Cu pad,Sn3.0Ag0.5Cu solder and Cu6Sn5grains were constructed,as presented in Fig.5.To investigate the effect of the grain aggregate morphology,voronoi tessellations were utilized to generate three models with different shape coefficients:Model I withα1=β1=0 (Fig.6a),Model II withα2=β2=0.3 (Fig.6b),and Model III withα3=β3=0.9 (Fig.6c).An increase in the coefficientsαandβindicates an increase in the irregularity of the grain aggregate morphology.The list of the related finite element models is given in Table 1.The average thickness of the IMC(Cu6Sn5)layertmwas defined by dividing the areaAby its widthL,i.e.,tm=A/L,which were 9.5,9.4 and 9.3 μm in the models.48 grains and 138 grain boundaries were applied in each model.
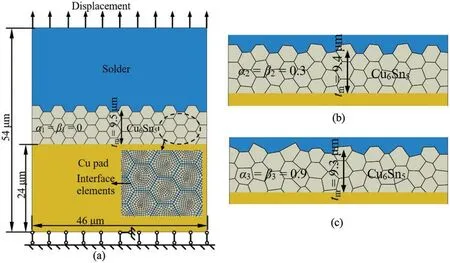
Figure 6:Models of solder/Cu6Sn5 grains/Cu pad structure with different grain aggregate morphologies:(a)Model I(α1=β1=0),(b)Model II(α2=β2=0.3),and(c)Model III(α3=β3=0.9)
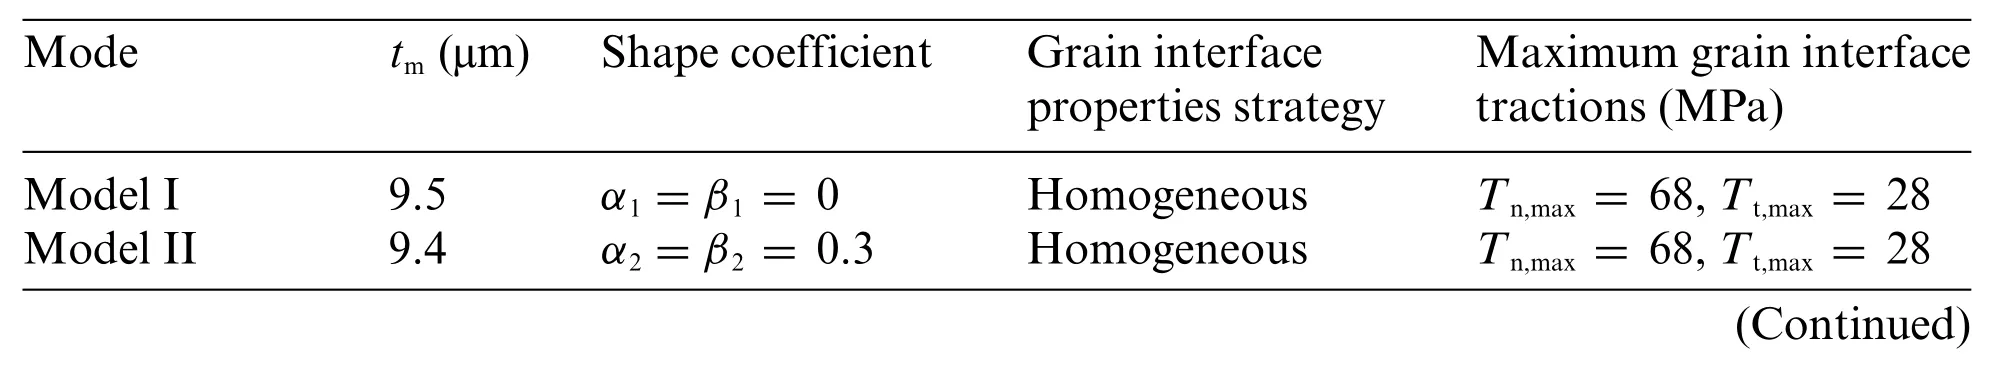
Table 1: Outline of the finite element analyses
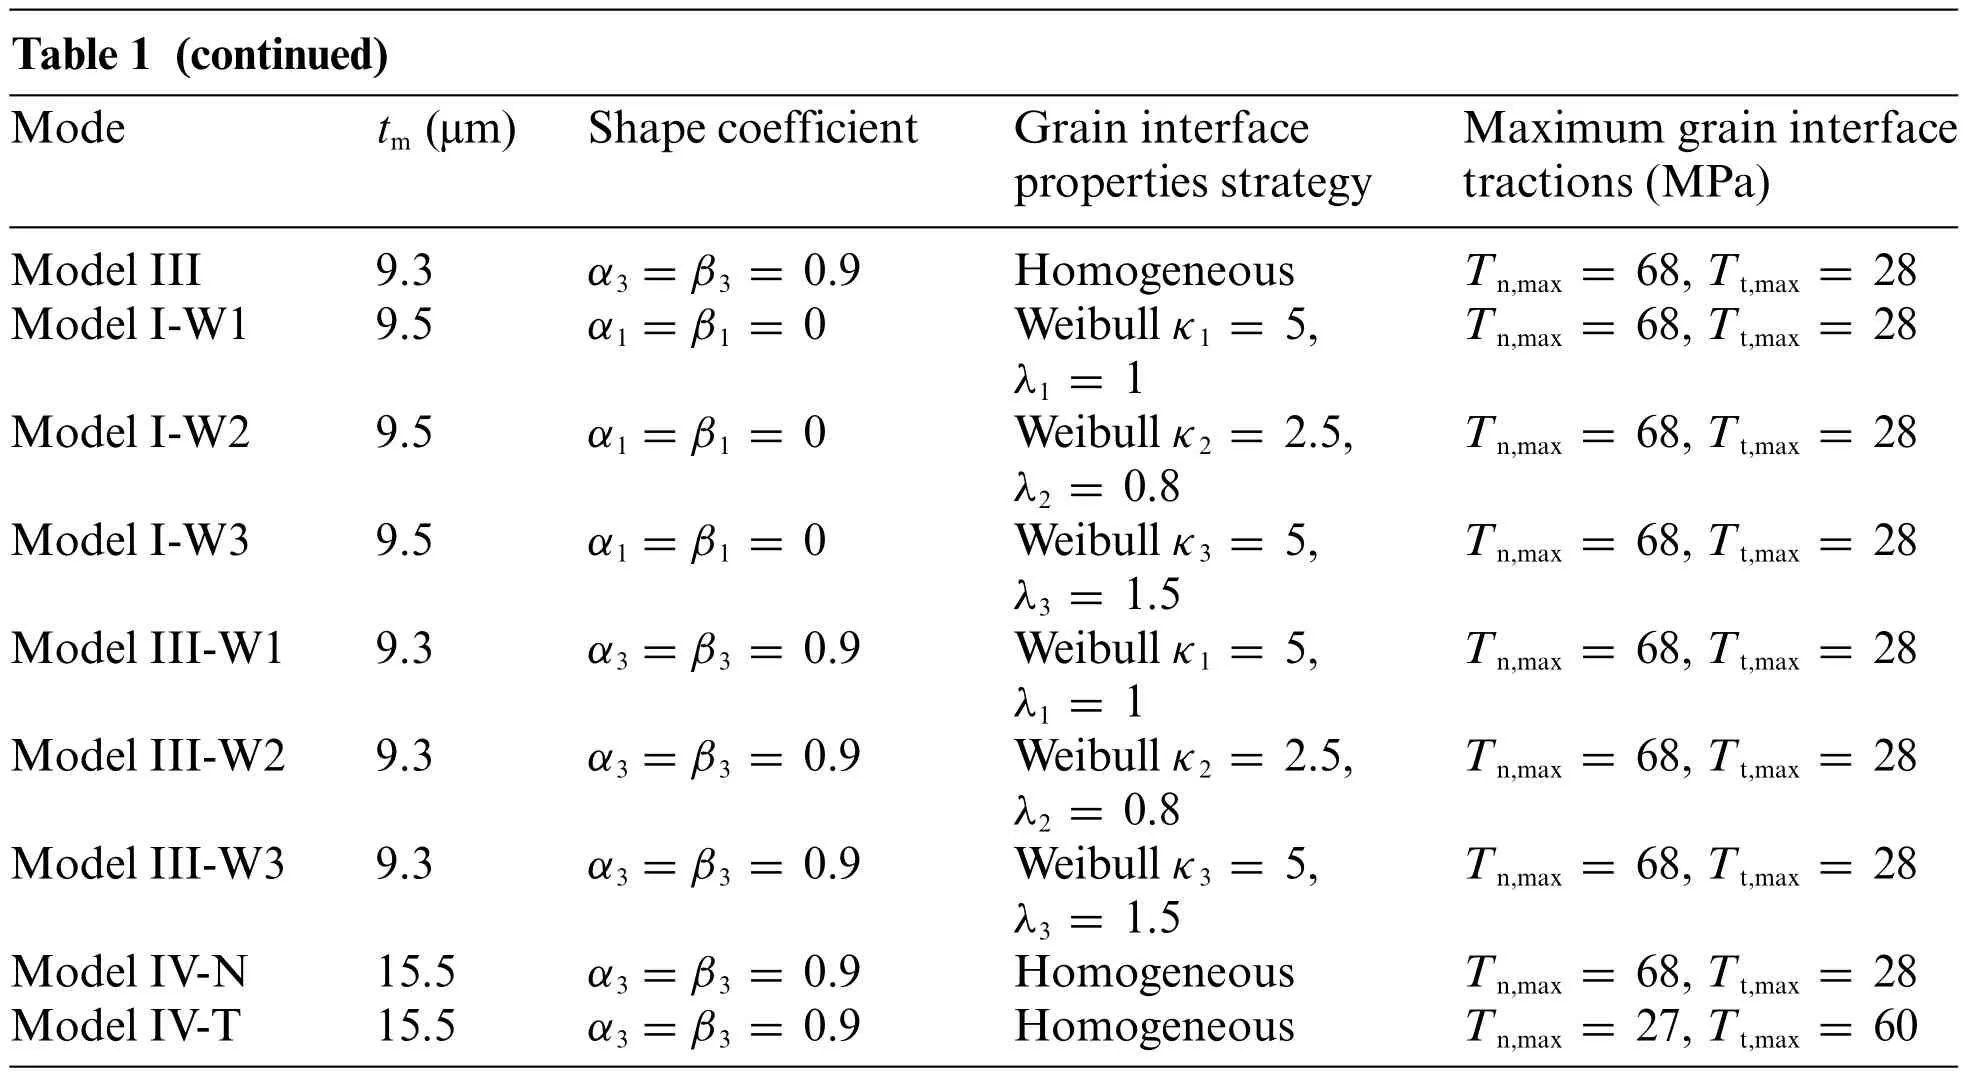
Table 1 (continued)Modetm(μm)Shape coefficientGrain interface properties strategy Maximum grain interface tractions(MPa)Model III9.3α3=β3=0.9HomogeneousTn,max=68,Tt,max=28 Model I-W19.5α1=β1=0Weibull κ1=5,λ1=1 Tn,max=68,Tt,max=28 Model I-W29.5α1=β1=0Weibull κ2=2.5,λ2=0.8 Tn,max=68,Tt,max=28 Model I-W39.5α1=β1=0Weibull κ3=5,λ3=1.5 Tn,max=68,Tt,max=28 Model III-W19.3α3=β3=0.9Weibull κ1=5,λ1=1 Tn,max=68,Tt,max=28 Model III-W29.3α3=β3=0.9Weibull κ2=2.5,λ2=0.8 Tn,max=68,Tt,max=28 Model III-W39.3α3=β3=0.9Weibull κ3=5,λ3=1.5 Tn,max=68,Tt,max=28 Model IV-N15.5α3=β3=0.9HomogeneousTn,max=68,Tt,max=28 Model IV-T15.5α3=β3=0.9HomogeneousTn,max=27,Tt,max=60
The CPE4 elements in ABAQUS were used to mesh the interior of the Cu6Sn5grains,the solder,and the Cu pad.The cohesive zone elements described above were embedded along the grain boundaries.The boundary condition of the model is shown in Fig.6a.
The Young’s modulusE,Poisson’s ratioν,and the stress intensity factorKIof Cu6Sn5are 119 GPa,0.31,and 2.1 MPa·m1/2,respectively[39].The critical energy release rateGcof Cu6Sn5can be calculated by
The cohesive energies are assumed to be equal to the critical energy release rate,i.e.,φn=φt=Gc=33.52 N/m.The maximum normal and tangential tractions areTn,max=68 MPa [40] andTt,max=28 MPa[41],respectively.The Young’s modulus and Poisson’s ratio of the Cu pad are 117 GPa and 0.34,respectively; The Young’s modulus and Poisson’s ratio of the Sn3.0Ag0.5Cu solder are 54 GPa and 0.36,respectively.
Fig.7a shows the force-displacement response curves.The overall responses of the three models were almost the same,indicating that the overall response is not sensitive to the grain aggregate morphology.The results of the models with different grain aggregate morphologies show various possible crack configurations (Figs.6c,7b and 7d).The general direction of the three crack paths was normal to the loading axis.However,some noticeable deviations were produced by the irregular grain aggregate morphology.In Model I withα1=β1=0(Fig.7b),the grain interfaces perpendicular to the loading direction were subjected to almost the same stress; thus,the microcracks initiated at those interfaces simultaneously.The crack configuration had a regular zigzag shape,and it remained perpendicular to the loading direction.In Model II withα2=β2=0.3(Fig.7c),the main crack path was prone to be perpendicular to the loading direction,as in Model I,while the crack configuration was much more random due to the irregular grain aggregate morphology.Model III withα3=β3=0.9 had the most random crack configuration among the three models(Fig.7d).This indicates that the regular grain aggregate morphology can bias the propagation direction of the microcracks,and the irregular aggregate morphology results in a more random crack configuration.

Figure 7:(a)Effect of the grain aggregate morphology on the overall force-displacement response,(b)Crack configuration of Model I(α1=β1=0),(c)Crack configuration of Model II(α2=β2=0.3),and(d)Crack configuration of Model III(α3=β3=0.9)
3.2 Effect of the Grain Boundary Defects on the Failure Behavior
To consider the grain boundary defects,a Weibull distribution [42] was applied to each of the parameters of the grain interfacial material.The four parameters of the cohesive zone law,the cohesive energiesφnandφt,and the maximum tractionsTn,maxandTt,max,were all described by Weibull distributions according to the following probability density functions:
in whichκandλare the Weibull parameters,which are measures of the variability in the material parameters.
The grain boundary defect effect for both the regular grain aggregate morphology model,Model I-W1∼W3 withα1=β1=0,and the irregular grain aggregate morphology model,Model III-W1∼W3 withα3=β3=0.9,was investigated.The list of the related models is given in Table 1.Models I and III,which have homogeneous grain interface properties,were used for comparison.In the models with material parameters with Weibull distributions,the grain facet was stochastically assigned a set of four parameters according to Eqs.(13a),(13b),(13c)and(13d)the four material parameters changed in a range from 0.5 to 1.5 of the values employed in Model I or III.Each grain facet had the same value of the parameters,and in this way,there wereNfdifferent interface elements(Nf=number of facets in the microstructure).Three groups of Weibull parameters,W1 withκ1=5 andλ1=1,W2 withκ2=2.5 andλ2=0.8,and W3 withκ3=5 andλ3=1.5,were used.Fig.8 shows the histogram for the number of grain facets with different maximum tractions.
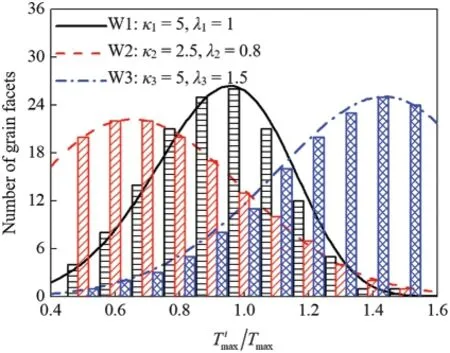
Figure 8:Weibull distribution of the grain interfacial maximum tractions
The overall force-displacement responses of the models with the interfacial material parameters with Weibull distributions are compared with that of the model with homogeneous interfacial material properties in Fig.9.In Model I-W1 and Model III-W1 with Weibull parametersκ1=5 andλ1=1,29%of the interface elements had higher interfacial strengths than those in Model I and Model III,and 52%of the interface elements had lower interfacial strengths.As a result,for both the regular grain aggregate morphology model(Fig.9a)and the irregular grain aggregate morphology model(Fig.9b),the overall strengths of Model I-W1 and Model III-W1 were approximately 14%lower than those of Model I and Model III,even though one-third of the total interfaces were stronger in Model I-W1 and Model III-W1 than in Model I and Model III.In Model I-W2 and Model III-W2 with Weibull parametersκ2=2.5 andλ2=0.8,17%of the interface elements had higher interfacial strengths than those in Model I and Model III,and 73% of the interface elements had lower interfacial strengths.Since more weak interfaces existed in these models,the overall strengths of Model I-W2 and Model III-W2 were approximately 30%lower than those of Model I and Model III.Model I-W3 and Model III-W3 with Weibull parametersκ3=5 andλ3=1.5 had the strongest interfaces among the models,78%of the interface elements had higher interfacial strengths than those in Model I and Model III,and only 14%of the interface elements had lower interfacial strengths.However,the overall strengths of Model I-W3 and Model III-W3 were only approximately 7% higher than those of Model I and Model III.The results indicate that the weak grain interfaces play a crucial role in the overall strength of the model.
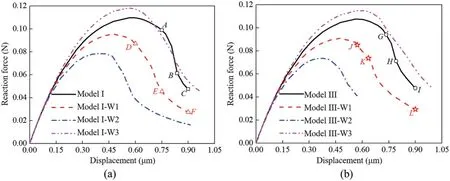
Figure 9:Effect of the grain interface property strategies on the overall force-displacement response:(a)Model with shape coefficients α1=β1=0 and(b)Model with shape coefficients α3=β3=0.9
To examine the difference in the crack configuration for the regular grain aggregate morphology model(shape coefficientsα1=β1=0)with different grain interface property strategies,three points labeledA,BandCfor Model I in Fig.9a were chose,and the corresponding crack configurations are shown in Figs.10a–10c.Similarly,the crack configurations corresponding to pointsD,EandFfor Model I-W1 in Fig.9a are shown in Figs.10d–10f.
At pointA,the microcracks initiated at the bottom right and top left of the grain layer(Fig.10a).At pointB,the microcracks occurred in the central region of the grain layer initiated almost simultaneously since the grain interfaces perpendicular to the loading direction were subjected to almost the same stress.The microcracks propagated and coalesced to form a main crack across the grain layer (Fig.10b).At pointC,the path of the main crack showed a regular zigzag shape,and the stress contours were generally symmetrical (Fig.10c).In Model I,the crack configuration is determined by only the grain aggregate morphology,as all the grain interfaces have the same strength.
Figs.10d–10f show the crack configuration and the vertical normal stressσ22of Model I-W1.Owing to the existence of weak grain interfaces,the crack configuration of Model I-W1 was quite different from that of Model I,even though the same grain aggregate morphology was applied in the two models.At pointD,the microcracks initiated at random grain interfaces (Fig.10d).Although the grain interfaces perpendicular to the loading direction underwent a similar stress,the microcracks propagated along a random path rather than failed simultaneously,and with the development of the microcracks,the stress in the adjacent elements was released(Fig.10e).The final crack configuration of Model I-W1 was much more irregular,and the stress contours were nonsymmetrical(Fig.10f).In Model I-W1,the crack configuration is determined by both the grain aggregate morphology and the grain interface properties.
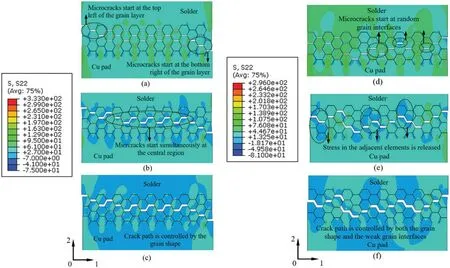
Figure 10:Crack configuration and stress σ22 of Model I at(a)Point A,(b)Point B,and(c)Point C,and Model I-W1 at(d)Point D,(e)Point E and(f)Point F in Fig.9a
The effect of the grain boundary defects on the crack configuration for the irregular grain aggregate morphology model(shape coefficientsα3=β3=0.9)has been studied.Three points labeledG,HandIfor Model III in Fig.9b were chosen,and the corresponding crack configurations are shown in Figs.11a–11c.Similarly,the crack configurations corresponding to pointsJ,KandLfor Model III-W1 in Fig.9b are shown in Figs.11d–11f.
Definingϕas the angle between the grain facet and the 1-axial direction,at load stepG,the angles of the cracking grain interfaces wereϕ1=0.65°,ϕ2=3.0° andϕ3=3.7°.These grain interfaces were approximately perpendicular to the loading direction (Fig.10a).This suggests that microcracks are prone to initiate at grain interfaces whose angleϕis small.This can be explained by Fig.12.As shown in Fig.12a,when the displacement in theydirection isu,the normal opening separation between two grains isδn=u.When the same displacementuis applied in the grains in Fig.11b,in which the local reference frame is not superposed with the global frame,the normal opening separation isδn=u·cosϕ.Therefore,the normal opening separation at the grain interface decreases with increasing grain facet angleϕ.This indicates that microcracks are prone to occur in the grain interfaces that are perpendicular to the loading direction,and it is more difficult for an oblique grain interface to start cracking.At pointH,the microcracks propagated,and more grain interfaces opened(Fig.11b).The microcracks coalesced to form a main crack,and the crack path was random due to the irregular grain aggregate morphology(Fig.11c).
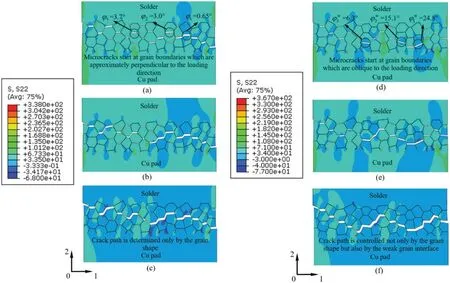
Figure 11:Crack configuration and stress σ22 of Model III at(a)Point G,(b)Point H and(c)Point I,and Model III-W1 at(a)Point J,(b)Point K and(c)Point L in Fig.9b
Figs.11d–11f show the crack configuration and the vertical normal stressσ22of Model III-W1.At load stepJ,the microcracks initiated at different locations from those in Model III.The angles of the cracking grain interfaces wereφ1w=24.8°,φ2w=15.1° andφ3w=6.3°,which were much greater than those in Model III (Fig.11d).These more tilted grain interfaces did not easily crack;however,the microcracks started at these grain interfaces due to their lower interfacial strength.Comparing the crack configurations at the final point of the two models,as shown in Figs.10c and 10f,although the same grain shape and aggregate morphology were adopted,their final crack configurations were apparently different due to the existence of the weak interfaces in Model III-W1.This suggests that in Model III-W1,the crack path was controlled by not only the grain aggregate morphology but also the weak grain interfaces.
3.3 Effect of the Normal and Tangential Strengths of the Grain Interfaces on the Failure Behavior of the IMC
The normal and tangential traction-separation laws control the normal opening separation between grains and the grain boundary sliding,respectively.There are two possible grain motions,as demonstrated in Fig.13.At one extreme,when the normal strength is low,the two grains may separate directly without any tangential sliding displacement(Fig.13a).At the other extreme,when the tangential strength is low,the two grains may slide along their boundary without any normal opening separation(Fig.13b).For most cases,both the normal and tangential strengths exist at grain interfaces,but their magnitudes in the two directions are different.The lowest strength always controls the mechanical behavior of the grains.
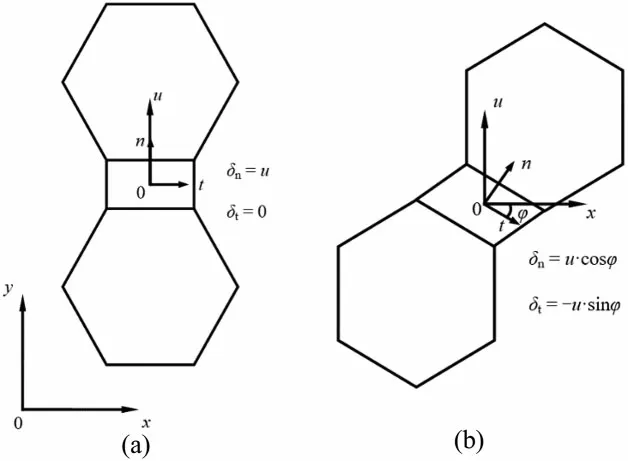
Figure 12:Effect of the grain facet angle on the separation:(a)The grain facet is perpendicular to the loading direction;(b)The grain facet is oblique to the loading direction
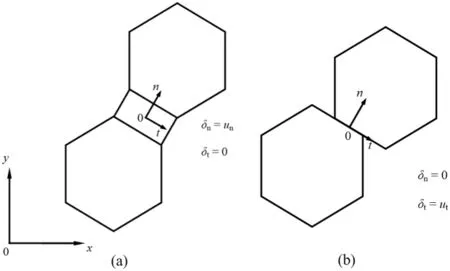
Figure 13:Deformation modes of the interface element:(a)Pure normal opening separation and(b)Pure tangential sliding separation
The thickness of IMC layer in the finite element model applied here was 15.5 μm.Model IV-N and Model IV-T were used in this study,as depicted in Fig.14.In Model IV-N,the maximum traction in the normal direction was larger than that in the tangential direction,and the parameters of the cohesive zone law wereφn=φt=33.52 N/m,Tn,max=68 MPa andTt,max=28 MPa.In contrast,in Model IV-T,the maximum traction in the tangential direction was larger than that in the normal direction,and the parameters of the cohesive zone law wereφn=φt=33.52 N/m,Tn,max=27 MPa andTt,max=60 MPa[43].
Fig.15a gives the overall responses of the two models.The force-displacement curve of Model IV-N is very similar to a typical stress-strain curve for ductile materials,which shows a large amount of plastic deformation before failure.The force-displacement curve of Model IV-T shows features of brittle materials,which are characterized by sudden and rapid failure with little plastic deformation.
To examine the difference in the crack configuration for Model IV-N and Model IV-T,load steps labeledMandNfor Model IV-N andOandPfor Model IV-T in Fig.15a were selected,and the corresponding crack configurations are shown in Figs.15b∼15e.
Fig.15b shows the displacement resultsu1of Model IV-N at load stepM.The grains were prone to slide along boundaries due to the low strength in the tangential direction of the grain interfaces;as a result,the grain region contracted,analogous to the necking phenomenon in ductile materials.Fig.15c gives the displacement resultsu1of Model IV-T at load stepO.In this model,the grains were prone to separate directly from each other due to the low strength in the normal direction of the grain interfaces.The grains were extruded in this way because it was difficult for them to slide past the adjacent grains,which led to expansion of the grain region.This phenomenon is quite analogous to the dilatancy effect in rock-like materials.
Fig.15d shows the displacement resultsu2of Model IV-N at load stepN.As the grains in Model IV-N were prone to slide along boundaries,the microcracks propagated along a zigzag path across the grain region.Fig.15e shows the displacement resultsu2of Model IV-T at load stepP.Compared to Model IV-N,the main crack path in Model IV-T was straight and perpendicular to the loading direction.This is because the strength in the normal direction of the grain interfaces was lower in Model IV-T,and the low strength direction in the grain interfaces was the same direction as the loading direction; thus,most of these grain interfaces cracked and coalesced to form a relatively straight crack path.
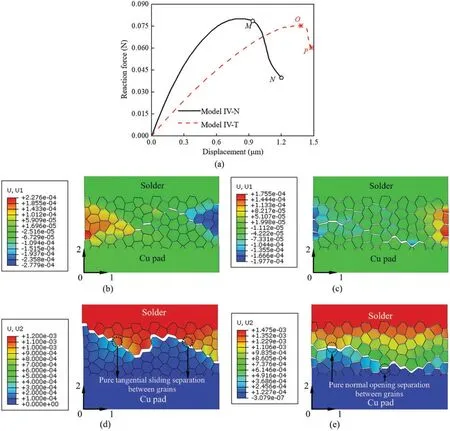
Figure 15:(a)Effect of the cohesive zone law parameters on the overall force-displacement response,crack configuration and displacement result u1 at(b)Point M in(a)for model IV-N,and(c)Point O in(a)for model IV-T,crack configuration and displacement result u2 at(d)Point N in(a)for model IV-N and(e)Point P in(a)for model IV-T
The overall strainsε11of the grain region in the two models are compared in Fig.16.In Model IV-N,the grains were prone to slide along grain boundaries due to the low strength in the tangential direction of grain interfaces.Therefore,a contracting deformation was observed under tensile loading,andε11of Model IV-N was negative.In contrast,in Model IV-T,the grains were prone to separating rather than tangential sliding due to the low strength in the normal direction of the grain interfaces.The grains pushed against each other instead of sliding along the grain boundaries; as a result,the model expanded,andε11of Model IV-T was positive.

Figure 16:Effect of the cohesive zone law parameters on the overall strain of the grain region,ε11
4 Conclusion
In this paper,a micromechanical model was constructed to explicitly predict the microcrack initiation,random crack path morphology and failure mode of the IMC.The influences of the grain aggregate morphology,the grain boundary defects and the sensitivity of the various cohesive zone parameters in predicting the overall mechanical response were investigated,and the following important points were derived:
(1) The overall mechanical strength of the IMC is not sensitive to the grain aggregate morphology,but the crack configuration depends greatly on the grain aggregate morphology.In the regular grain model,the crack path is relatively regular,while in the irregular grain model,the crack path is much more random.
(2) The overall strength of the model is determined dominantly by the weak grain interfaces.In the model with material parameters described by Weibull distributions,the crack configuration is controlled by not only the grain aggregate morphology but also the weak grain interfaces.
(3) The maximum tractions in the normal and tangential directions of the grain interfaces are critical in determining the overall strength,deformation,microcrack propagation and failure mode of the model.When the maximum traction in the normal direction is larger than that in the tangential direction,the necking phenomenon occurs during model deformation.When the maximum traction in the normal direction is smaller than that in the tangential direction,the dilatancy effect can be predicted by the model.
To close,it is necessary to mention that the role of the Cu3Sn layer was neglected in this study,and the effect of the Cu3Sn layer will be considered in the future modeling work.
Funding Statement:This research was supported by the National Natural Science Foundation of China(NSFC)under Grant 11872078,and Beijing Natural Science Foundation No.3222005.
Conflicts of Interest:The authors declare that they have no conflicts of interest to report regarding the present study.
 Computer Modeling In Engineering&Sciences2023年5期
- Computer Modeling In Engineering&Sciences的其它文章
- Explicit Topology Optimization Design of Stiffened Plate Structures Based on the Moving Morphable Component(MMC)Method
- Towards a Unified Single Analysis Framework Embedded with Multiple Spatial and Time Discretized Methods for Linear Structural Dynamics
- Developments and Applications of Neutrosophic Theory in Civil Engineering Fields:A Review
- Surface Characteristics Measurement Using Computer Vision:A Review
- Recent Progress of Fabrication,Characterization,and Applications of Anodic Aluminum Oxide(AAO)Membrane:A Review
- Challenges and Limitations in Speech Recognition Technology:A Critical Review of Speech Signal Processing Algorithms,Tools and Systems