
Earth Pressure of the Trapdoor Problem Using Three-Dimensional Discrete Element Method
2023-02-26 10:18QizhiChenChuliXuBaopingZouZhanyouLuoChangjieXuandXuLong
Qizhi Chen,Chuli Xu,Baoping Zou,⋆,Zhanyou Luo,Changjie Xu and Xu Long
1School of Civil Engineering and Architecture,Zhejiang University of Science and Technology,Hangzhou,310023,China
2School of Civil and Environmental Engineering,Ningbo University,Ningbo,315211,China
3School of Civil Engineering and Architecture,East China Jiaotong University,Nanchang,330013,China
4School of Mechanics,Civil Engineering and Architecture,Northwestern Polytechnical University,Xi’an,710072,China
ABSTRACT Load transformation from the yielding part of the soil to the adjacent part is known as the soil arching effect,which plays an important role in the design of various geotechnical infrastructures.Terzaghi’s trapdoor test was an important milestone in the development of theories on soil arching.The research on earth pressure of the trapdoor problem is presented in this paper using the three-dimensional (3D) discrete element method (DEM).Five 3D trapdoor models with different heights are established by 3D DEM software PFC 3D.The variation of earth pressure on the trapdoor with the downward movement of the trapdoor,the distribution of vertical earth pressure along the horizontal direction,the distribution of vertical earth pressure along the vertical direction,the distribution of lateral earth pressure coefficient along the depth direction,the magnitude and direction of contact force chain are studied,respectively.Related research results show that the earth pressure on the trapdoor decreases rapidly after the downward movement of the trapdoor,and then reaches the minimum earth pressure.After that,the earth’s pressure will rise slightly,and whether this phenomenon occurs depends on the depth ratio.For the bottom soil,due to the stress transfer caused by the soil arching effect,the ratio of earth pressure in the loose area decreases,while the ratio of earth pressure in the stable area increases.With the trapdoor moving down,the vertical earth pressure along the depth in the stable zone is basically consistent with the initial state,which shows an approximate linear distribution.After the trapdoor moves down,the distribution of earth pressure along with the depth in the loose area changes,which is far less than the theoretical value of vertical earth pressure of its self-weight.Because of the compression of the soil on both sides,the lateral earth pressure coefficient of most areas on the central axis of the loose zone is close to the passive earth pressure coefficient Kp.The existence of a‘soil arch’can be observed intuitively from the distribution diagram of the contact force chain in the loose zone.
KEYWORDS Soil arching effect;three dimensional discrete element;earth pressure;contact force chain
1 Introduction
Soil arching effect refers to the phenomenon of relative displacement and stress redistribution of soil,which widely exists in geotechnical engineering.Lai et al.[1] pointed out that soil arching effect is the key to the load transfer of high pile embankment.Liang et al.[2] pointed out that it is the main reason why the earth pressure on the shield tunnel far less than its theoretical value.Jiao et al.[3] considered soil arching effects on the distribution of earth pressure on rigid retaining walls and reported that it also affects the active earth pressure acting on the rigid retaining wall.The above is enough to illustrate the importance of studying the soil arching effect,which makes many scholars participate in the research of soil arching effect.
In terms of model test,Terzaghi [4] first conducted the famous trapdoor model test to study the soil arching effect.Based on the test results,the famous theoretical formula of Terzaghi loose earth pressure which is widely used in geotechnical engineering practice was put forward.After that,Iglesia et al.[5,6]made a series of centrifuge tests and presented the expressions of earth pressure acting on the trapdoor evolving from an initially curved state to a triangular shape and ultimately to a prism with a rectangular cross-section.Dewoolkar et al.[7] conducted a series of axisymmetric centrifuge model tests and investigated the failure mechanisms of soil mass above a trapdoor with different buried depth and stress levels.Costa et al.[8]carried out a similar investigation with centrifuge model tests under plane strain conditions.Rui et al.[9–12] conducted a series of multi trapdoor model tests in dense sands and found three different forms of slip surface evolution types.Chevalier et al.[13]and Chevalier et al.[14]studied the influencing factors of stress transfer and stress distribution in trapdoor problems through experiment and simulation.
Some researchers use numerical simulation to study the soil arching effect.Lai et al.[15,16]and Rui et al.[9,10] used the discrete element method (DEM) to study the soil arching effect of pile supported embankments.Lai et al.[1] revealed the morphological features and mobilization mechanism of soil arcing using the DEM modeling.Pardo et al.[17] simulated the trapdoor tests through a 2D finite element model with two different kinds of constitutive models.Sloan et al.[18],Martin[19],and Keawsawasvong et al.[20]obtained the upper and lower bound solutions of a strip trapdoor problem under different conditions through the finite element limit analysis method.
In theoretical studies,Liang et al.[2] proposed an analytical model to estimate the average loosening earth pressure acting on the trapdoor and the stress distribution in the loose area under the limit state.Based on the experimental observation,Liang et al.[21] proposed an analytical solution considering the deflection of the principal stress axis to predict the minimum and residual value of the loose earth pressure acting on the top of the trapdoor.Aubertin et al.[22–25]proposed a series of analytical or semi-analytical solutions to calculate the earth pressure generated by backfill in backfilled stopes.Eekelen et al.[26]put forward the limit-state equilibrium model with a concentric arch for pilesupported embankments design.Qian et al.[27,28]used the spatial discretization technique to study the active and passive earth pressure of sloping backfills.Li et al.[29]pointed out a novel method of calculating active earth pressure on laggings between piles considering the soil arching effect.
It can be found that many scholars have used different research methods to study the soil arching effect,but there are relatively few studies on the soil arching effect in trapdoor problems by using the three-dimensional(3D)DEM.In order to better reveal the change of earth pressure caused by the soil arching effect in the sand and the failure mode in loose areas,it is necessary to carry out a numerical simulation based on meso-structure.In this paper,a trapdoor model is established through the 3D DEM software PFC3D.The relative displacement of the particles is caused by moving the trapdoor down,which results in the soil arching effect.Further,the magnitude and distribution of the loose earth pressure and the distribution of the force chain between the particles are studied.
2 3D DEM Model of Soil Arching Effect
2.1 Description of 3D Discrete Element Method
The discrete element method was firstly introduced by Cundall et al.[30]and has been gradually applied in the fields of geotechnical engineering.In this paper,the simulations of the soil arching effect were implemented using commercial DEM software PFC3D developed by Itasca Consulting Group Inc.(USA) [31].The discrete element method is based on the theory of non-continuum mechanics,which is suitable for granular materials.The basic idea of the discrete element method is to simulate the physical and mechanical properties of granular materials through the motion and interaction of granular media.In PFC3D,particles are considered rigid but small overlaps are allowed at the contact points.The size of the overlapping area is related to the contact force and follows the forcedisplacement law.The overlapping area is much smaller than the particle size.In PFC3D,particles are considered to be connected by springs,visco-pots,slides and couplers as shown in Fig.1.Moreover,the motion of the particles obeys Newton’s second law.The forces and displacements are related by the contact stiffness in normal and shear directions as follows:
whereniis the unit normal vector ini=x,y,zdirections.Fnis the normal force to the normal displacementUn.Fsis the shear force to the shear displacementUs.Knis normal stiffness andKsis shear stiffness.
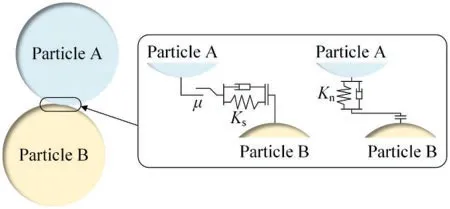
Figure 1:Interaction between two particles
During each calculation cycle,all contact information is updated according to the position of the particles and the wall.According to the force-displacement law,the contact force between the contact particles is calculated.After the contact force is obtained,the force and moment acting on the particles are calculated.According to Newton’s second law,the velocity and acceleration of each particle are obtained.At the end of each calculation cycle,the displacement and rotation angle of the particles are obtained,and then the position of the particles and the wall is updated to form new contacts,and then the next calculation cycle is carried out.
In this paper,spheres are used in 3D DEM modeling for granular materials.Additionally,the linear contact model is chosen for DEM simulations in PFC3D.The linear contact model provides the relation between contact force and relative displacement of the particles as shown in Eqs.(1)and(2).In addition,the tangential contact force is limited by a friction coefficientμ[31].Because the three contact parameters(Kn,Ks,andμ)in the linear contact model are all constant values,it can provide high computing efficiency.
2.2 3D DEM Model and Parameters
Referring to the typical trapdoor experimental model,a 3D trapdoor model is established in PFC3D.Typical calculation model diagram shows in Fig.2a,the model consisting of 9 walls,the width of model is 1.5 m,the length of model is 3 m,and the width of middle moving door is 0.6 m,except for the intermediate trapdoor,the rest of the wall remains immobile in the simulation process.
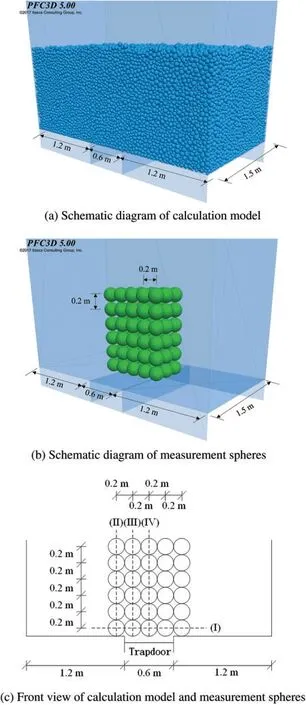
Figure 2:DEM model and arrangement of measurement spheres
In the DEM model,the soil is simulated by spherical particles.The particle micro parameters used in this simulation are mainly obtained by reference,and do not rely on specific projects or tests.The particle density isGs=2600 kg/m3,the particle radius is 12 to 30 mm evenly distributed,the particle normal stiffness isKn=1.5×10⁸N/m,and the particle shear stiffness isKs=1.0×10⁸N/m,the friction coefficient isμ=0.25.The soil of the model is generated by gravity settling (gravity acceleration is g=9.8 m/s2)and the particles are balanced under its self-weight stress.
The calibration method of macro parameters corresponding to particle micro parameters refers to the method described by Chen et al.[32].A calibration model with a length of 50 cm,width of 50 cm and height of 80 cm is established.Using the aforementioned particle micro parameters and particle generation method,2778 particles are generated.The resulting soil specimen porosity rate measured by the measurement spheres isn=0.36.The unit weight can be obtained by follows:
Therefore,the unit weight is 16.31 kN/m3.Jaky [33] proposed the coefficient of earth pressure at rest,which is wildly used in geotechnical engineering.In Jack’s formulation,the earth pressure coefficient at rest has the following relationship with the internal friction angle:
whereK0is the earth pressure coefficient at rest andϕis the internal friction angle.The calibration of the coefficient of friction between particles is realized according to the relationship between the lateral earth pressure acting on the wall at rest and the angle of internal friction.According to Eq.(4),the internal friction angle can be shown as follows:
The lateral earth pressure acting on the wall per unit lengthE0can be shown as follows:
whereHis depth.So the relationship between the lateral earth pressure acting on the wall at rest and the internal friction angle can be drawn as follows:
The lateral earth pressure acting on the wall per unit length can be measured by measuring spheres at different depths.The variation of lateral earth pressure per unit length at different depths in calibration is shown in Fig.3.In this way,the distribution of lateral earth pressure acting on the wall is obtained,and then the angle of internal friction can be obtained by Eq.(7).Through the calibration model,the angle of internal friction is 12.2 degrees.
Taking the effect of depth ratio(H/B)act on the soil arching effect into account,the filling height(H) was selected as 0.4,0.8,1.2,1.5,2.1 m,corresponding to five groups of different buried depth ratios(H/B).0.67,1.33,2.00,2.50,3.50.The number of particles generated are 25,000(H/B=0.67),50,000(H/B=1.33),75,000(H/B=2.00),93,750(H/B=2.50)and 131,250(H/B=3.50).The relative displacement in particles is caused by controlling the slow downshift of the trapdoor,which results in the soil arch effect.In the simulation process,each movement of the trapdoor displacement is 1.0 × 10⁻⁴m.In each cycle,the unbalanced force is generated after the trapdoor is lowered and then eliminated by equilibrium calculation.The calculation is carried out on a computer with dual Intel Xeon E5-2678 v3 CPUs and 128 G RAM.The calculation time varies from several hours to hundreds of hours depending on the number of particles.The earth pressure at a different place of soil is measured by measurement spheres arranged above the trapdoor during the process of the trapdoor moving down.The diameter of each measurement sphere is 0.2 m.Five measurement spheres are arranged in the length direction of the model,and 3 measurement spheres are arranged in the width direction.The number of measurement spheres in the height direction is determined according to the height of the soil,and the typical measurement spheres arrangement schematic is shown in Figs.2b and 2c.
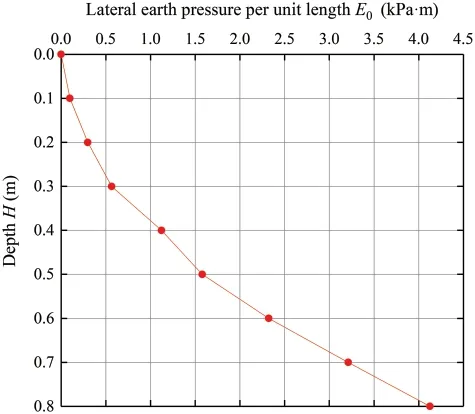
Figure 3:Variation of lateral earth pressure per unit length acting on the wall of unit length at different depth in calibration
3 Analysis of 3D DEM Calculation Results
3.1 Variation Law of Earth Pressure on the Trapdoor with the Downward Movement of the Trapdoor
Equilibrium calculation of the particles is carried out after the generation of particle,and then the earth pressure acting on the trapdoor is recognized.Then moving down the trapdoor,the displacement of each movement is 1.0× 10⁻⁴m,and after the movement,the unbalanced force is eliminated by equilibrium calculation,and then the soil earth pressure acting on the trapdoor is recorded.
The displacement of each movement is 1.0×10⁻⁴m,500 cycles in total,and the downward movement of the trapdoor is 0.05 m,which is 8.33% of the trapdoor width.The simulation results of five groups under of different buried depth ratios are shown in Fig.4.It can be seen from the results that for the simulation results of different buried depth ratios,the earth pressure on the trapdoor decreases rapidly after the first few cycles of simulation,and then reaches the minimum earth pressure.For the case of the deep buried depth ratio,the earth pressure on the trapdoor remains basically unchanged,while for the case of shallow buried depth,the earth pressure will rise slightly.
The minimum value of earth pressure is related to the buried depth ratio.In the case ofH/B=0.67,the minimum earth pressure is 71.8%of the initial value,in the case ofH/B=1.33,the minimum earth pressure is 45.1%of the initial value,in the case ofH/B=2.00,the minimum earth pressure is 28.1%of the initial value,H/B=2.50,the minimum earth pressure is 25.4%of the initial value,and in the case ofH/B=3.50,the minimum earth pressure is 18.2%of the initial value.It can be found that the larger the buried depth ratio is,the smaller the value of earth pressure in the loose zone relative to the initial earth pressure will be.And the soil arching effect in the overlying soil is more obvious,mainly because with the increasing of the depth of the upper soil,the formation of a longer slip surface makes the stress more easily transmitted to the none loose areas on both sides.
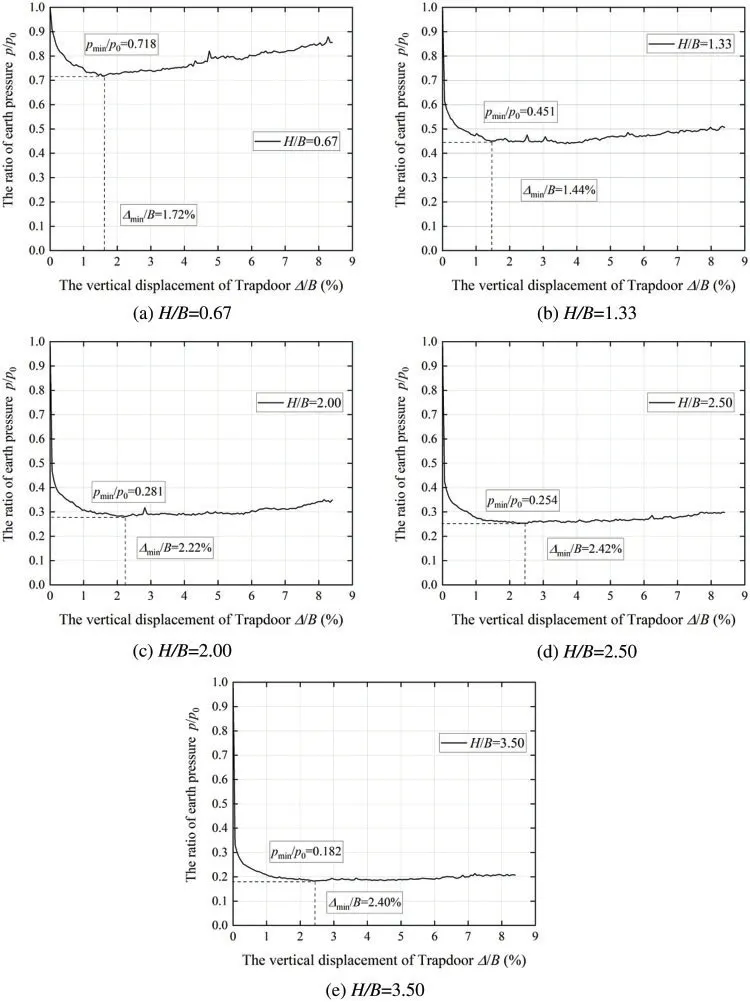
Figure 4:Variation curve of the ratio of earth pressure with the downward movement of trapdoor
From the simulation results,it can also be found that the minimum earth pressure occurs at the moment when the vertical displacement reaches 1.72%,1.44%,2.22%,2.42% and 2.40% of the trapdoor width for 5 different depth ratio,respectively.Dewoolkar et al.[7] concluded that the minimum earth pressure usually occurs when the vertical displacement of the trapdoor is 0.1% to 9% of the trapdoor width and the average is about 2% based on a large number of trapdoor model tests.The simulation results in this paper are consistent with this conclusion.
3.2 Distribution Law of Vertical Earth Pressure along Horizontal Direction
Fig.5 shows the change of vertical earth pressure along the I line with trapdoor moving down,the position of the line(I)is shown in Fig.2c,with five measurement spheres in the length direction,three in the middle above the moving trapdoor and two on both sides in the stable area.The earth pressure result is the average value of each measuring spheres on line(I).
It can be seen from the results that the downward movement of the trapdoor causes the soil arching effect in the loose area,and the ratio of earth pressure in the middle loose area is significantly lower than the initial ratio of 1.The ratio of earth pressure measured in the stable area on both sides will be higher than the initial ratio as the trapdoor moves down,mainly due to the soil arching effect,and the earth pressure in the middle loose area will transfer to the stable area on both sides.For Fig.5a the depth ratioH/B=0.67,the data have greater discreteness compared with the simulation results of larger relative depth due to the shallow soil thickness.

Figure 5: (Continued)
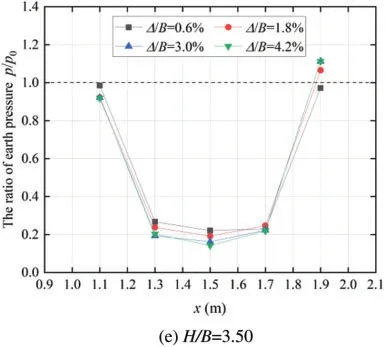
Figure 5:Variation of vertical earth pressure on line(I)with the downward movement of trapdoor
In addition,it can be seen from the results that with the increase of the displacement of the trapdoor,the soil arching effect becomes more obvious.The more stress transfer occurs,the ratio of earth pressure decreases in the loose area,and the ratio of earth pressure in the stable area increases.Taking Fig.5b for example,when the vertical displacement of the trapdoor reaches 0.6%,1.8%,3.0%and 4.2%of the trapdoor width,the ratios of earth pressure at the middle position are 0.83,0.64,0.58 and 0.53,respectively.The ratio of earth pressure decreases in turn and remains stable.The ratios of earth pressure in the measuring balls of the left stability zone are 1.29,1.37,1.45 and 1.44,respectively,which increase in turn and finally remain stable.
3.3 Distribution law of Vertical Earth Pressure along Vertical Direction
The calculation results of vertical earth pressure distribution of lines (II),(III) and (IV) along the vertical direction with the downward movement of the trapdoor are shown in Figs.6 to 8.The simulation results of the vertical distribution of earth pressure of group whichH/Bis 0.67 is not analyzed because the depth is too shallow.
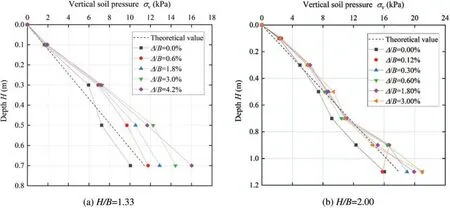
Figure 6: (Continued)
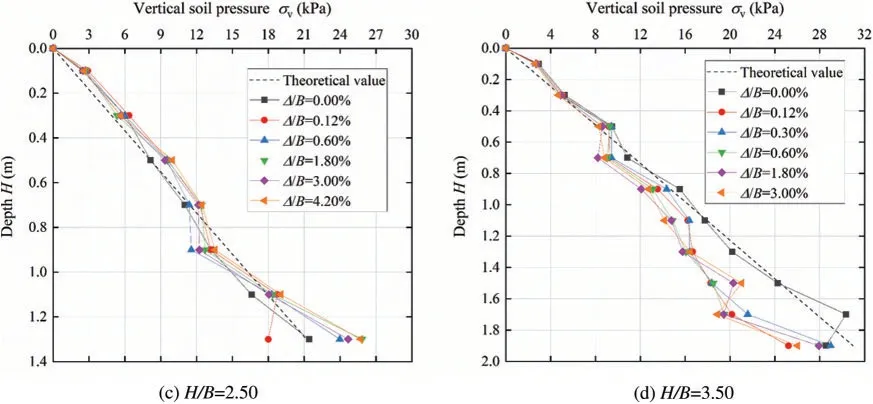
Figure 6:Variation of vertical earth pressure on line(II)with the downward movement of trapdoor
The vertical earth pressure results located on lines(II),(III)and(IV)can be seen from Figs.6 to 8.The initial vertical earth pressure at the beginning of the simulation is comparable to the theoretical value of the earth’s self-gravity stress which increases linearly along the depth.
Fig.6 shows the distribution change of vertical earth pressure along the depth line (II) in the stability zone with the trapdoor moving down.It can be seen from the results that after the trapdoor moves down,the vertical distribution of earth pressure in the stability zone still maintains an approximate linear distribution.For different displacement of the trapdoor,the earth pressure of the shallow part of soil basically does not change because it is less affected by the loosening area.While the deep part of the soil is relatively affected by the loosening area.
For the soil in the loose zone,with the moving down of the trapdoor,the variations of the earth pressure distribution along the depth on line(III)and line(IV)are shown in Figs.7 and 8.It can be found that after the downward of the trapdoor,the earth pressure in the loose area changes along the depth distribution is different from the linear distribution of the initial state because of the soil arching effect.The earth pressure of the deep part of the soil will be much smaller than the theoretical value of the vertical earth pressure of its self-weight because of the stress redistribution in the loose area.Taking the simulation results ofH/B=3.50 in Fig.7d as an example,when the trapdoor displacement reaches 0.3%width of the trapdoor,the measured vertical earth pressure at the depth of 1.9 m is 8.21 kPa,which is far less than the theoretical value of self-weight vertical earth pressure 30.98 kPa.The vertical earth pressure is only 26.5%of the theoretical self-weight.The vertical earth pressure at the depth of 1.9 m is even equivalent to the earth pressure at 0.7 m.
In addition,the results of Figs.7 and 8 show that with the increasing of trapdoor displacement,the soil arching effect becomes more and more significant which means the earth pressure in the loose area is smaller.Still taking the simulation result ofH/B=3.50 in Fig.7d as an example,when the trapdoor displacement reaches 0.12%,0.30%,0.60%,1.80%and 3.00%of the trapdoor width,the vertical earth pressure at 1.7 m is 8.44,7.55,5.81,5.08 and 4.37 kPa,which shows a gradually decreasing trend and a steady trend.
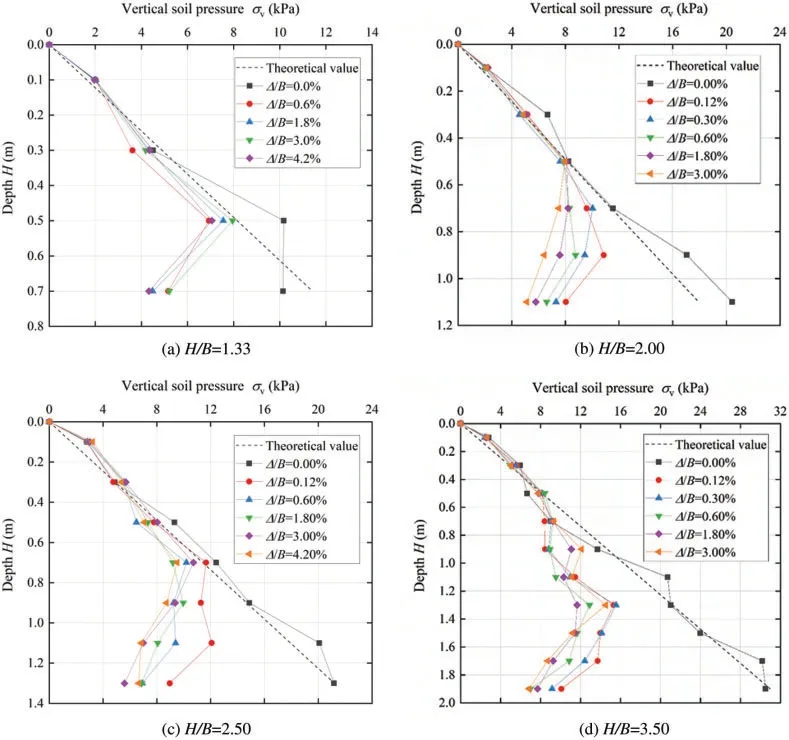
Figure 7:Variation of vertical earth pressure on line(III)with the downward movement of trapdoor
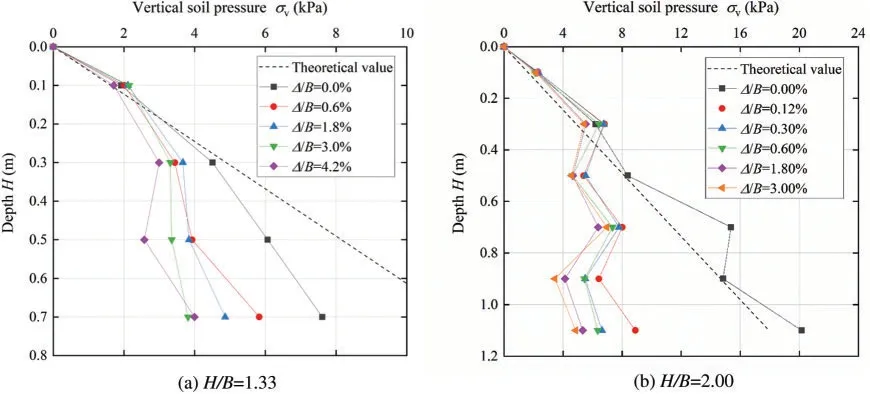
Figure 8: (Continued)
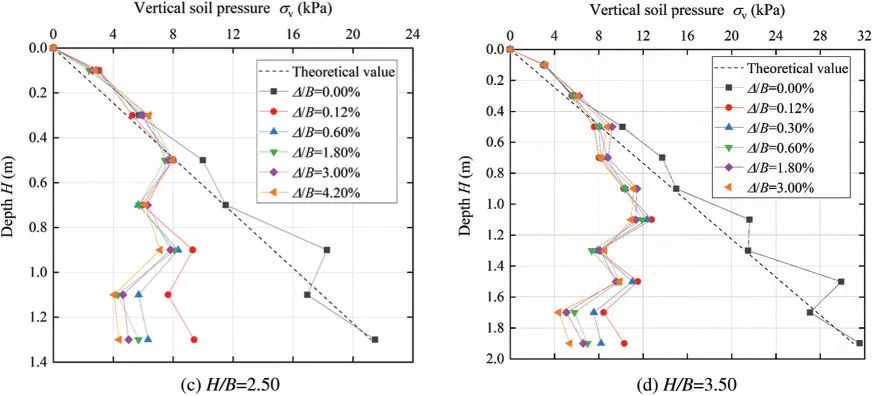
Figure 8:Variation of vertical earth pressure on line(IV)with the downward movement of trapdoor
3.4 Distribution Law of Lateral Earth Pressure Coefficient along Depth Direction
The simulation results of lateral earth pressure coefficient on the central axis(IV)of loose zone are shown in Fig.9.It can be found that when the soil arching effect occurs in the loose area,the horizontal earth pressure will be greater than vertical earth pressure and the lateral earth pressure coefficient of most areas on the axis of the loose area will be closer to the passive earth pressure coefficient Kp because of the extrusion of the soil on both sides.There will be some deviation in the shallow soil and the bottom soil,mainly due to the impact of the boundary.At the same time,it can be found that with the increase of trapdoor displacement,the ratio of earth pressure trends to increase.It is speculated that the main reason is that as the downward movement of the trapdoor,the squeezing effect of the soil on both sides acting on the soil on the central axis is intensified.
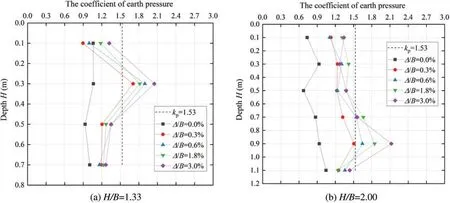
Figure 9: (Continued)
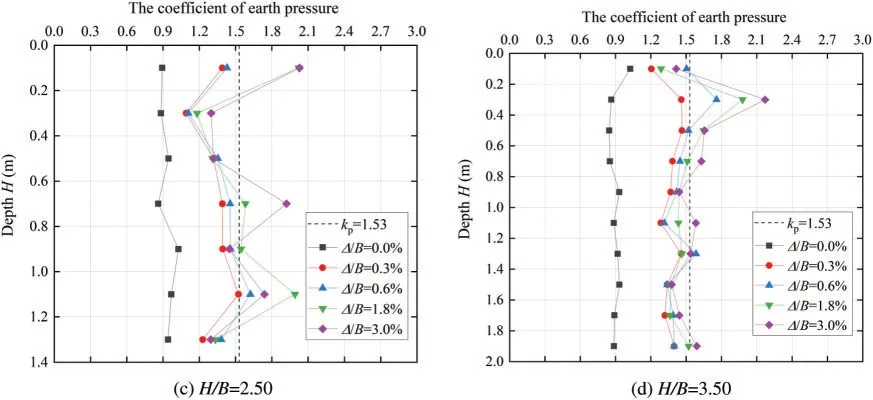
Figure 9: Variation of lateral earth pressure coefficient along the line (IV) with the downward movement of trapdoor
3.5 Size and Distribution Law of Contact Force Chain
According to the simulation results of five groups of different buried depth ratios,the distribution of contact force chain can be observed by cross sections.The front section view is shown in Fig.10.It can be clearly seen that the soil stress in the loose zone transfers to the stable zone on both sides of the loose zone,and the contact force of particles on the central axis is mainly in the horizontal direction.Through the distribution diagram of contact force chain,the existence of“soil arch”can be observed intuitively.
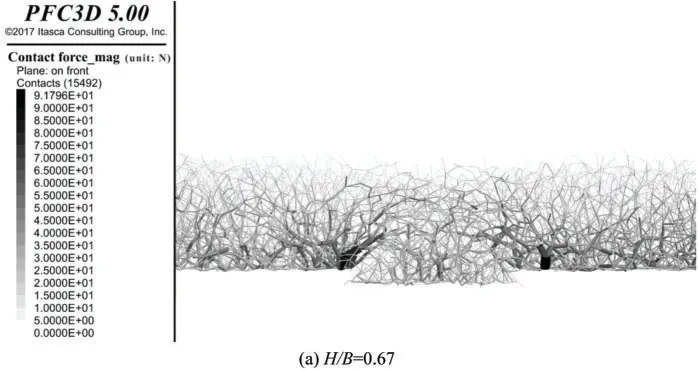
Figure 10: (Continued)
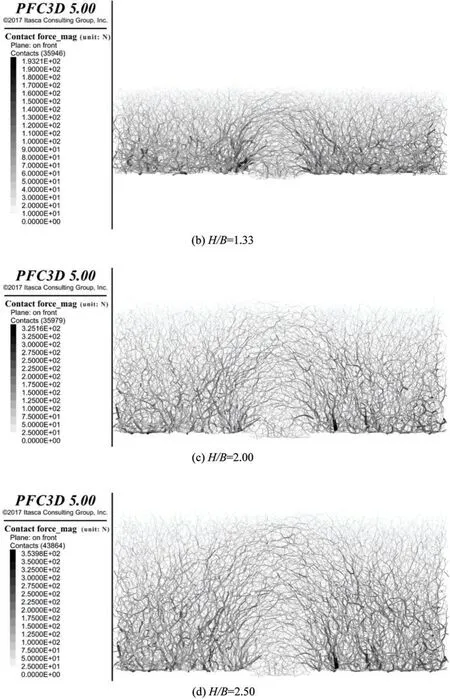
Figure 10: (Continued)
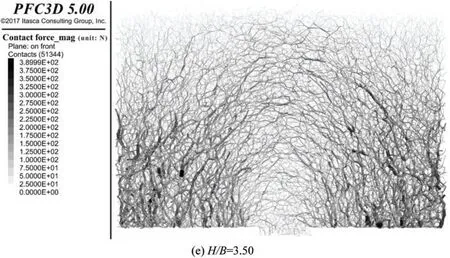
Figure 10:Front view of contact force chain
Fig.11 is a vertical cross section view at 0.1 m from the bottom of the contact force chain of the simulation group withH/B=1.33.It can be found from the results that the contact force in the loose area is significantly less than that in the stable area on both sides,mainly due to the soil arching effect,the stress is transmitted to the stable area on both sides through the arched force chain formed above.The distribution results of the contact force chain in Fig.11 are consistent with the conclusion that the earth pressure above the bezel is much less than the pressure of its self-weight.
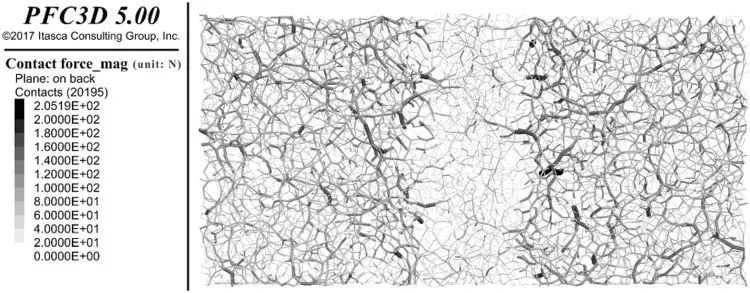
Figure 11:Top view of contact force chain
4 Conclusion
The 3D DEM software PFC3D is used to study the trapdoor problem,the change of earth pressure and the lateral ratio of earth pressure in loose and stable areas is studied,and the preliminary conclusions and suggestions were as follows:
1) Due to the presence of the soil arching effect,the earth pressure on the trapdoor decreases rapidly after the simulation begins,and then reaches the minimum earth pressure.The earth pressure on the trapdoor then remains basically unchanged for the large buried depth ratio,while the earth pressure will rise slightly for shallow burial depth.The larger the depth ratio is,the smaller the earth pressure in the loose zone relative to the initial earth pressure will be.
2) For the bottom soil,due to stress transfer caused by the soil arching effect,the ratio of earth pressure in the loose area decreases,while the ratio of earth pressure in the stable area increases.
3) As the trapdoor moves down,the vertical earth pressure in the stable area is basically the same along the depth distribution as the initial state,showing an approximate linear distribution.After the trapdoor moves down,the earth pressure in the loose area changes along the depth distribution; unlike the linear distribution of the initial state,the deep earth pressure will be much smaller than the theoretical value of its self-weight earth pressure.
4) When the soil arching effect occurs in the loose area,the lateral earth pressure coefficient of most areas on the axis of the loose area is close to the passive earth pressure coefficientKpdue to the extrusion of the soil on both sides.
5) The contact force chain in the loose zone shows that the soil stress is transferred to the stable zone on both sides of the loose zone through the distribution diagram of the contact force.
Funding Statement: The financial supports from National Natural Science Foundation of China(NSFC Grant No.52008373) and Natural Science Foundation of Zhejiang Province of China (No.Q22E080445)are greatly acknowledged.
Conflicts of Interest:The authors declare that they have no conflicts of interest to report regarding the present study.
 Computer Modeling In Engineering&Sciences2023年5期
- Computer Modeling In Engineering&Sciences的其它文章
- Explicit Topology Optimization Design of Stiffened Plate Structures Based on the Moving Morphable Component(MMC)Method
- Towards a Unified Single Analysis Framework Embedded with Multiple Spatial and Time Discretized Methods for Linear Structural Dynamics
- Developments and Applications of Neutrosophic Theory in Civil Engineering Fields:A Review
- Surface Characteristics Measurement Using Computer Vision:A Review
- Recent Progress of Fabrication,Characterization,and Applications of Anodic Aluminum Oxide(AAO)Membrane:A Review
- Challenges and Limitations in Speech Recognition Technology:A Critical Review of Speech Signal Processing Algorithms,Tools and Systems