
A Comparative Analysis of Performance-Based Resilience Metrics via a Quantitative-Qualitative Combined Approach: Are We Measuring the Same Thing?
2023-02-26 09:35JunqingTangSongHanJingWangBaojieHeJinhanPeng
Junqing Tang · Song Han · Jing Wang · Baojie He · Jinhan Peng
Abstract Since the proposal of the pioneering “resilience triangle” paradigm, various time-series performance-based metrics have been devised for resilience quantif ication.The numerous choices diversify the toolbox for measuring this compound system concept; however, this multiplicity causes intractable questions for applications, including “Do these metrics measure the same resilience?” and “Which one to pick under what circumstance?” In this study, we attempted to address these two fundamental issues using a comprehensive comparative investigation.Through a quantitative-qualitative combined approach,12 popular performance-based resilience metrics are compared using empirical data from China’s aviation system under the disturbance of COVID-19.Quantitative results indicate that only 12 of the 66 metric pairs are strongly positively correlated and with no signif icant differences in quantif ciation outcomes; qualitative results indicate that the majority of the metrics are based on different def inition interpretations, basic components, and expression forms, and thus essentially measure different resilience.The advantages and disadvantages of each metric are comparatively discussed, and a “how to choose” guideline for metric users is proposed.This study is an introspective investigation of resilience quantif ication studies, aiming to offer a new perspective to scrutinize those benchmarking metrics.
Keywords COVID-19 · Infrastructure system · Model comparison · Resilience metrics · Systemic risk
1 Introduction
Critical urban infrastructure systems, such as transportation, power, water supply, waste, and emergency response systems, are facing an increasing number of threats and disruptions from both natural and human-made disasters(Henry and Ramirez-Marquez 2012; Bruyelle et al.2014;Tang, Zhao, et al.2023), resulting in potential economic losses and ever-growing costs for maintenance and rebuilding (Mao and Li 2018; Huck and Monstadt 2019; Liu and Song 2020; Serdar et al.2022).The concept of “resilience”has been considered a promising solution that could tackle such negative impacts on future planning and development(Francis and Bekera 2014; Gheorghe et al.2018; Tang, Wei,et al.2023).To build and manage resilience in urban systems more adequately, it is fundamental to achieve an appropriate and accurate quantif ication of this compound system attribute (Cai et al.2018).
Owing to the essential fuzziness and multidimensionality of resilience, the quantif ication of this concept has been an intractable issue in the f ield of disaster risk reduction and safety science (Tang et al.2020).To this end, scholars from different disciplines have proposed a large number of models and metrics to quantify this fuzzy system property, such as the well-known resilience triangle, in an ongoing trend that has become increasingly pronounced.
Resilience quantif ciation methods and tools can be classif ied into different categories, such as (1) performance-based,including system state- or phase-based models (Ouyang and Dueñas-Osorio 2012; Panteli et al.2017; Cai et al.2018;Najarian and Lim 2019; Cai et al.2021; Patriarca et al.2021; Yin et al.2022 ; Jiang et al.2023); (2) indicator-based assessment frameworks (Arreguín-Sánchez 2014; Ghaffarpour et al.2018; Martišauskas et al.2018; Wang et al.2019);and (3) qualitative methods, such as scorecard assessments with expert knowledge (Cutter et al.2008; Pettit et al.2 010;Shirali et al.2013); and many others.Performance-based metrics are a widely applied group of tools that quantify resilience by analyzing time-series performance changes in a system’s functionality level.Many of these metrics are claimed to be generic methods for resilience quantif ication and can be applied to or tailored with minimum changes in different infrastructure systems.Due to their simplicity and generality, metrics from this group have been widely applied in many urban systems to date.
For users, a rapidly growing number of quantif ication metrics certainly enrich the toolbox available for measuring and benchmarking resilience for better management purposes.The generic characteristics of those performance-based metrics create an easy-to-apply environment.However, such variety also brings several obstacles during hands-on applications.For example, do these metrics measure the same concept of resilience since they are all devised for measuring system resilience? If not, which metric should be chosen under what data and constraint conditions? Only a small proportion of scholars have attempted to answer the f irst question.Clédel et al.( 2020) presented that many metrics tend to evaluate resilience similarly; however,metrics can also be heterogeneous and do not capture the same resilience when different def initions of resilience are considered.Nishimi et al.( 2021) compared psychological resilience metrics using correlation and regression methods and found that resilience metrics were weakly to moderately correlated.Notably, scholars have not yet reached a consensus on the above questions, and a comprehensive comparative analysis that focuses on general performancebased metrics is still missing.More importantly, effective guidance on the use of these metrics is also scarce.Hence,the research questions and objectives we aimed to tackle in this study are as follows.
RQ1 Do these popular performance-based metrics measure the same resilience? That is, as all of them are designed for measuring resilience and most are claimed to be “generic” resilience quantif ication methods, do they capture the same essence and measure the same thing? (Objective: using a retrospective perspective to compare the similarities and differences of the selected metrics in a quantitativequalitative combined approach.)metrics essentially measure different concepts of resilience, which one should be used based on different application contexts? (Objective: developing an effective guideline for users based on the f indings from addressing the f irst research question.)
To address these two questions, a metric comparison study was conducted and we used simple, yet effective,quantitative methods, combined with an in-depth qualitative diagnosis, to reveal the answers.Based on their prominent reputation and applicability, 12 popular and recently proposed performance-based system resilience metrics were selected.The associations and differences among selected metrics were verif ied using time-series system performance data collected from the civil aviation system in China’s mainland during the f irst two waves of COVID-19 from January 2020 to March 2021.To examine the temporal scale sensitivity of these metrics and their association effects, all metrics were compared across two temporal scales: the daily scale and the weekly scale,respectively.The advantages and disadvantages of each metric were comparatively discussed, and a brief user guideline was proposed based on the f indings.
The main contributions of this study can be summarized as follows:
• To the best of our knowledge, this study is one of the f irst to compare the performance-based resilience metrics in critical infrastructure systems via a quantitative and qualitative combined approach.
• This study provides a guideline for practitioners, which outlines “when to choose which” for users when measuring, building, and managing resilience in infrastructure systems, which helps identify the merits and disadvantages of mainstream tools in the resilience quantif ication toolbox.
• This study offers an introspective analysis of diverse tools and lays an important foundation for an improved understanding of performance-based resilience in urban systems, which provides insightful evidence for expanding how critical infrastructure resilience is measured,perceived, and managed.
2 The Selected Metrics
Several common parameters in the selected metrics are listed below.Other specif ic parameters are explained in the following subsection.
RQ2 Which metric should be used under what circumstance? That is, if these popular performance-based
After reviewing the mainstream resilience metrics found in the literature from 2003 to 2022, 12 well-established resilience metrics were selected for comparison based on both metric characteristics (that is, algorithm applicability) and popularity in the literature.A summary of the selected performancebased metric characteristics is provided in Table 1.Some essential explanations of these 12 metrics are provided below.This article does not intend to give a full review of each metric and model, and further details should be referred to the corresponding citations associated with them.
R1 refers to the “resilience-triangle metric” proposed by Bruneau et al.( 2003), which depicts the total loss of system resilience based on the areal difference between 100% functionality and the actual time-dependent performance.It is a well-applied metric that has inspired many “area-based” resilience metrics (for example,R2 ) (Eq.1):
R2 was developed by Ouyang and Dueñas-Osorio ( 2012),notably similar to R1 , with important modif ications made regarding the representation of resilience.Instead of depicting resilience loss,R2 provides a straightforward measurement of the resilience capacity (Eq.2):
R3 proposed by Francis and Bekera ( 2014) depicts resilience from different performance components, namely, rapidity, robustness, recovery, and time to recovery (Eqs.3 and 4):

t0 The time of disruption occurrence td The time of stable performance immediately after the disaster tpr The time to start the recovery tr The end time of recovery P0 The performance before the disaster occurred Pd The stable performance immediately after the disaster Ppr The performance at the beginning of recovery Pr The steady performance after recovery P(t) The actual level of performance TP(t) The target performance

whereXiis the percentage of initial performance loss,Xi′is the performance loss immediately ref lected in the system before the event (i+1) ,Tiis the recovery time, andT*is the predetermined time, allowing for the comparison of multiple cases under the same relative scale.
R5 proposed by Henry and Ramirez-Marquez ( 2012) measures the recovery (robustness) of the system via the differences between the after-recovery (before-event) performance and worst performance (Eq.6):
Toroghi and Thomas ( 2020) proposed R 6 , which measures the weighted average ofRa(robustness),Rb(redundancy),Rc(resourcefulness),Rd(rapidity), andRe(readjust capacity).The end-users of the system are divided into three categories—priority, emergency, and routine, and are comprehensively considered based on the above f vie properties according to Eq.7:
R7 was proposed by Ayyub ( 2014), where a failure event occurs at the timeT0, with a failure duration of ΔTf, and after a continuous recovery time ( ΔTr), the system returns to its f inal steady state, as derived via Eqs.8— 10:
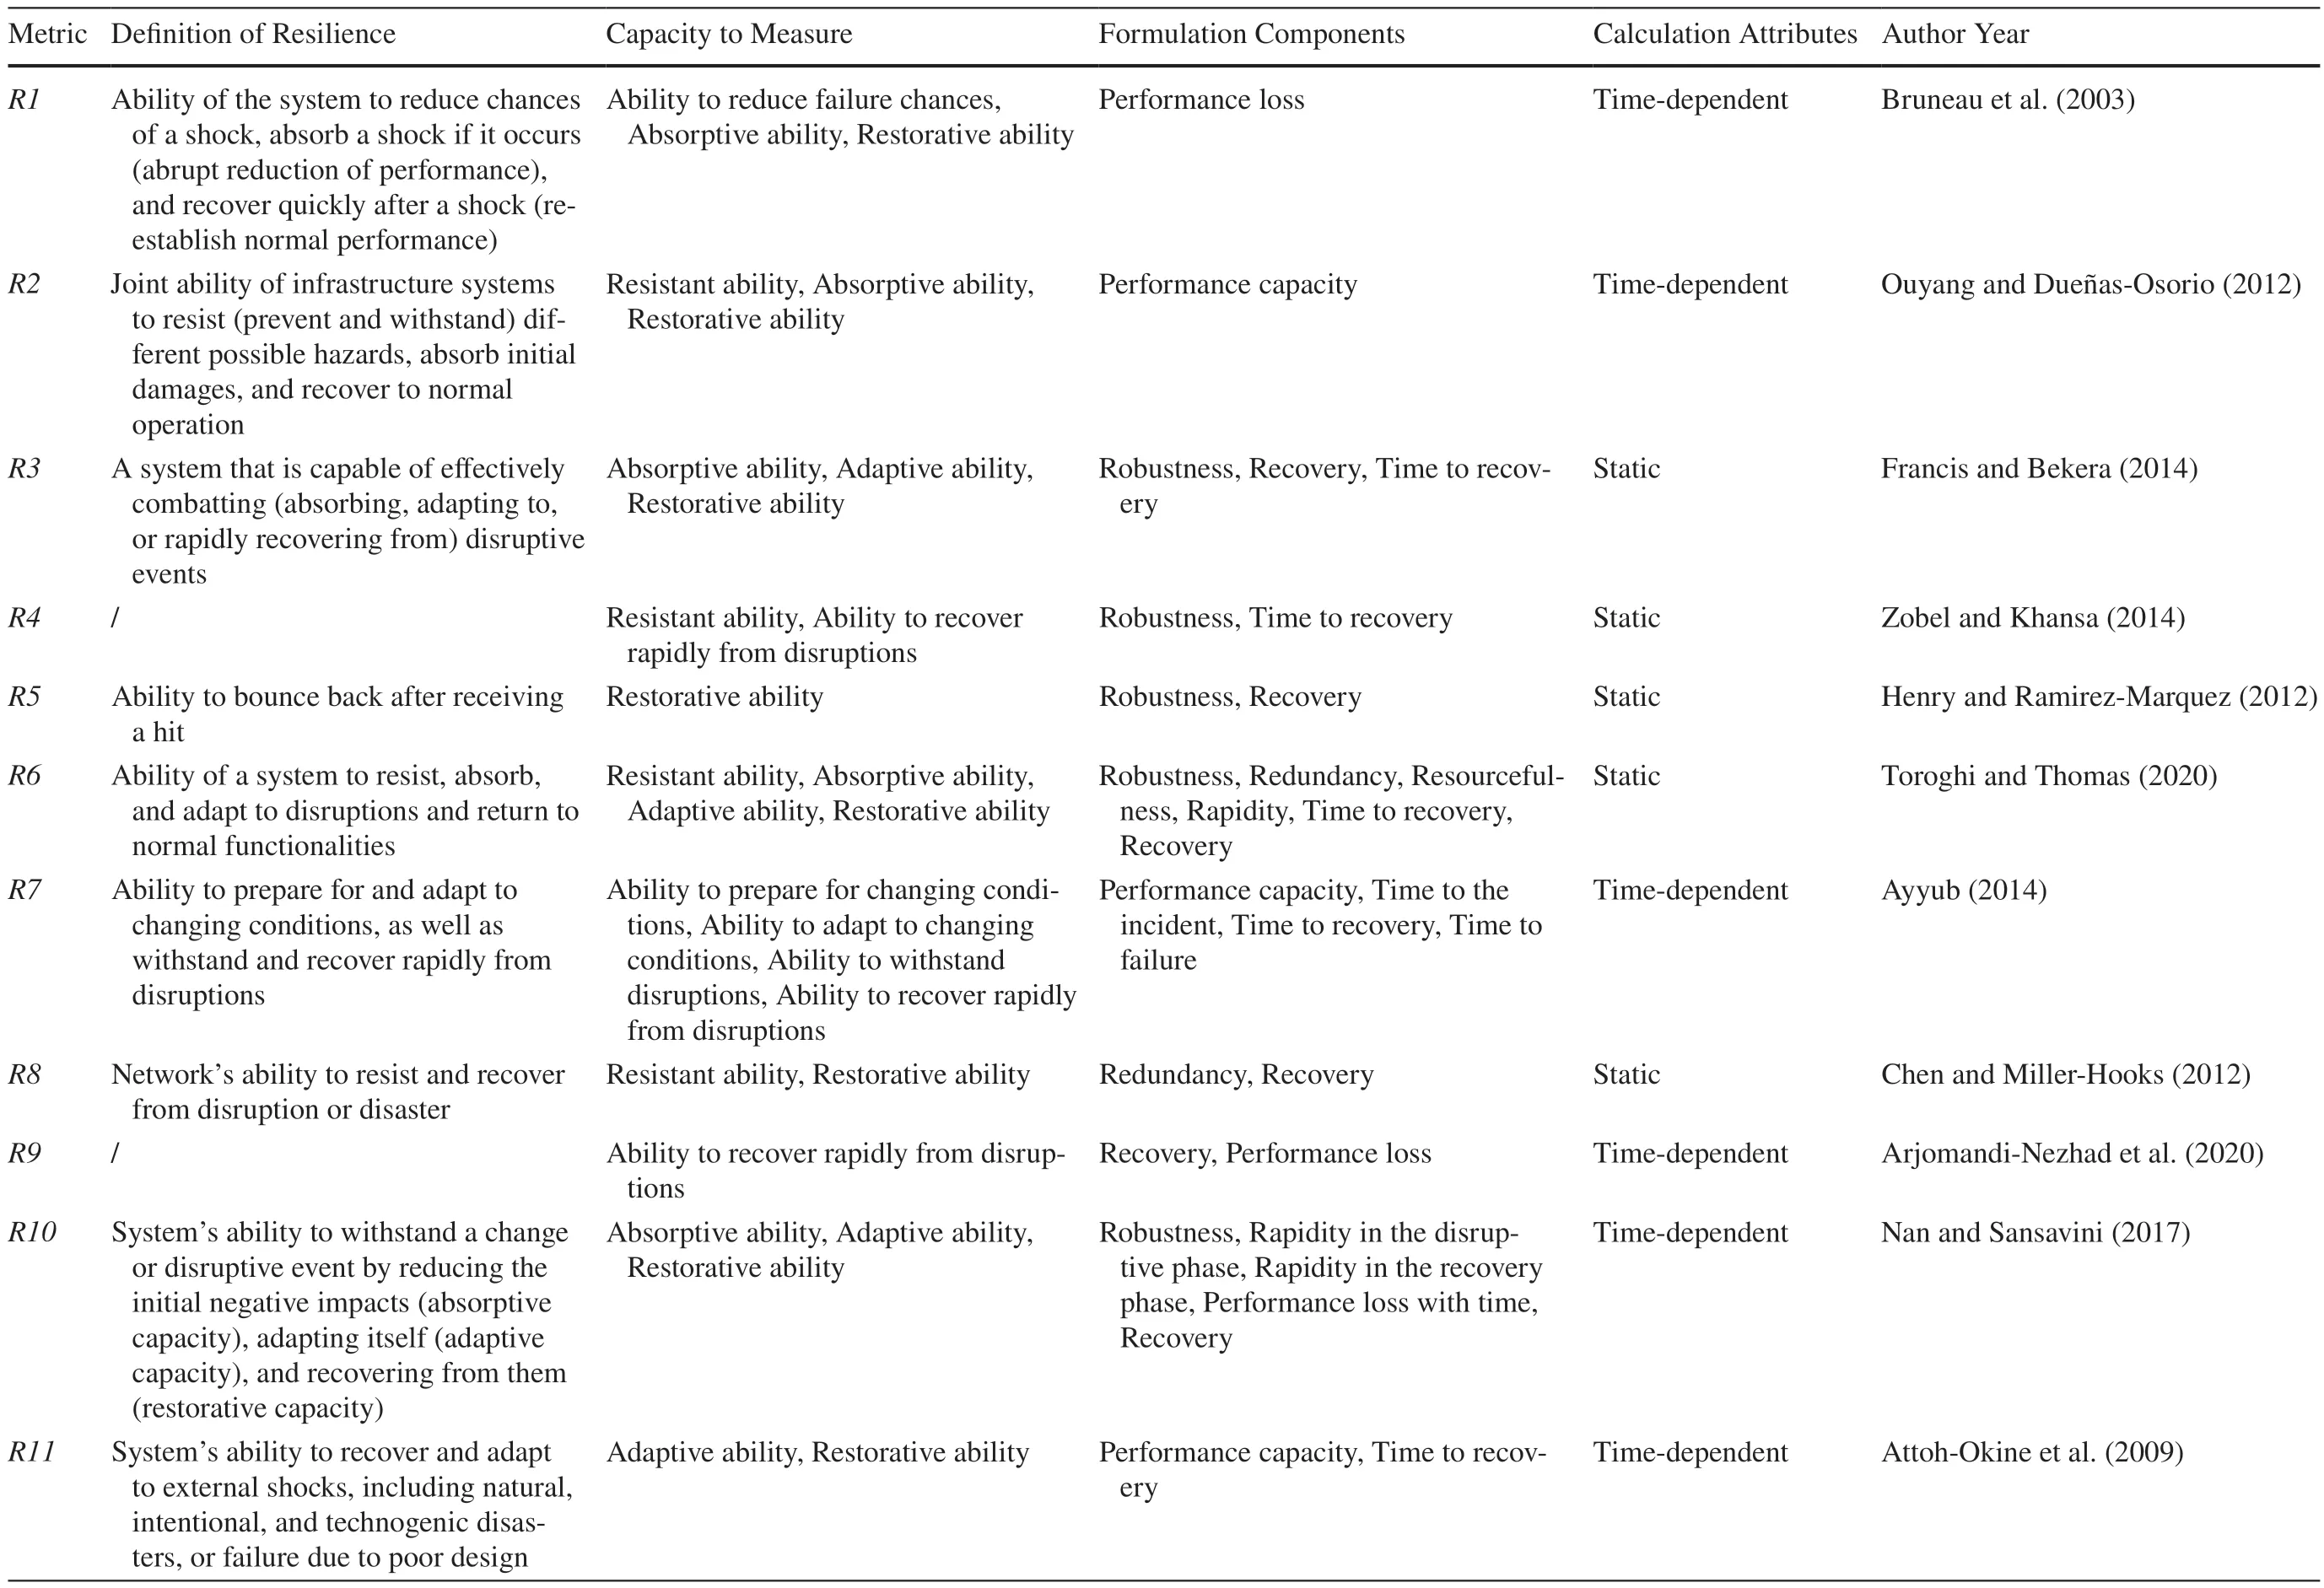
Table 1 S ummary and comparisons of the basic characteristics of the selected metrics
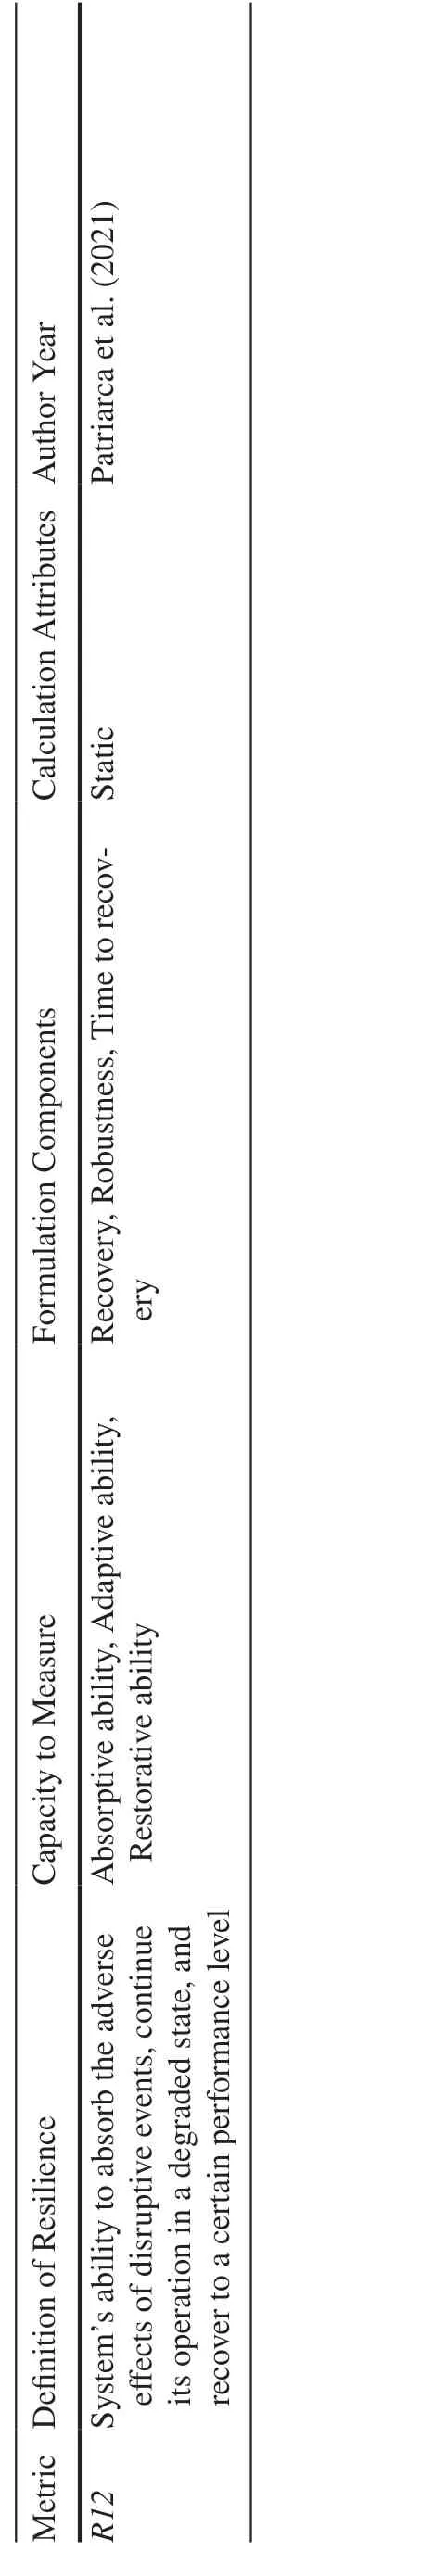
Table 1 (continued)
R8 developed by Chen and Miller-Hooks ( 2012) measures the resilience of multi-modal transportation systems,which is def ined as the share of expected post-disaster demands that the system meets under a given condition(Eq.11):
wheredwandDware the maximum demand level at the post- and pre-disaster stages, respectively.In this study,R8is characterized by its initial performance before disruption and stable performance after recovery.
R9 proposed by Arjomandi-Nezhad et al.( 2020) measures rapidity by dividing the recovery performance by the average time of performance loss (Eq.12):

whereRAPIdis(RAPIrec) is the rapidity in the disruptive(recovery) phase, def ined as the average slope of the system performance curve during the disruptive (recovery)phase;RAis the ratio of recovered performance to lost performance; andTAPLis the time-averaged performance loss of the system, dividing the area enclosed by the initial and actual performance curves of the system by time.
Tierney and Bruneau ( 2007) showed that resilience can be measured by the performance of a system after a disaster,and the time taken to return to the initial level of performance.Accordingly,R11 was proposed by Attoh-Okine et al.( 2009).Much like the resilience triangle,R11 measures the time-dependent performance capacity, but outlines percentage changes per unit of time (Eq.15):
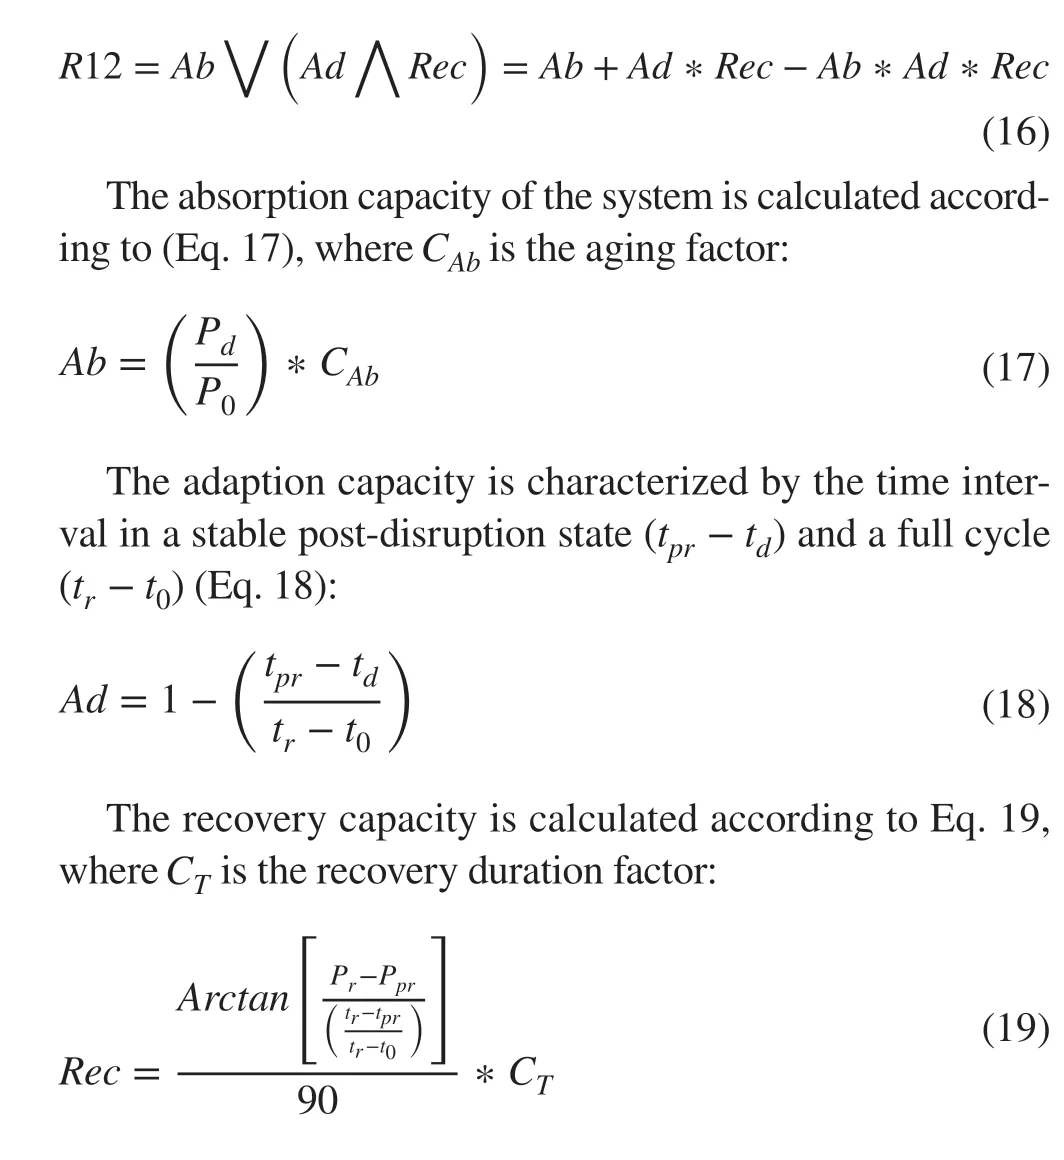
R12 proposed by Patriarca et al.( 2021) is calculated by the following Boolean relationship among the absorptive,adaptive, and restorative capacities of the system (Eq.16):
3 Data
In this section, the details of the data and the process of data cleaning and treatment are introduced.To evaluate the performance of the selected metrics, China’s civil aviation system impacted by the COVID-19 pandemic was used as an effective case study.Data regarding daily new diagnosed cases and on-time execution rates were collected for 427 days from 20 January 2020 to 21 March 2021 (Fig.1).Daily new diagnosed cases data in China’s mainland were acquired from the daily report of the National Health Commission of the People’s Republic of China ( 2021).The f light execution rates were collected from f light stewards, and the Operation and Management Center of the Civil Aviation Administration of China ( 2021).The data of aviation execution rate were used to characterize Chinese aviation system performance.
As shown in Fig.1, COVID-19 has had a signif icant impact on China’s aviation industry.Following the national alert regarding the phenomenon of human-to-human transmission of COVID-19 on 20 January 2020, the civil aviation execution rate in China plummeted from 93.6 to 20.2%within 24 days.Only a few weeks later, with the acceleration of full-population screening testing and fast treatment responses, the epidemic was gradually brought under control, and the f light on-time execution rate gradually recovered.However, recurrent outbreaks, as well as related travel restrictions and epidemic control policies, had brought a large number of f luctuations to various extents in aviation system performance up until early March 2021.
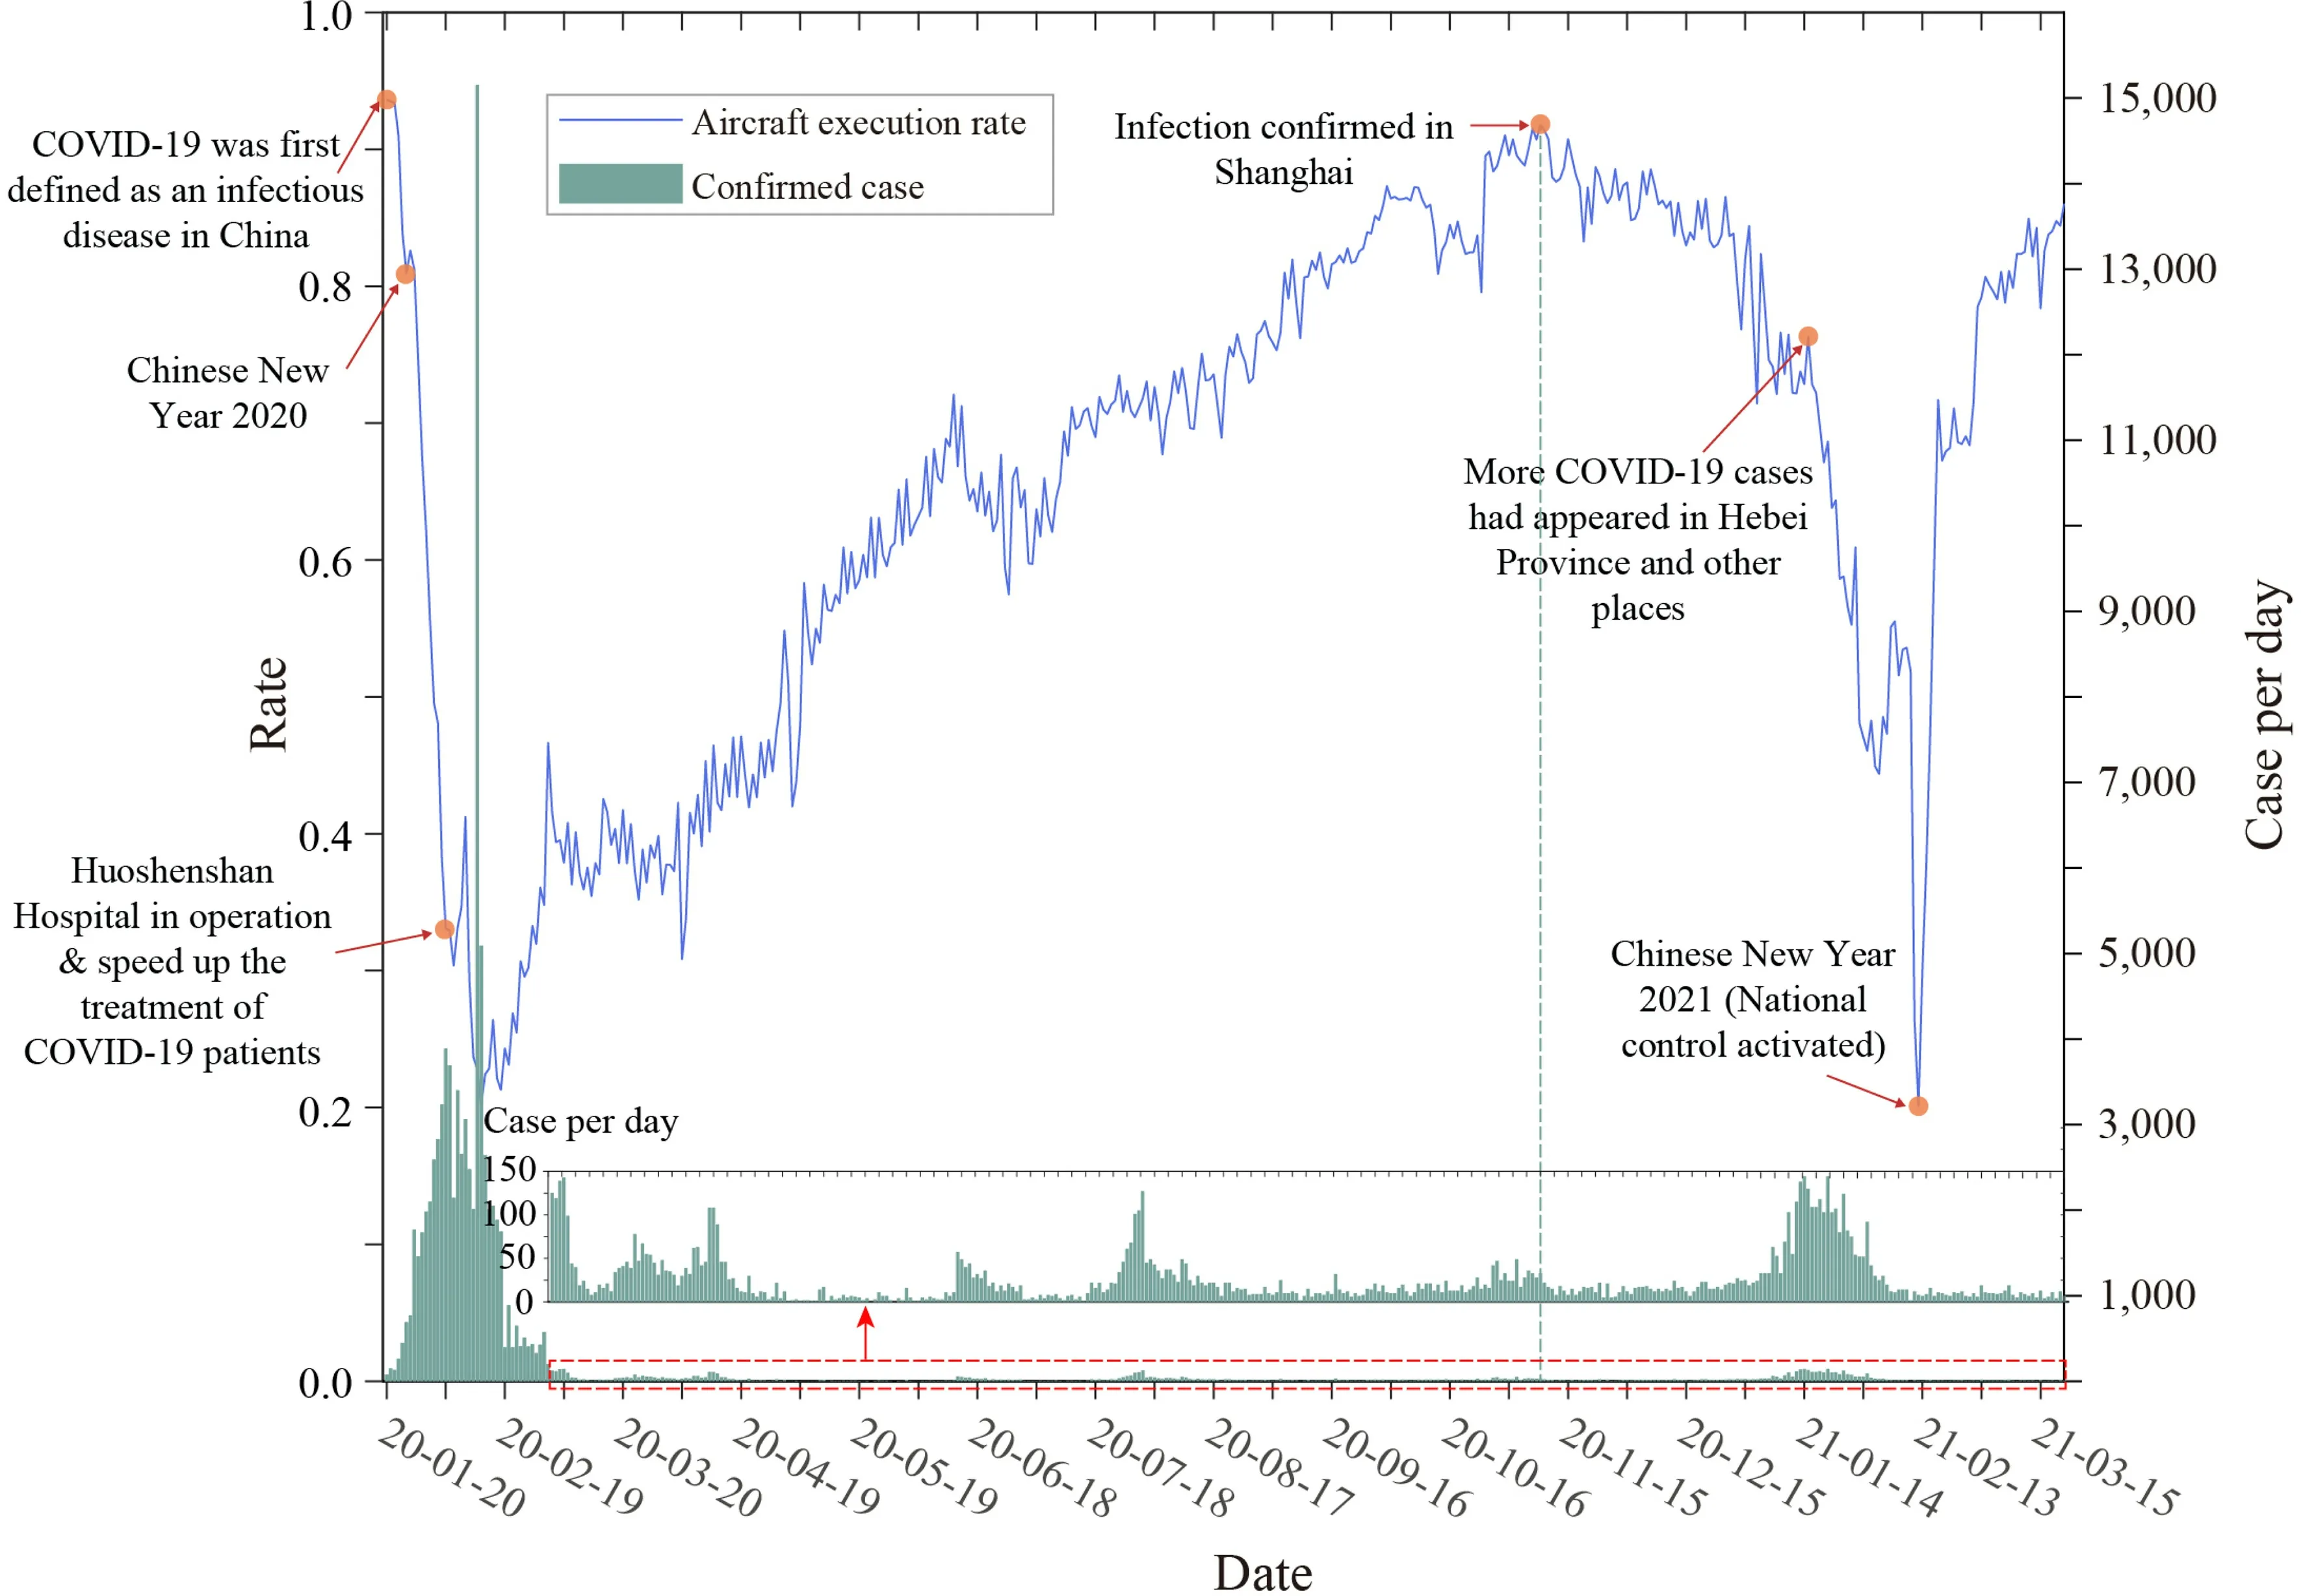
Fig.1 Civil aviation execution rate under COVID-19
In preliminary data processing, moving average, exponential, and Savitzky-Golay smoothing methods were considered to smooth the data for reducing possible data noises.The result yielded by Savitzky-Golay smoothing processes demonstrates a better outcome by retaining the extrema and time scale information while dealing with data noise.In addition, to test the temporal sensitivity of the metrics, the whole observation period was then divided into multiple cycles by two temporal scales—the daily scale (smooth span= 1 day) and the weekly scale (smooth span = 7 days)—respectively.The performance between two local peaks was def ined as an effective resilient cycle, including disruption and recovery phases.In total, there were 59 and 134 cycles at the weekly and daily scales, respectively.These performance curves f luctuated at various degrees, including full recovery, insuffi cient recovery, and adapted recovery, which cover all scenarios of systems performance to test the performance of the selected metrics.
4 Results
In the results section, the similarities and differences of metrics are compared using a combination of quantitative and qualitative approaches.The 12 selected metrics were implemented using the collected data, and correlation analysis and statistical hypothesis testing (that is, the independent-samples Kruskal-Wallis test) were applied to compare the association between metrics.Finally, the similarities and differences of metrics are analyzed using a qualitative approach.
4.1 Quantitative Analyses
In this section, we present the results from the quantitative analyses and compare the metrics based on the quantif ication outcomes.
4.1.1 Quantif ication Outcomes
Figure 2 shows the quantif ied resilience values of the selected 12 metrics across the two temporal scales.The value ranges of the metrics were extremely different;accordingly, metrics were grouped based on their value ranges in the subplots.The results show that for both temporal scales, R2, R3, R4, R7, R8, and R12 demonstrated similar trends, indicating that these metrics quantify resilience in a similar way.But R1, R5, R9, and R10 had extreme values, with the values remaining at a low level across most cycles.Interestingly, R5 and R10 exhibited roughly opposite trends.Among all metrics, R11 demonstrated a unique trend of resilience, which was considered incomparable with other metrics, thereby implying that this metric has a distinct underlying mechanism for formulating resilience.In addition, R1, R9, and R10 returned negative values for some particular cycles, seemingly contradicting the def inition of resilience.
4.1.2 Association Analysis
A correlation analysis was conducted to test whether the visual trends observed above could quantitatively conf irm the relationships between metric pairs, which has been proven to be reliable in many studies (Nishimi et al.2021;Vishnu et al.2023).Before calculating the correlation coeffi cients, the normality assumption was tested using the Kolmogorov-Smirnov test for the obtained resilience indices across both temporal scales.As it was revealed that most of the calculated outcomes of the metrics were not normally distributed, Spearman’s correlation coeffi cient was applied.
Figure 3 shows the correlation matrix for the pairwise analysis of all weekly outcome metrics.From the results, 23 metric pairs demonstrated a highly strong positive correlation, while f ive had a strong positive correlation, two had a moderate positive correlation, three displayed a weak positive correlation, and f ive pairs maintained a very weak positive or no correlation.In contrast, 11 metric pairs showed a highly strong negative correlation, four had a strong negative correlation, one showed a moderate negative correlation,seven pairs displayed a weak negative correlation, and f ive pairs had a very weak negative or no correlation.Table 2 summarizes the correlation results, presenting the detailed metric pairs for each category.From the weekly scale correlation results, it can be observed that the ratio between positive and negative correlations was roughly 33:23 (excluding the very weak or no correlation pairs), indicating a higher rate of positive correlations among the tested metrics in terms of resilience outcomes.
The daily scale results demonstrate a higher similarity in terms of the overall correlation pair characteristics.Here,the overall ratio between positive and negative correlations was 34:16, indicating that more metrics shared similar time-series trends in their resilience quantif ication.One of the possible explanations for this ratio difference between weekly and daily cases is that, compared to the weekly scale,the number of resilience cycles is larger in daily scale performance, which indicates that the correlation tests at the daily scale have more samples than the weekly scale.

Fig.2 Quantif ication outcomes for all metrics across daily and weekly cycles
4.1.3 Signif icance of Differences
As the correlation analyses only indicated if metric pairs showed similar trends in their time-series quantif ication results, it remained necessary to explore whether the quantif ied resilience indices signif icantly differed from one series to another.Accordingly, the statistical differences of metric pairs were tested using the independentsamples Kruskal—Wallis test, a nonparametric test for nonnormally distributed samples, which has been shown to be reliable in other studies (Sherwani et al.2021).Again,using the weekly scale as the case example, the differences in all 12 metrics were found to be statistically signif icant(the signif icance level is less than 0.05).Furthermore, a pairwise diagnosis was also performed for more detailed comparisons.Figure 4 presents the overlaid results from both correlation and significance tests to facilitate a cross-comparison.
Multiple pairs, such as R1—R2 and R1—R3, demonstrated signif icant differences in terms of the resilience they quantif ied (in total, 35 pairs of metrics f it this category); whereas pairs including R1—R6 and R1—R9 showed no signif ciant differences (N= 31 pairs).On the daily scale, the total number of these two categories was slightly different (N= 44 and 22 pairs with and without signif icant differences, respectively).
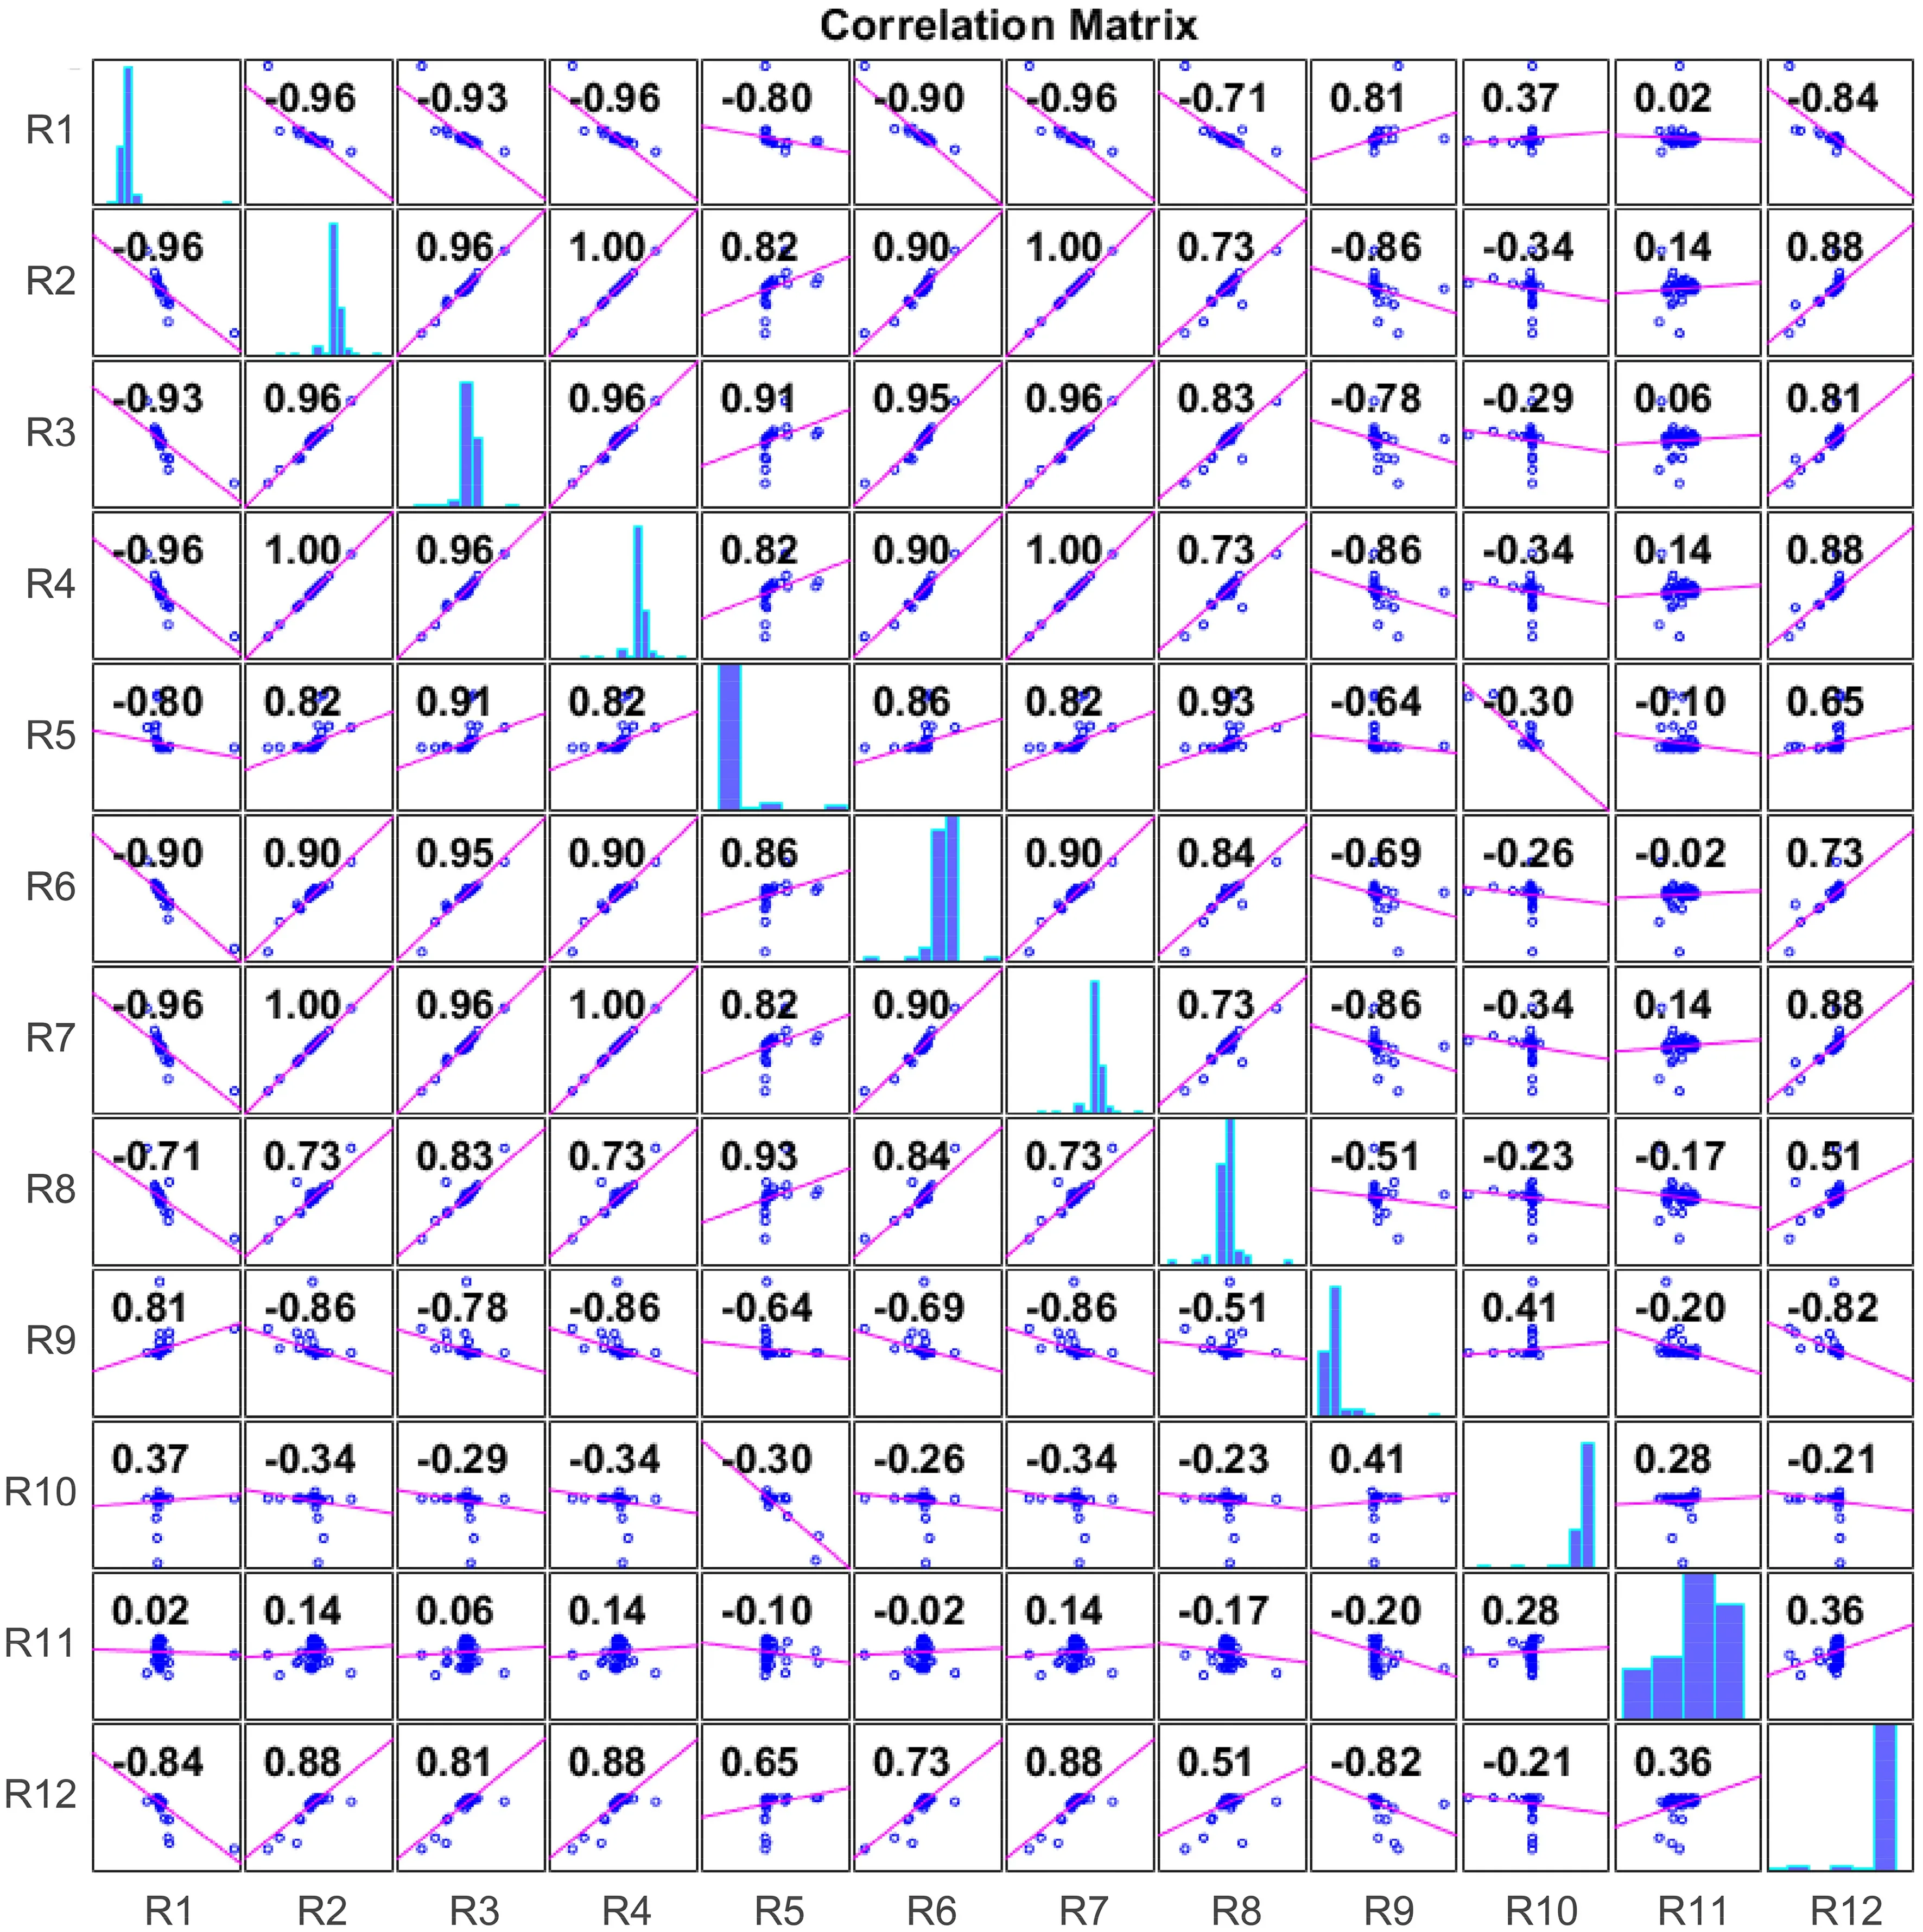
Fig.3 Correlation matrix for all metrics on a weekly scale
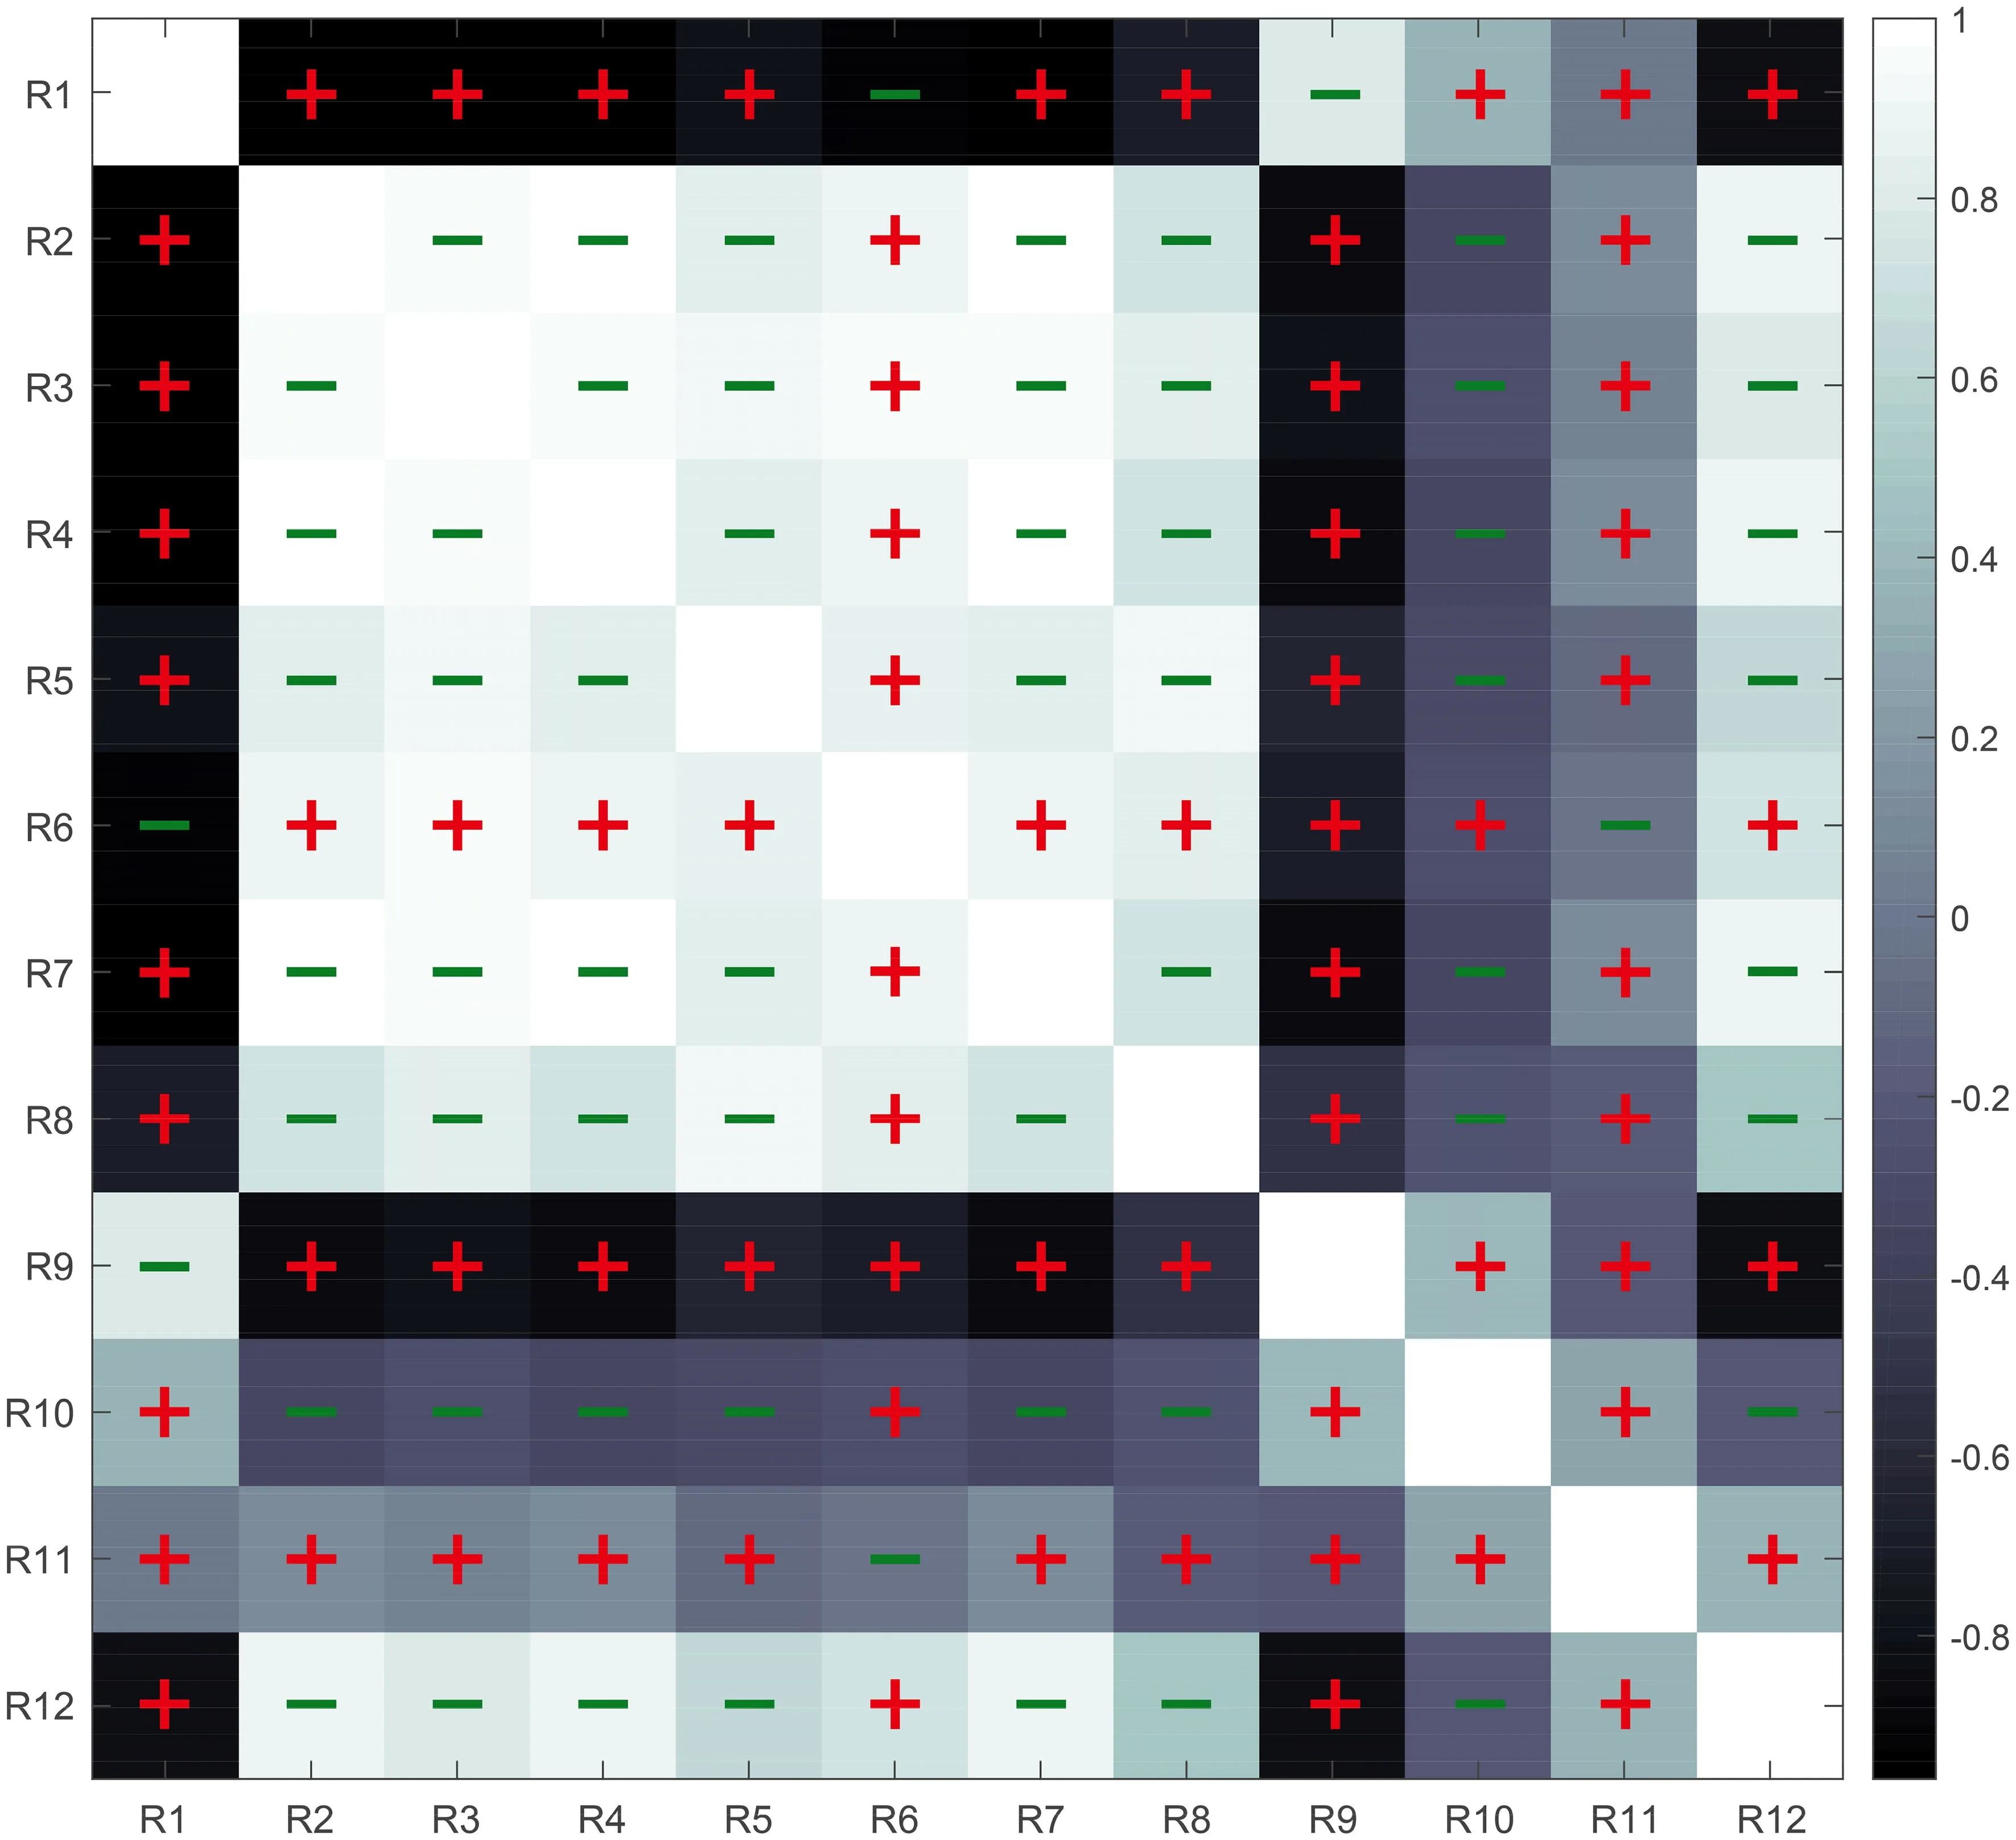
Fig.4 Correlation matrix and statistical tests on pairwise differences for all metrics across the weekly scale.The colors represent the correlation coeffi cients, the “+” sign indicates that the difference in quan-
4.1.4 Metrics Performance Against Changes in Temporal Scales
In response to the research question, it was speculated that if two metrics have a highly strong positive correlation, with no signif icant differences in their quantif ication outcomes,they are likely highly similar metrics essentially measuring the same resilience under similar def initions.In contrast,if two metrics produced highly negative correlations with signif icant differences in their quantif ied indices, they are essentially two distinct metrics based on different or even unrelated interpretations of “resilience.”tif ied outcomes between a pair of metrics is statistically signif icant,and the “-” sign indicates that the difference in quantif ied outcomes between a pair of metrics is not statistically signif icant.
Accordingly, the results can be easily understood by mapping all pairs of metrics in their respective quadrants(Fig.5), and by overlaying the weekly- and daily-scale results, stable pairs of metrics whose performance could be less sensitive to changes in the temporal scales of system’s time-series functionality can be identif ied.From the results,in the total 66 metric pairs, only 12 pairs showed high positive correlations with no signif icant quantif ication differences, including R2—R3, R2—R4, R2—R7, R2—R12, R3—R4,R3—R5, R3—R7, R3—R12, R4—R7, R4—R12, R5—R8, and R7—R12.This implies that they might measure the same concept of resilience in terms of quantitative analyses.On the other hand, R1—R2, R1—R3, R1—R4, and R1—R7 are based on distinct interpretations of “resilience” in terms of quantif ication outcomes.
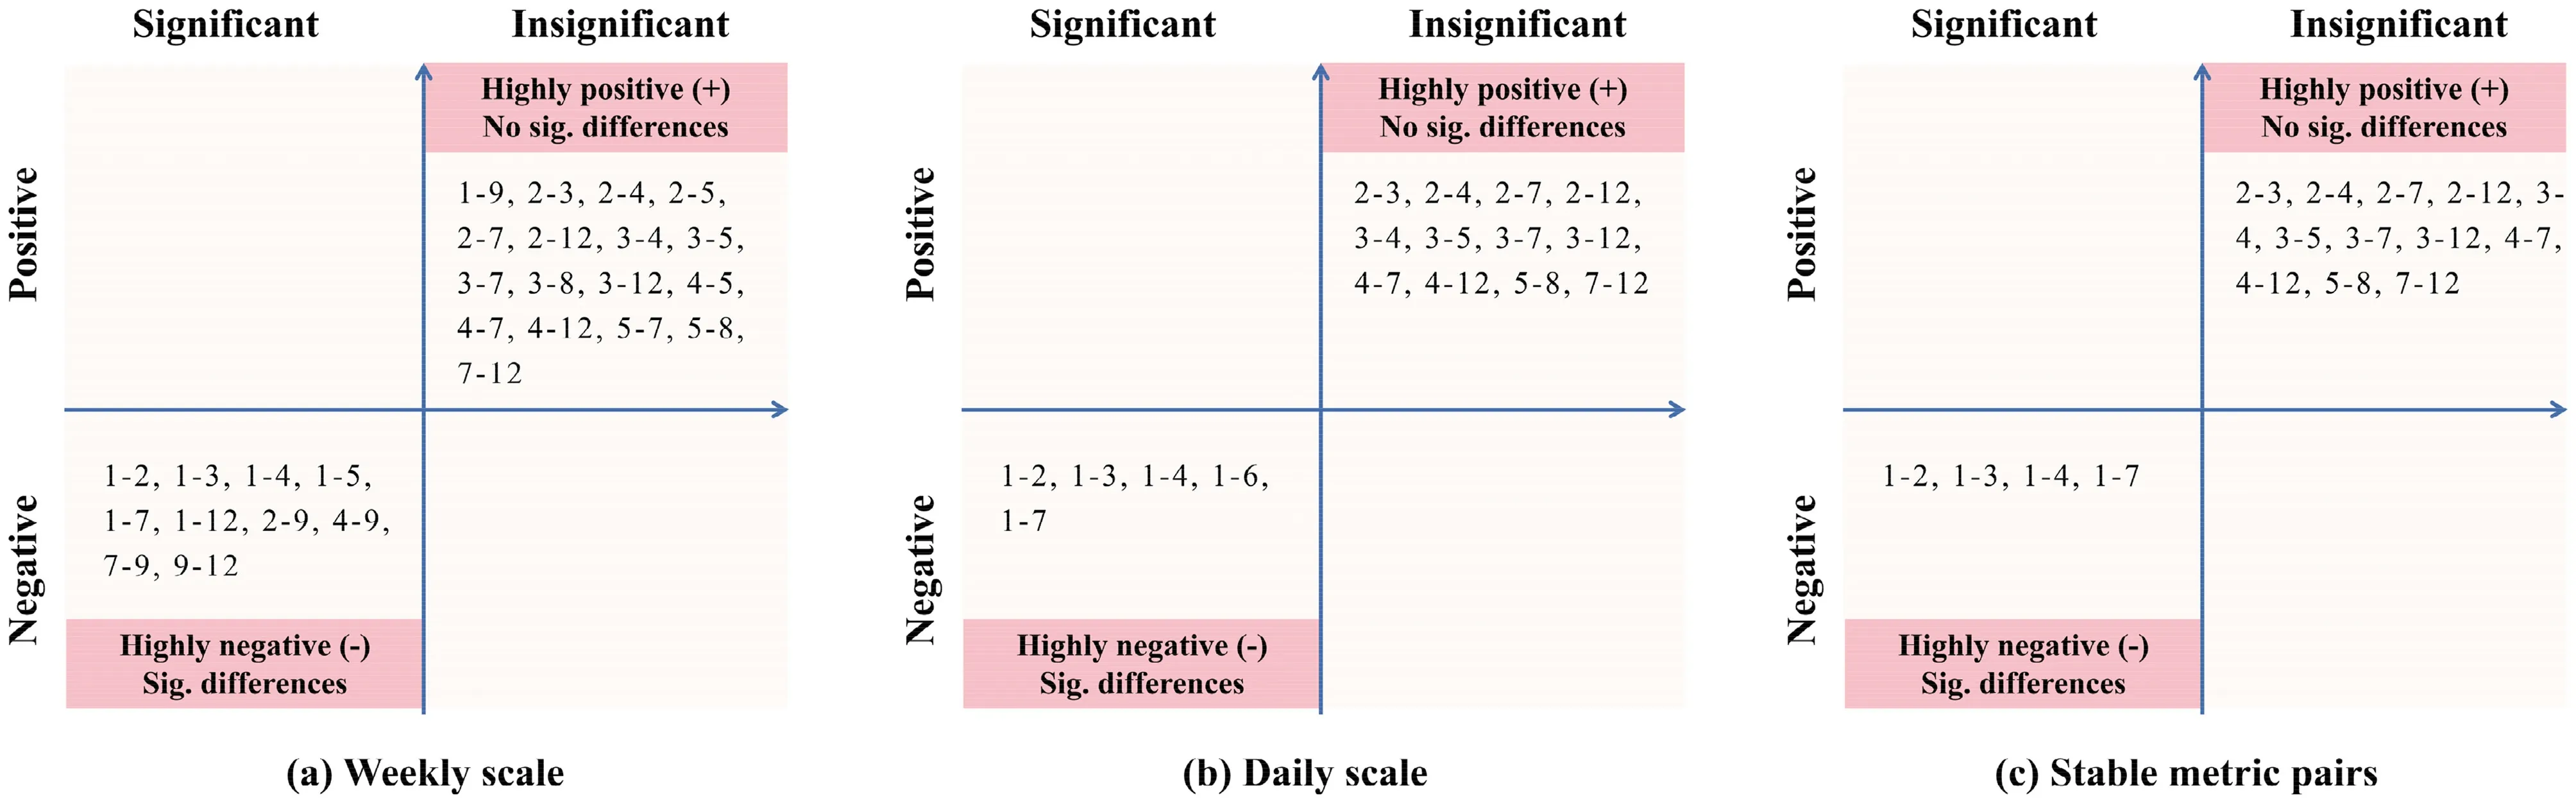
Fig.5 Correlation matrix and statistical tests on pairwise differences for all metrics.a Results at the weekly scale; b Results at the daily scale; c The overlapping metric pairs between a and b, which are the stable pairs against changes in the temporal scale.Note The total number of metric pairs is 66.The numbers in the f igure indicate the R1 to R12 metrics.
Even though many of the later proposed resilience metrics were inspired or even based on the classic “resilience-triangle” metric (that is, R1, the most classic metric proposed by Bruneau et al.( 2003)), R1 showed quite different quantif ication outcomes compared to many others.A possible explanation for this observation is that R1 is based on quantifying the performance loss owing to disruptive events under performance curves, which largely differs from other subsequent proposed metrics.Newer metrics place less emphasis on performance loss as a whole for indicating system resilience, instead focusing on individual resilience-building capacities at each system stage, indicating that many subsequent and recently developed metrics have diverged from this traditional interpretation of resilience.This can also be roughly conf irmed by the evolution of the resilience concept and the “capacities to measure” information in Table 1.
4.2 Qualitative Analyses
From the quantitative results, it can be seen that most metrics are not strongly positively correlated and have signif icant differences, which means that most metrics measure different resilience.To unravel the details of the concept interpretation and understand resilience metrics, we further discuss the results in terms of (1) the def initions, (2) the components, and (3) the expressions of the selected metrics in a qualitative approach.
First, metrics, functioning as interpretations of the def inition of “resilience” often measure one or several capacities based on different resilience def initions, with absorptive, adaptive, and restorative capacities being the most common ones.Through the literature review, we found that among the selected metrics, absorptive capacity is often measured by robustness (for example, R3, R5, R12), while restorative capacity is usually expressed by the level of system performance recovery (for example, R5, R8, R10,R12) or recovery rapidity (for example, R3, R6, R10).No consensus has yet been reached surrounding adaptive capacity in practical applications.Two controversial points about adaptive capacity remain: (1) it is not commonly agreed on which stage adaptive capacity is ref lected; and(2) the components that measure adaptive capacity are not uniformly def ined.Different opinions on these controversial points have been documented in the literature.For instance, Patriarca et al.( 2021) def ined adaptive capacity as the time interval during which a system reaches a new stable post-failure state and maintains it until the recovery actions take place.Here, measurements were derived by the stable disrupted stage and full cycle stage (R12).Nan and Sansavini ( 2017) characterized adaptive capacity in the recovery stage, taking the speed and performance loss during this stage to jointly measure adaptive and restorative capacity (R10).Francis and Bekera ( 2014) expressed the adaptive capacity of a system by the proportion of the original system performance retained after reaching a new stable performance level (R3).
Based on the aforementioned discourses, it is clear that scholars hold different opinions regarding how resilience can exactly be def ined and thus interpreted in the investigation.This in part explains why different schools of thought emerged in the f ield.Indeed, this high diversity seems quite natural since the concept per se is a fuzzy and multidimensional one—scholars see it differently in different systems.However, this might also reflect a caveat that the more well-rounded the interpretation of resilience, the higher the chances that the corresponding metric developed would encounter more incompatible issues in many other application cases.This can be seen even clearer if we keep diving deeper into the metric components and their quantif ication mechanism.
Second, the components that measure resilience capacities are highly diverse, including robustness, recovery, rapidity, recovery time, resourcefulness, redundancy, performance loss, performance capacity, and more.The f irst four items are the most common components in metrics.Among them,the characterization of robustness and recovery has reached a certain consensus.Robustness is measured by how much functionality drops after the event hits, which represents the performance loss in the destruction phase (R3, R4, R5, R6,R12).Recovery is characterized by post-recovery performance after the disruptions, which indicates the degree of performance recovery in the recovery phase (R3, R5, R6,R9).In contrast, there is no consensus on the measurement of rapidity.Some scholars use recovery time (R3, R4, R6),while others use the slope of the recovery curve (R10) or the ratio of recovered performance to the average outage time (R9).Very few metrics measure the resourcefulness and redundancy of the system.Performance loss and performance capacity are characterized by the integral area, which is usually used as a comprehensive measure of resilience.Overall, the use of different components ref lects scholars’different thinking and emphasis on resilience, and different combinations of components usually form essentially different metrics.
Finally, in terms of metric expression, it is apparent that there is no unif ied model for formula construction.First,differences exist in the construction of metrics assessing the same component.For example, regarding the measurement of robustness, R3 and R12 employ the ratio of the lowest to initial resilience values, while R4 and R5 use the difference between them; however, R6 not only combines the ratio and the difference but also introduces an exponential function.Second, regarding the combination of components, some scholars have used the form of weighted sums (R6), while others have used component products or ratios (R3, R5,R10, R11) or a combination of a set of sub-models and submetrics (R7, R12).The lack of a unif ied standard formula has led to signif icant differences in the metric expression forms, which might potentially lead to different quantif ication results.All in all, these metrics, even though claim to be capable of measuring “the system resilience” in a generic way, are essentially measuring different things, which is also understandable as metrics ref lect how the concept is interpreted and def ined.Since the interpretation of resilience is different, the developed metrics would certainly measure differently.As most of the metrics cannot be used interchangeably, it highlights the necessity to carefully select which metric to use when measuring resilience with specif ic data and system constraints.
Despite the above evidence regarding the differences, we can also observe that some metrics have similar components and expressions, thus, producing highly similar quantif ication results and patterns.Here, we argue that within a certain context, these metrics can be regarded as assessing the same resilience.For instance, the association analyses showed that 12 metric pairs were highly similar across weekly and daily scales and such similarity can be quite stable against the changes in temporal scales of system performance.
5 The Proposed User Guideline
Most of the selected metrics are designed to be generic and theoretically applicable to many other infrastructure systems.However, some metrics are only applicable to specif ic systems and data types owing to their pros and cons.For instance, some metrics are suitable for continuous time series with the full picture of the system performance curves(R1, R2, R4, R7, R9, R10, and R11) because they need to track the area-based performance losses in a complete way,while some metrics only require information on the critical turning points in the performance curves (R3, R5, R6, R8,and R12), and the system performance may not necessarily be continuous.Based on the merits and disadvantages of each metric, we propose a user guide for the selected performance-based metrics (Fig.6).
For metric users, it is noteworthy that for a fuzzy system concept such as resilience, the metric construction could be highly f lexible and deeply context-dependent, resulting in stark differences between quantif ication benchmarking aligning with the diversity of its def initions.We also need to pay extra attention to the following limitations of these metrics in future metric development.
• First, some metrics are based on strong assumptions.If such assumptions cannot be relaxed in a wider context, their applicability to other systems might signif icantly deteriorate.Taking R3 as an example, this metric assumes that a set of initial operations is performed to stabilize the system to an intermediate state.However,such an intermediate state might not be achievable in all systems under different disruption scenarios.
• Second, the post-disaster performance level might be higher than that of the pre-disaster performance (that is,adaptive growth after disasters), which should be fully considered in the metric development to avoid negative scores.
• Third, some metrics were developed with a format of product or ratio, which can potentially cause extreme values and thus introduces outliers into the comparative analyses (appropriate treatment might be needed for those metrics, such as normalization and outlier treatment).
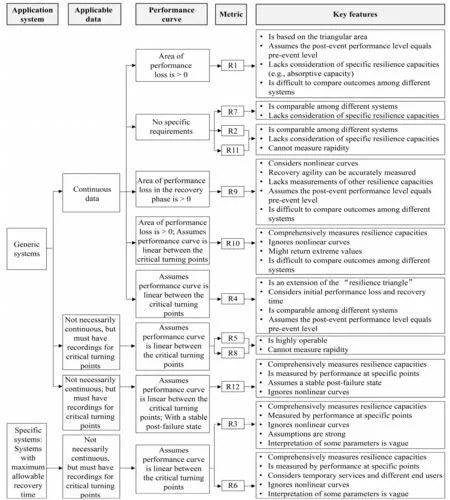
Fig.6 A brief guideline for metric users
In this sense, from the perspective of better understanding the concept of resilience, it is still worthwhile to explore a more multidimensional interpretation of resilience in urban safety studies, even though there might be a caveat of higher incompatibility risk for ever-increasingly complicated quantif ication metrics (Najarian and Lim 2019; Yarveisy et al.2020; Raouf i and Vahidinasab 2021; Xu and Chopra 2022).We speculate that this high diversity of metrics would still be the mainstream trend of resilience quantif ication studies in the foreseeable future, as indeed, the fundamental issues of resilience “of what,” “for whom,” and “by how” are dynamic and ever-changing from case to case (Cutter 2016; Meerow and Newell 2019).
6 Conclusion
Effectively quantifying resilience and understanding this fuzzy concept from multidimensional perspectives would help to provide alternative and promising solutions to urban risk management and system safety issues.The rapid emergence of quantif ication methods offers stakeholders a wider range of available tools, but it also brings two intractable challenges, including (1) do these popular performancebased metrics measure the same resilience? and (2) which metric to choose under what circumstance? Although studies on the comparison of different resilience metrics have been documented in the literature (Clédel et al.2020; Nishimi et al.2021; Vishnu et al.2023), quantitative-qualitative combined comparison of performance-based resilience metrics remains to be further explored.
In this study, 12 performance-based resilience metrics,including the classic resilience triangle, were tested using a quantitative-qualitative combined approach.We f irst verif ied their effectiveness and then performed pairwise association analyses through simple, yet effective, analytical methods using data from the aviation system in China throughout the COVID-19 pandemic.Finally, their differences and similarities were effectively assessed by conducting an in-depth analysis of their def initions of resilience, basic components,and expression forms.The main conclusions of this study can be summarized in a two-fold manner.
On the one hand, most of the metrics essentially measured different resilience, despite several stable metric pairs showing similar quantif ication results.Largely due to their different conceptual def initions, scholars have focused on various resilience capacities.Most scholars measure one or several of the system’s absorption, adaptation, and recovery,while few scholars have more closely examined the system’s abilities to prepare for, and resist disasters.Although some scholars attempt to measure the same resilience capacity, the components they selected are different.For example, R3 and R10 both measure the absorption, adaptation, and recovery capacity of systems, but R3 represents resilience via robustness, recovery, and time to recovery, whereas R10 characterized this feature with robustness, recovery, rapidity, as well as performance loss per unit time.Thus, although some metrics evaluate resilience in a similar manner, the metrics based on different def initions, components, and expressions often assess distinct components of “resilience.”
On the other hand, based on the analysis of the characteristics, advantages, and disadvantages of the 12 metrics, a user guide for their appropriate uses in different systems and with different data types has been proposed.The controversy and limitations of current metric construction, which have profound implications for future metric construction and optimization, are discussed in this article.
This study sheds new light on how we measure, think about, and make decisions related to critical infrastructure resilience.Most importantly, it provides an effective diagnosis of popular and recent quantif ication metrics, with a better understanding of the question of “how to choose.”We also acknowledge that this study has three limitations.First, many latest metrics might have emerged during the preparation of this article that were not taken into account.Future work will expand the spectrum of selected metrics and models.Second, the proposed user guideline will need to be continuously ref ined and updated as the f ield evolves.Additionally, due to the availability of the datasets, only one application case was used for implementing the selected resilience quantif ication metrics.More application cases could be explored in future studies.
AcknowledgmentsThis work was supported by (1) the Start-up Funding for New Faculty at Peking University Shenzhen Graduate School (Grant No.1270110033); (2) Guangdong Basic and Applied Basic Research Foundation (Grant Nos.2021A1515110537,2023A1515010979); and (3) the National Natural Science Foundation of China (Grant No.42376213).Another special thank is dedicated to Miss Huali Lin for her assistance in the early stage of this research.
Open AccessThis article is licensed under a Creative Commons Attribution 4.0 International License, which permits use, sharing, adaptation, distribution and reproduction in any medium or format, as long as you give appropriate credit to the original author(s) and the source,provide a link to the Creative Commons licence, and indicate if changes were made.The images or other third party material in this article are included in the article's Creative Commons licence, unless indicated otherwise in a credit line to the material.If material is not included in the article's Creative Commons licence and your intended use is not permitted by statutory regulation or exceeds the permitted use, you will need to obtain permission directly from the copyright holder.To view a copy of this licence, visit http:// creat iveco mmons.org/l icen ses/ by/4.0/.
 International Journal of Disaster Risk Science2023年5期
- International Journal of Disaster Risk Science的其它文章
- Business Continuity Management, Operational Resilience,and Organizational Resilience: Commonalities, Distinctions,and Synthesis
- A Systematic Review of Forensic Approaches to Disasters: Gaps and Challenges
- Assessing Global Landslide Casualty Risk Under Moderate Climate Change Based on Multiple GCM Projections
- Urban Earthquake Vulnerability Assessment and Mapping at the Microscale Based on the Catastrophe Progression Method
- An Index-Based Approach to Assess Social Vulnerability for Hamburg,Germany
- Cost-Benef it Analysis of the Wuxikou Integrated Flood Management Project Considering the Effects of Flood Risk Reduction and Resettlement