
Ranked-Set Sampling Based Distribution Free Control Chart with Application in CSTR Process
2023-02-27 10:41IbrahimAlmanjahieZahidRasheedMajidKhanSyedMasroorAnwarandAmmaraNawazCheema
Ibrahim M.Almanjahie,Zahid Rasheed,Majid Khan,Syed Masroor Anwar and Ammara Nawaz Cheema
1Department of Mathematics,College of Science,King Khalid University,Abha,62529,Saudi Arabia
2Statistical Research and Studies Support Unit,King Khalid University,Abha,62529,Saudi Arabia
3School of Mathematics and Statistics,Xi’an Jiaotong University China,Xi’an,710049,China
4Department of Mathematics,Women University of Azad Jammu and Kashmir,Bagh,12500,Pakistan
5Government Post Graduate College,Haripur,22620,Pakistan
6Department of Statistics,University of Azad Jammu and Kashmir,Muzaffarabad,13100,Pakistan
7Department of Mathematics,Air University,Islamabad,44000,Pakistan
ABSTRACT Nonparametric(distribution-free)control charts have been introduced in recent years when quality characteristics do not follow a specific distribution.When the sample selection is prohibitively expensive,we prefer ranked-set sampling over simple random sampling because ranked set sampling-based control charts outperform simple random sampling-based control charts.In this study, we proposed a nonparametric homogeneously weighted moving average based on the Wilcoxon signed-rank test with ranked set sampling(NPHWMARSS)control chart for detecting shifts in the process location of a continuous and symmetric distribution.Monte Carlo simulations are used to obtain the run length characteristics to evaluate the performance of the proposed NPHWMARSS control chart.The proposed NPHWMARSS control chart’s performance is compared to that of parametric and nonparametric control charts.These control charts include the exponentially weighted moving average(EWMA)control chart, Wilcoxon signed-rank with simple random sampling based the nonparametric EWMA control chart, the nonparametric EWMA sign control chart, Wilcoxon signed-rank with ranked set sampling-based the nonparametric EWMA control chart, and the homogeneously weighted moving average control charts.The findings show that the proposed NPHWMARSS control chart performs better than its competitors,particularly for the small shifts.Finally,an example is presented to demonstrate how the proposed scheme can be implemented practically.
KEYWORDS Nonparametric control charts;run-length;ranked set sampling;Wilcoxon signed-rank
1 Introduction
The statistical process control(SPC)toolkit collects various statistical tools used to monitor the production and service processes.Control charts are one of the most important tools in the SPC toolkit for detecting changes in process parameters(location and/or dispersion).There are numerous control charts for efficient process monitoring in the SPC literature.Shewhart[1]introduced the basic control charts,called the Shewhart control charts.These control charts are also known as memoryless control charts because they only use current process information.Although the Shewhart control charts are simple to design and implement, they are less sensitive for small to moderate shifts detection.The other control charts that are more sensitive than the Shewhart control charts are the Cumulative sum(CUSUM)control chart,introduced by Page[2],and the exponentially weighted moving average(EWMA)control chart suggested by Roberts[3].The CUSUM and EWMA control charts are also called the memory control chart, as these control charts use both current and previous information about the process.
Generally,it is assumed that the process often follows a specific distribution.When this assumption is violated, the quality of these objects may be affected.Nonparametric (NP) control charts are used in this scenario because they do not require the assumption of specified distribution.In addition, the population variance is unnecessary when employing NP control charts to observe the shifts in the process location.The sign(SN)and Wilcoxon signed-rank(SR)are commonly used NP techniques in the control charts context.For instance, Yang et al.[4] studied the NP EWMA sign(NPEWMA-SN)control chart for monitoring shifts in process location.Similarly,Graham et al.[5]and Graham et al.[6] investigated single observation-based NP EWMA sign and NP EWMA signed-rank control charts to monitor process location,respectively.Likewise,Chakraborty et al.[7]introduced the generally weighted moving average SN(GWMA-SN)control chart to detect the process location shifts.Later,Abid et al.[8]offered the ranked set sampling(RSS)based NP EWMA Wilcoxon signed-rank (NPREWMA-SR) control chart for monitoring shifts in process location efficiently.Moreover,Ali et al.[9]recommended NP control charts to detect location parameter changes.Also,Ali et al.[9]designed the RSS-based NP EWMA SN(NPREWMA-SN)control chart for monitoring shifts in process location.
The CUSUM and EWMA types schemes and modified versions are used for efficient process monitoring.For instance, Lucas et al.[10] offered the combined Shewhart-EWMA (CS-EWMA)control chart to enhance the shift detection ability in the process location.Similarly,Shamma et al.[11]proposed a double EWMA (DEWMA) chart, outperforming the EWMA control chart in early process location shifts detection.Likewise,Zhang et al.[12]introduced the DEWMA chart’s run length(RL)features.They suggested that DEWMA and EWMA charts are equally beneficial for detecting large shifts in process parameters.Later, Abbas et al.[13] and Zaman et al.[14] designed the mixed EWMA-CUSUM (MEC) and mixed CUSUM-EWMA (MCE) charts, respectively, to efficiently monitor process location shifts.Also,Anwar et al.[15]suggested auxiliary information-based(AIB)MEC and MCE control charts for monitoring the process location parameter.For other CUSUM and EWMA based studies, the readers are referred to the work of Adegoke et al.[16], Sanusi et al.[17],Haq[18],Zaman et al.[19],Aslam et al.[20],Adeoti et al.[21],Anwar et al.[15],Abbasi et al.[22],Rasheed et al.[23],Rasheed et al.[24],Anwar et al.[25],Liu et al.[26],and Rasheed et al.[27].
Hunter[28]noticed that the EWMA control chart assigns a higher weight to current observations and less weight to prior observations of the process.Later,Abbas[29]proposed the homogeneously weighted moving average(HWMA)control chart for observing shifts in process location.After that,Abid et al.[30] introduced the mixed HWMA-CUSUM (MHC) control chart for monitoring shifts in the process location.Similarly,Adeoti et al.[31]advocated a hybrid HWMA(HHWMA)control chart to detect the process location shifts.In addition, Abid et al.[32] offered the double HWMA(DHWMA)control chart to observe process location shifts.They showed that the DHWMA control chart has better detection ability than the HWMA control chart.Recently,Anwar et al.[33]suggested an AIB DHWMA control chart for improved process location monitoring.
Simple random sampling(SRS)and perfect RSS are frequently used in SPC to monitor underlying process data.These sampling techniques are commonly used with parametric and nonparametric control charts.However,when actual measurements are difficult to obtain,or the cost of sampling is prohibitively expensive,the RSS should be used instead of SRS.Ranking errors can impact estimator performance and result in ambiguous estimates.Dell et al.[34] studied the impacts of inaccuracy and imperfect RSS on the performance of mean estimators.They claim that the RSS mean estimator remains unbiased when imperfect ranking is used and outperforms the SRS estimator.Besides that,the RSS’s efficiency remains higher than that of the imperfect RSS and SRS.Numerous NP HWMA type control charts based on simple random sampling (SRS) are available.Still, according to the author’s knowledge, no NP HWMA control chart based on perfect and imperfect RSS is present in the literature.Capitalizing this research gap, this article introduces an NP HWMA SR control chart with perfect and imperfect RSS (NPHWMARSS) for monitoring process location shifts for continuous and symmetric distributions.The performance measures, such as average run length(ARL), median run length (MDRL), and standard deviation of run-length (SDRL), are computed under different distributions,including the normal,student’st,contaminated normal(CN),Laplace,and logistic distributions.Based on these performance measures,the proposed NPHWMARSScontrol chart is compared to the competing control charts,such as EWMA,NPEWMA-SR,NPEWMA-SN,NPREWMA-SR,and HWMA control charts.The comparison indicates the superiority of proposed NPHWMARSScontrol chart over the competing control charts in small to moderate shift detection.
The remainder of the paper is structured as follows:Section 2 offers the proposed control chart’s methodology and design and the competing control chart.Section 3 evaluates the IC and OOC performance of the proposed NPHWMARSScontrol chart.Section 4 covers a comparative study of the proposed NPHWMARSSchart,whereas Section 5 addresses a real-life application.Lastly,Section 6 provides the concluding remarks of the study.
2 Competing and Proposed Control Charts
This section explains the design structure of the proposed control chart and the competing control charts.The competing control charts include EWMA,NPEWMA-SR,NPEWMA-SN,NPREWMASR, and HWMA control charts.More details are included in the following subsections, given as follows.
2.1 Classical EWMA Control Chart
SupposeXis the process characteristic that follows a normal distribution,i.e.,X~N(μ0+δσ0,σ0).Letbe thet-th sample mean andbe thet-th sample standard deviation,so for the in-control(IC)situation,~Nμ0,σ02/nfort= 1,2,....Roberts[3]introduced the classical EWMA control chart,which effectively identifies small to moderate shifts in process location.The classical EWMA control chart is defined by the plotting statistic given as follows:
whereηis a smoothing constant such thatη∈(0,1]and the initial valueE0=μ0.The control limits are based on the statisticEtcan be defined as follows:
TheLis the control chart coefficient,and its value is determined so that IC ARL is equal to desired pre-assumed value.The process is considered to IC ifLCL(EWMA)t <Et <UCL(EWMA)t;otherwise,the process is declared out of control(OOC).
2.2 NPEWMA-SR Control Chart
Graham et al.[6] suggested the SRS-based NP EWMA SR (NPEWMA-SR) control chart for monitoring shifts in the process location.Ifis the rank of the absolute deviation of observations from true medianfort=1,2,3,...andq=1,2,3,...,n,then the Wilcoxon signed rank statistic is denoted asSR(SRS)tand can be defined as follows:
Bakir[35]and Abbas et al.[36]suggested thatSR(SRS)tis linearly associated to signed rank statisticTn+by t he relation,that is,As a result,the mean and variance ofSR(SRS)tare,respectively,given asandvarThe plotting statistic of the NPEWMA-SR control chart is defined as follows:
whereESR(SRS)0=μ0.The control limits are based onE(SR(SRS)t)andvar(SR(SRS)t)are as follows:
If the plotting statisticESR(SRS)t >UCL(NPEWMA-SR)torESR(SRS)t <LCL(NPEWMA-SR)t, the underlying process is considered OOC;conversely,the process is IC.
2.3 NPEWMA-SN Control Chart
SupposeXt1,Xt2,...,Xtmdenotes thetth (t=1,2,3,...)rational sub-groups of independent observations from an undefined continuous distribution of the process characteristic.Let M0denotes the true IC median of the process,andXtq-M0represent all possible differences fort= 1,2,3,...andq= 1,2,3,...,n.In this case, the sign statistic, i.e.,, indicate values of -1,0,and 1,where the value-1 implies that the difference is smaller than M0,0(zero)if the difference is equal to M0and 1 if the difference is greater than M0.The mean and variance of the statisticSNtareE(SNt) =n(2p-1) andvar(SNt) = 4np(1-p), respectively.Graham et al.[6] introduced the NPEWMA-SN control chart by defining the plotting statisticE(SN)t,based on the statisticSNtgiven as follows:
whereE(SN)0=μ0.The control limits are based onE(SNt)andvar(SNt)can be defined as follows:
The underlying process is said to be IC ifLCL(NPEWMA-SN) <E(SN)t <UCL(NPEWMA-SN);otherwise,the process under the NPEWMA-SN control chart is considered OOC.
2.4 NPREWMA-SR Control Chart
Abid et al.[8]recommended the RSS-based NP EWMA SR(NPREWMA-SR)control chart for monitoring the process location shifts.When obtaining measurements for a variable of interest is both expensive and complicated, RSS is desirable to SRS; however, ranking these measurements can be accomplished using a extensively available and cost-effective ranking technique.
When measured values are deleterious or costly,but ranking findings is comparatively simple,the RSS is effective[37].The proposed structure based on RSS is a more efficient alternative to the usual nonparametric control chart relying on Wilcoxon signed rank statistic.RSS involves the selection of a simple random sample of sizenfrom a particular population,followed by the ranking of the findings by experts.The RSS is mostly defined in terms of perfect and imperfect ranking.The perfect and imperfect ranking structures are similar in general.A correlation of one between the two variables is required to achieve perfect ranking in any bivariate normal model where the variable of interest(X)and the ranking variable (Y) are used; otherwise, the ranking will be imperfect.The RSS sampling technique,stating that RSS with sample sizenis obtained from a quality variableXtj(h).The suffixest(t= 1,2,3,...)used for sample number,j(j= 1,2,...,n)for observations,andh(h= 1,2,...,m)represents the cycle number in RSS approach,respectively.The unit with the lowest rank is selected for measurement.The remainingn-1 findings are handed back to a population,and a new sample ofnis drawn.The experts rank the findings once more, and the second lowest is chosen, evaluated,and then-1 remaining findings are brought back.We continue the processmtimes,yielding a ranked set sample with sizer=nm.In this study,we assumem= 1 for a valid assessment of the proposed control chart to the competitors,sor=nm,which isr=n.
Then, using RSS data from the hth cycle, the unbiased estimator of the population mean, as defined by Takahasi et al.[38], is described as:h= 1,2,...,m.Then variance ofis given by
Assume that the variable of interestXis difficult to measure and order,but that there is a linked variableYthat is correlated withX(Dell et al.[34]).A variableYcan be utilised to obtain the rank ofXin the following way:n2bivariate units are chosen from the population and structured intonsets of sizeneach.TheXassociated with the smallestYis determined from the first set of size n.TheXassociated with the second smallestYis measured from the second set of sizen.This process is repeated until theXassociated with the largestYfrom the nth set is determined.The cycle is repeatedrtimes untilnr Xs are evaluated.It should be noted that the variableXwill be ranked with errors,i.e.,Xtj,is thetthjudgement order statistic from thetthset of size n in thehthcycle of sizer.This is referred to as imperfect ranked set sampling(IRSS).Suppose that(X,Y)has a bivariate normal distribution and that the regression ofXonYis linear.Then,in the manner of Stokes[39],we can write
whereYandεare independent, andεhas a mean of zero and a variance, whereγis the correlation betweenXandYandμX,μY,σX,σYare the means and standard deviations of the variablesXandY.LetYtj(h)andXtj(h)represent thetthsmallestYvalue and the correspondingXvalue obtained from thetthset in thehthcycle,respectively.The above equation can be written as
For thehthcycle,the unbiased estimator of the mean of the variable of interestXwith ranking based on the concomitant variableY,i.e.,using the IRSS method,can be written as
Then variance of(see Stokes[39])is given by
whererepresents the variance of the tth order statistic from a sample of size n from the standard normal distribution.
Different authors,like,Kim et al.[40],Abid et al.[8],and Abbas et al.[36]used the RSS-based Wilcoxon signed-rank statistic to monitor shifts in the process location,defined as follows:
whereθ0is known as the IC median of the process.The mean and variance ofSRRSStstatistic arerespectively.The quantityϖ02is used to improve the efficiency of the control chart and can be defined asThe values ofFk(0)can be obtained by solving the following mathematical expression:
One may consult[22]for further detail on the RSS approach.
The plotting statistic of the NPREWMA-SR control chart is defined as:
The initial value of the plotting statisticis equal to zero.The mean and variance of this statistic are, respectively, defined as
.For a large value oft, the variance ofE(SRRSS)treduces toThe control limits for the NPREWMA-SR chart are given as follows:
The process is considered to be IC whenE(SRRSS)t <UCLNPREWMA-SRorE(SRRSS)t >LCLNPREWMA-SR;otherwise,it goes OOC.
2.5 HWMA Control Chart
Abbas[29]designed the HWMA control chart to monitor the process location,which is defined by the plotting statistic,given as follows:
whereis the mean of sample average oft-1 samples.The mean of the HWMA statistic isE(Ht)=μ0,while its variance is defined by
The control limits of the HWMA control chart are defined as
The process is said to IC whenLCL(HWMA)t <Ht <UCL(HWMA)t;elsewhere,it is considered OOC.
2.6 Proposed NPHWMARSS Control Chart
This subsection explains the methodology and formulation procedure of the proposed RSS-based NP HWMA control chart for process location shifts.The proposed control chart is labeled as the NPHWMARSScontrol chart.The plotting statistic of the proposed NPHWMARSScontrol chart is denoted byNPHtand defined as follows:
The starting value of the statisticNPHtis equal to the IC mean of the process,i.e.,NPH0=μ0.Theμ0should be specified value.The mean of the statisticNPHtisE(NPHt) =μ0,whereas its variance is given as
As a result,the control limits of the NPHWMARSSchart are given as follows:
To detect the shifts in the process location, the proposed NPHWMARSScontrol chart is constructed by plotting the statisticNPHtagainst the control limits defined by Eq.(13).IfNPHt >UCL(NPHWMARSS)torNPHt < LCL(NPHWMARSS)t, the process is considered OOC; otherwise, it is deemed IC.
3 Performance Evaluation
The IC and OOC performances of the proposed NPHWMARSScontrol chart for monitoring shifts in process location are presented in this section.Generally, we study the RL distribution and its associated features to assess the behavior of the control chart.The average run length(ARL)is the basic metric to evaluate control chart performance.It can be defined as the average number of sample points plotted on the control chart before the control chart shows an OOC signal[41].Mathematically it is defined asARL=∑,whereNis the size of simulation runs(see Almanjahie et al.[42]).For the IC process,the control chart should have large ARL0to avoid the false alarm,while for the OOC process the ARL1should be small for early shifts detection.For better performance of the control chart, it is necessary that the ARL1should be smaller than the other charts at a fixed value of ARL0.In this study, the ARL0is set on 500, with sample sizesnof 5 and 10.To investigate the performance behavior of the proposed NPHWMARSSchart, various values ofη∈(0.05, 0.10, 0.25,0.50)andδ∈(0,0.025,0.05,0.075,0.10,0.25,0.50,0.75,1.00,1.50,2.00,2.50,3.00,5.00)are used.Sometimes, the researcher may want to examine the chart’s performance across the entire range of shifts,i.e.,δmin <δ <δmax.In this case,a variety of performance measures,such as extra quadratic loss(EQL),performance comparison index(PCI),and relative average run length(RARL)can be used.Mathematically,these terms are defined as follows:
(ii)PCI=EQL/EQLbenchmark.The PCI value for the benchmark chart is 1,and the PCI value for all other charts is greater than 1.
Subsection 3.1 offers the IC performance of the proposed NPHWMARSScontrol chart,while the OOC performance of the proposed control chart is provided in Subsection 3.2.
3.1 IC Performance
This subsection addresses the design and implementation of the proposed NPHWMARSScontrol chart is given in Subsection 3.1.1.Similarly,Subsection 3.1.2 covers the IC robustness of the proposed NPHWMARSScontrol chart.
3.1.1 Design and Implementation
The design of the proposed NPHWMARSScontrol chart is based on the sample sizen,smoothing parameter,η, and control chart width L.The combinations ofnandηare used to determine the L value so that the ARL0is approximately equal to its desired value.Further, the extensive Monte Carlo simulations are used to implement the proposed NPHWMARSScontrol chart.An algorithm is developed in statistical software R to approximate the run length distribution.The RL characteristics are computed with the replicate of size 50,000.The simulation algorithm consists of the steps given as follows:
(i) Generate a random sample from the underlying distribution.
(ii) Specify the design parameters,i.e.,ηandL.
(iii) Draw a sample from any distribution used in this study.
(iv) Compute the plotting statisticNPHtin Eq.(12).
(v) FindLCL(NPHWMARSS)tandUCL(NPHWMARSS)tfrom Eq.(13).
(vi) PlotNPHtagainstLCL(NPHWMARSS)tandUCL(NPHWMARSS)talongt.
(vii) IfNPHt > UCL(NPHWMARSS)torNPHt < LCL(NPHWMARSS)t, then stop the simulation and calculate the sequence order RL.For instance, att= 235, ifNPHt >UCL(NPHWMARSS)torNPHt <LCL(NPHWMARSS)t,record 235 as a first RL.
(viii) Repeat Steps(ii)to(vii)50,000 times and calculate the ARL.Check whether it is desired ARL0;otherwise,adjust constants accordingly in step(ii)and repeat from(ii)to(viii)steps until the desired ARL0obtained.
(ix) To compute ARL1values,draw a shifted sample from the underlying distribution,and repeat Steps(ii)to(ix).
3.1.2 IC Robustness
This Subsection highlights the proposed NPHWMARSSchart’s IC robustness when shifts are reflected in the process location.The various distributions considered for this study,for instance,standard normal distribution,i.e.,N(0,1),double exponential or Laplace distribution,i.e.,heavy tail student’stdistribution,i.e.,t(υ),logistic distribution i.e.,contaminated normal(CN)distribution,which is the mixture ofN(0,σ02)andN(0,σ12)(see Table 1).USING NP CONTROL CHARTS,the IC RL distribution and related properties are identical for all continuous and symmetric distributions.Table 2 demonstrates the IC RL characteristics of the proposed NPHWMARSScontrol chart for monitoring location shifts.These characteristics are computed under normal and nonnormal continuous symmetric distributions.The distributions mentioned above are reparametrized to have zero mean/median and unit variance for performance comparison.The analysis indicates that for a specified value ofη,the IC RL remains the same for all considered distributions.
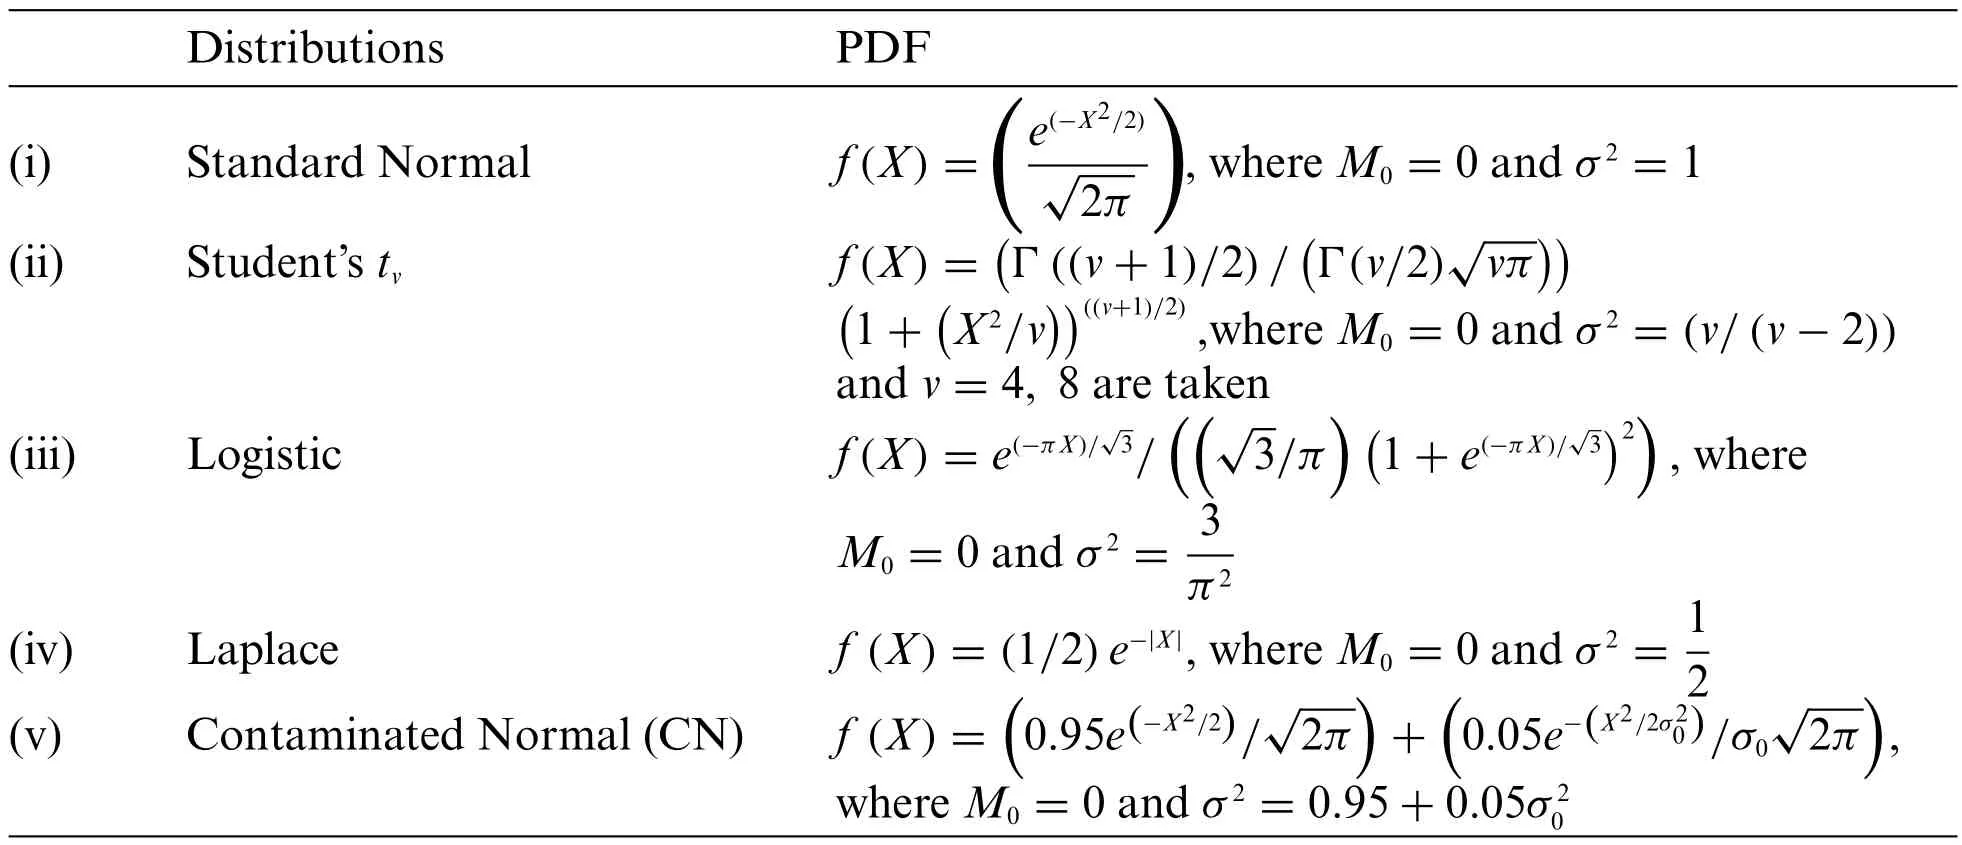
Table 1: PDFs of the continuous distributions used for this study
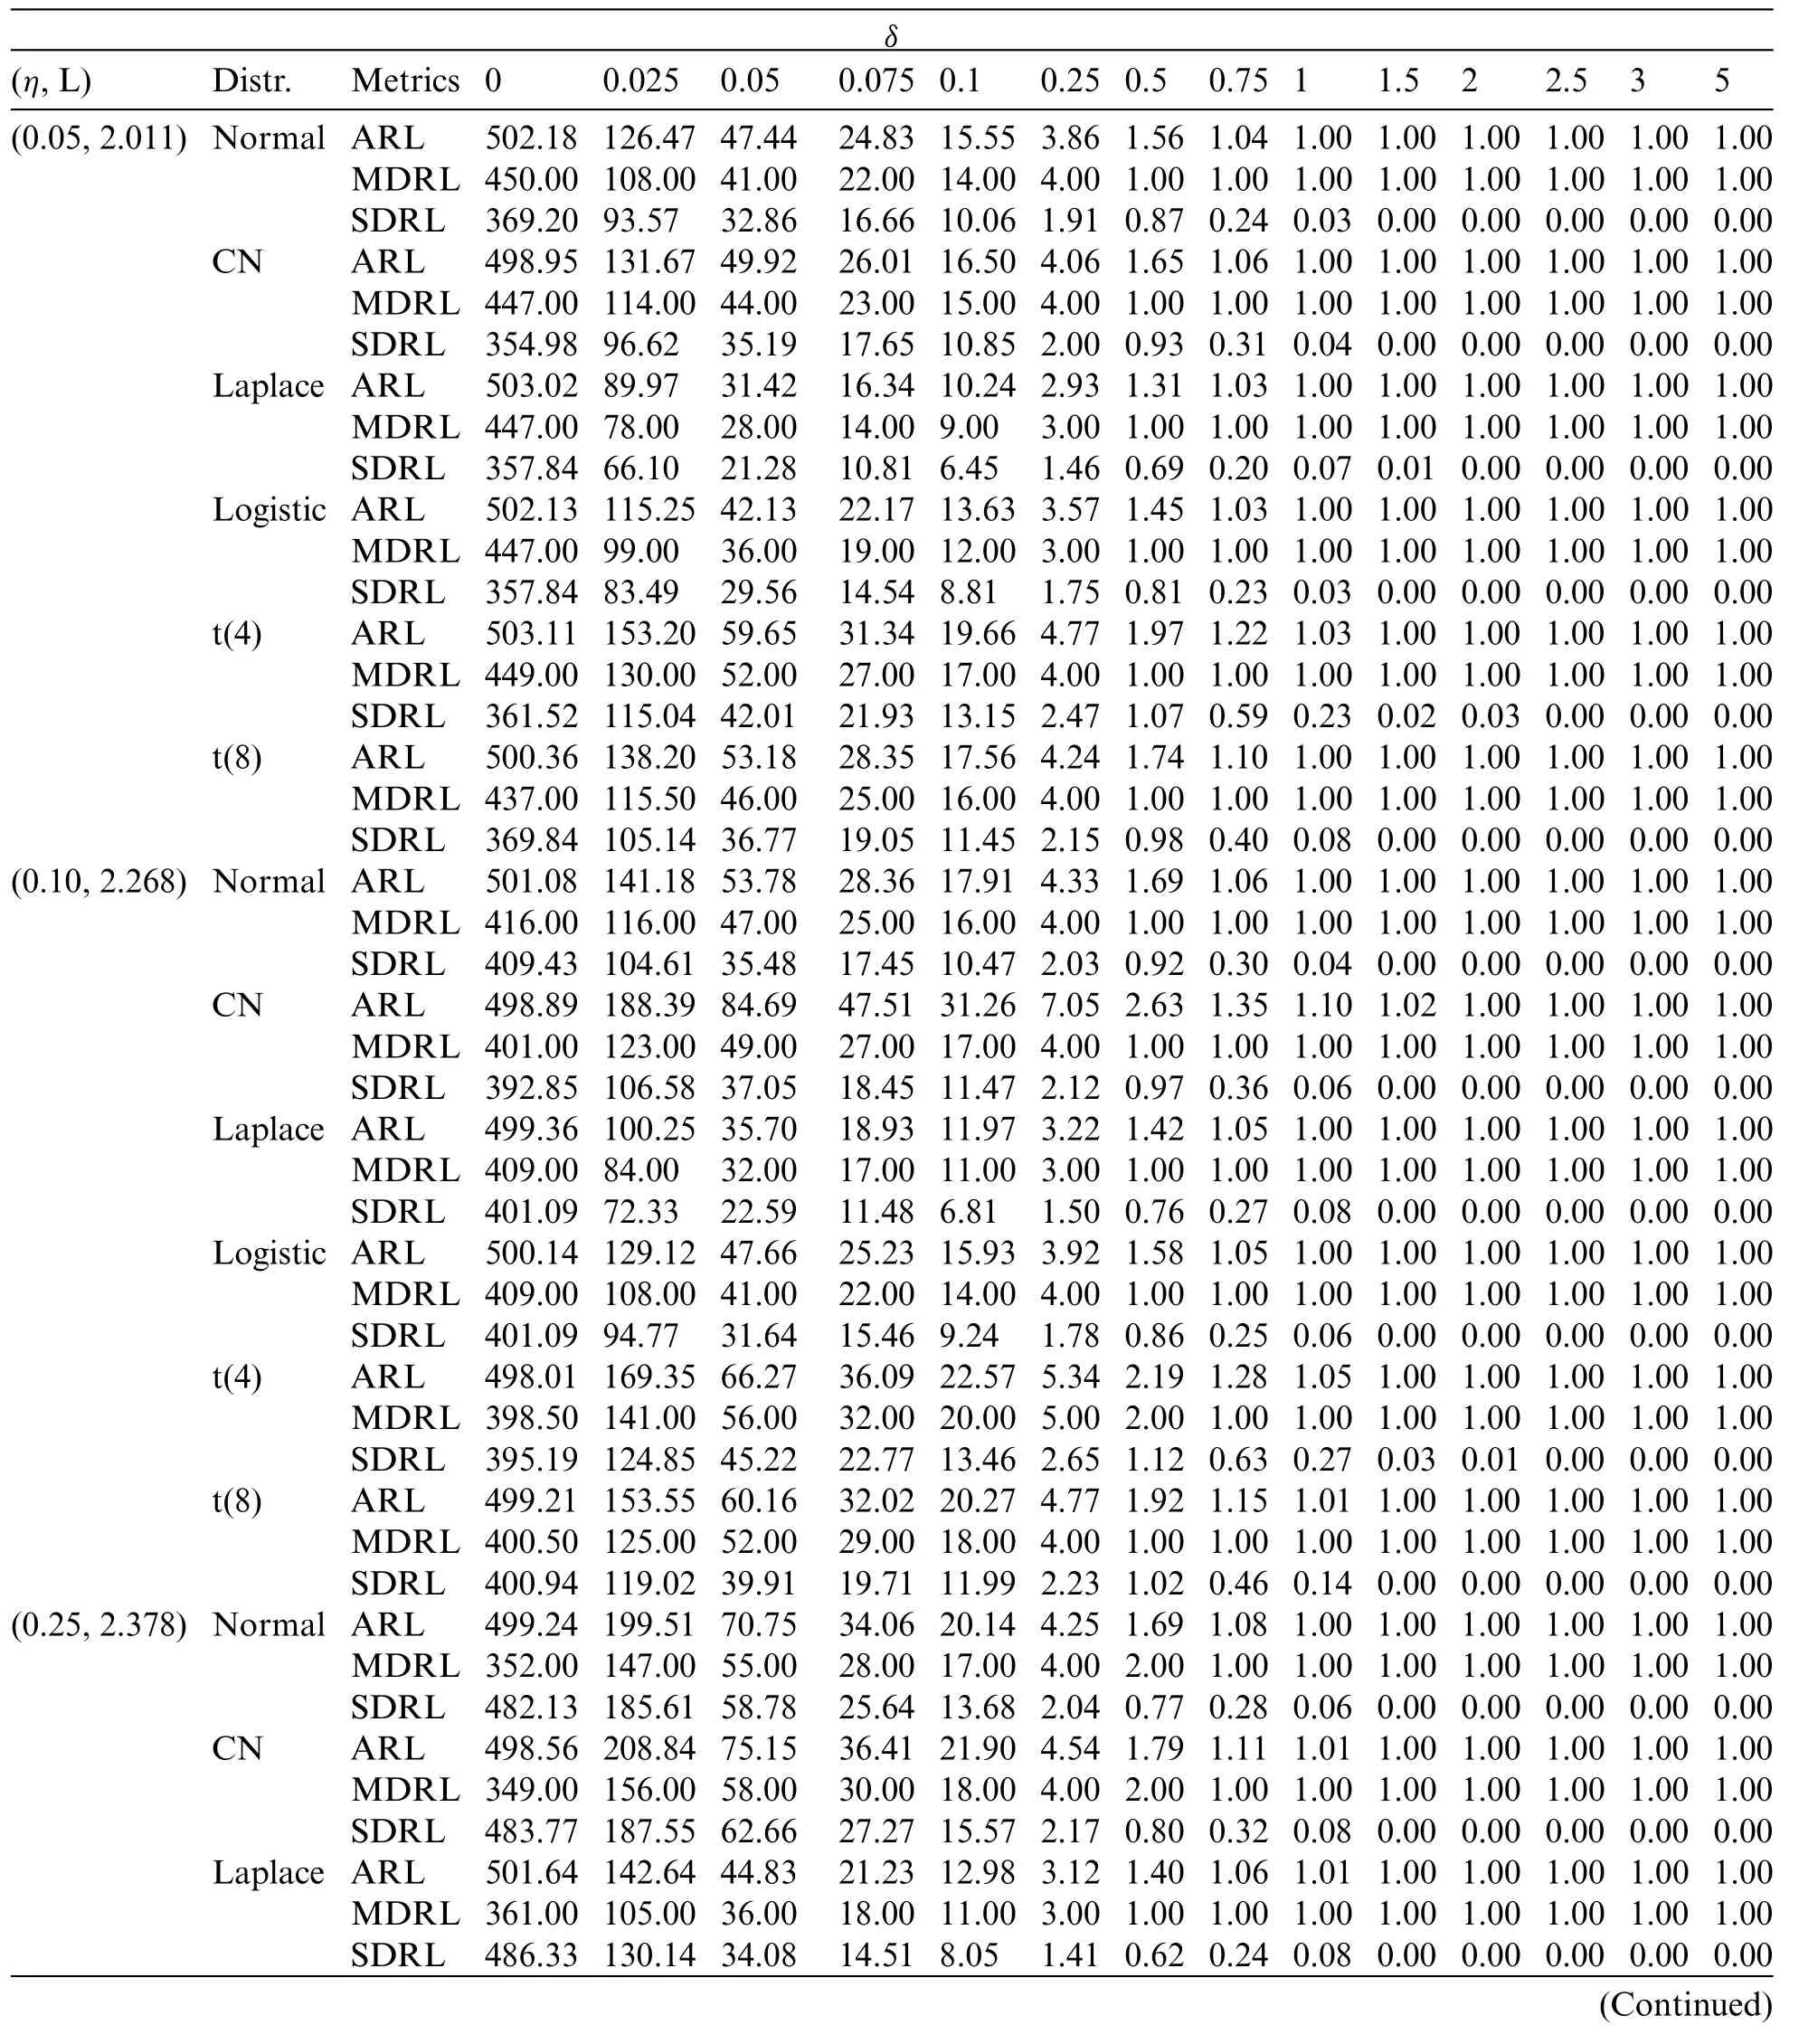
Table 2:RL characteristics of the proposed NPHWMARSS control chart under different distributions with nominal ARL0 =500 and n=10
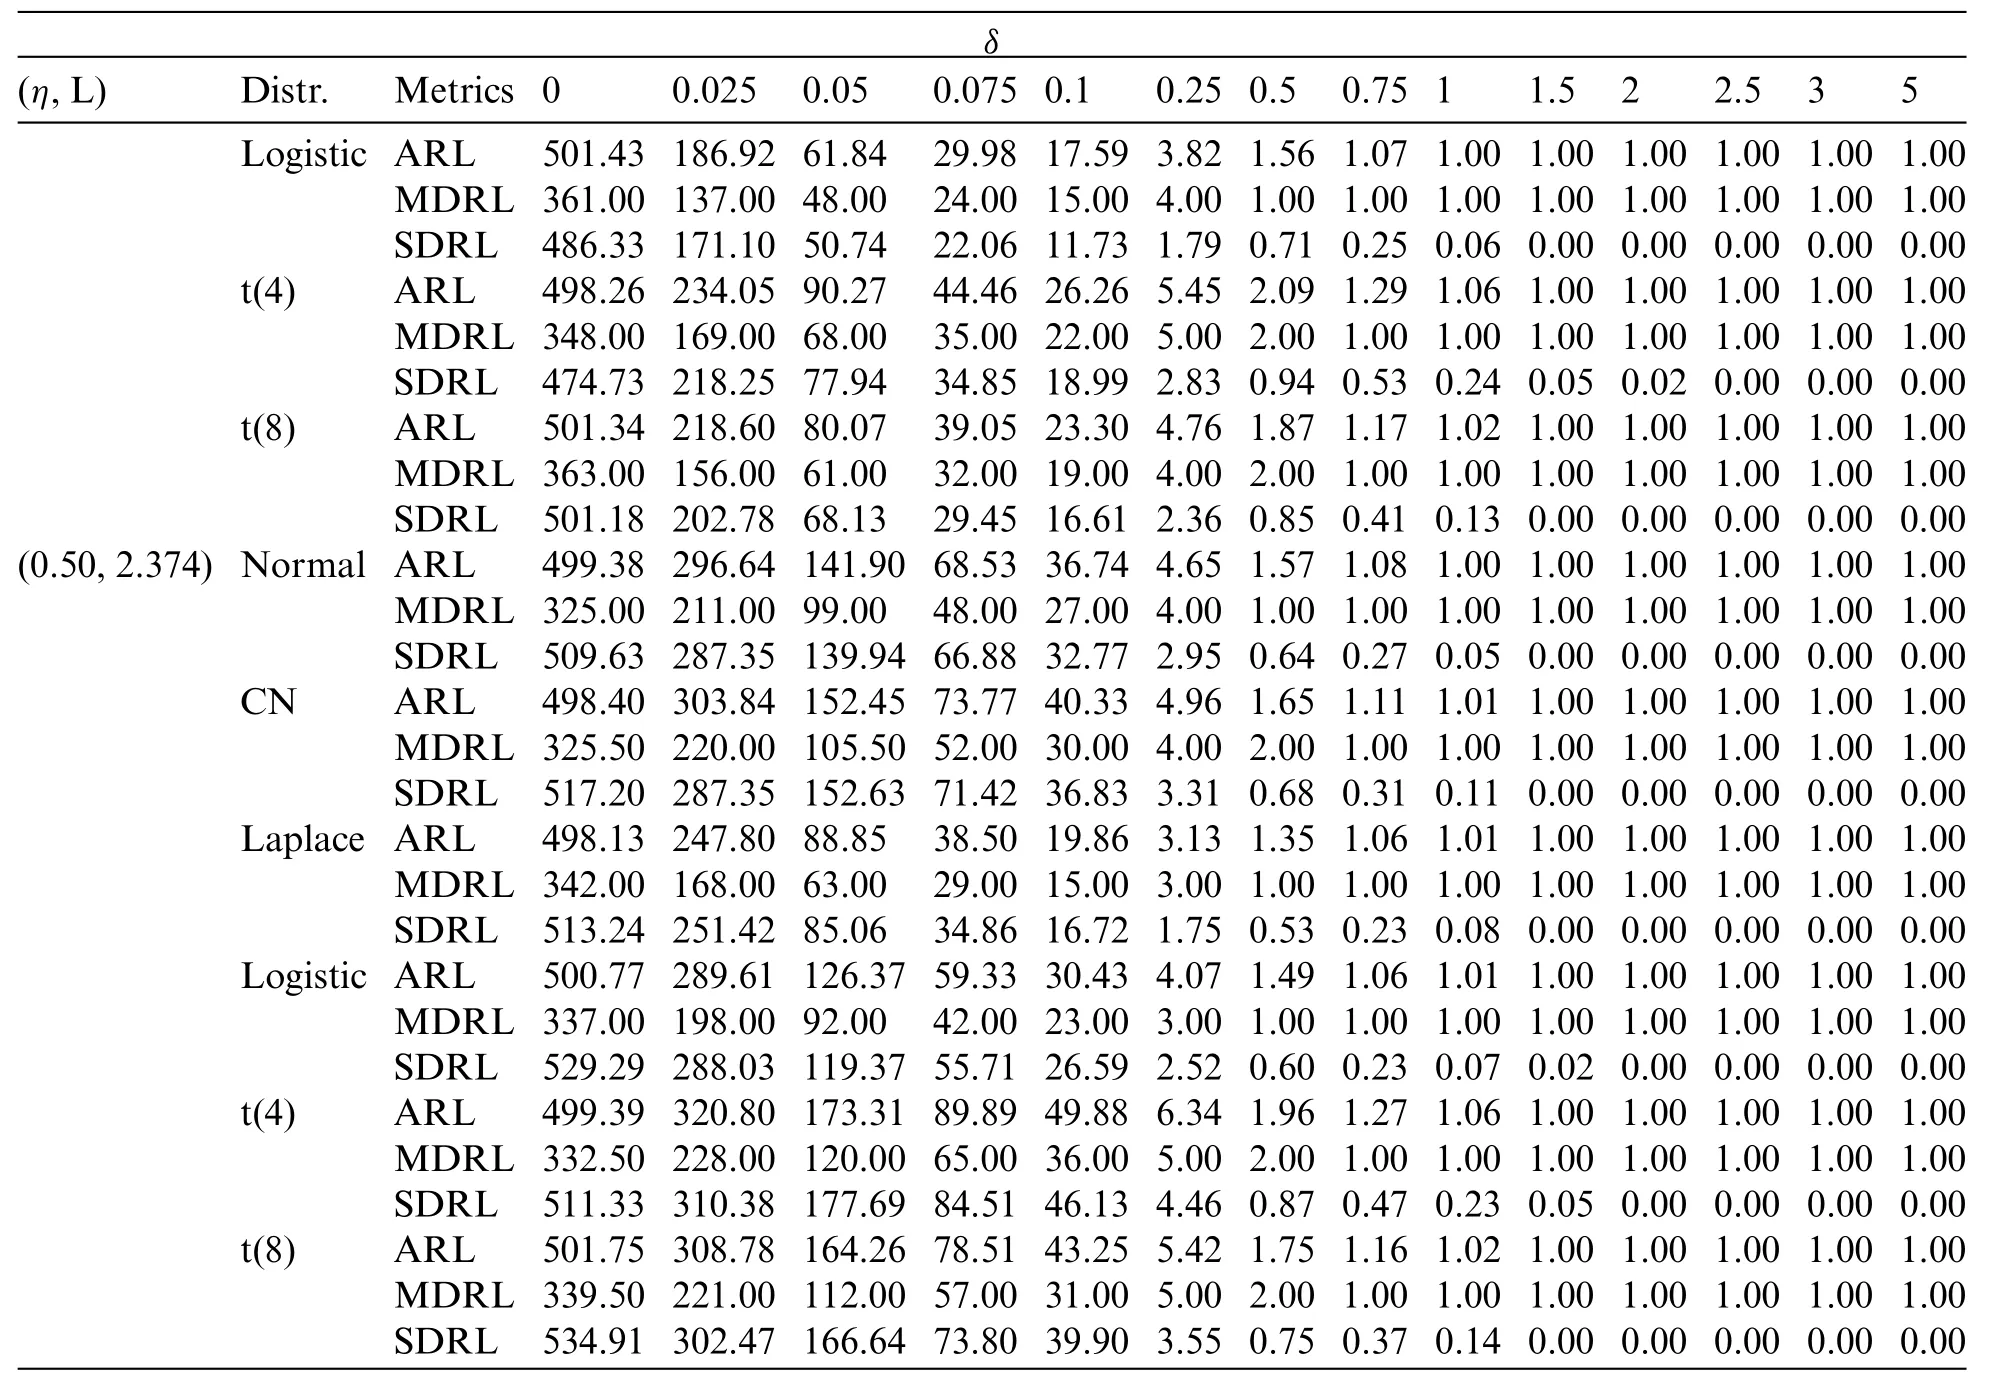
Table 2 (continued)
3.2 OOC Performance
The design parameters of the proposed control chart used to determine OOC efficiency are displayed in Table 2.In order to investigate the OOC performance of the proposed NPHWMA_RSS control chart,numerous values ofδ∈(0.025,0.05,0.075,0.10,0.25,0.50,0.75,1.00,1.50,2.00,2.50,3.00, 5.00) are practiced.The ARL1measures are used to compare the OOC performance of the proposed and competing control charts.
Table 2,and Figs.1-3 provide the following outcomes:
(i) The proposed chart’s IC RL distribution looks similar to all distributions examined in this study(see Table 2).
(ii) As the smoothing parameter values increase,the performance of the proposed NPHWMARSScontrol chart deteriorates.(see Fig.1).
(iii) As the sample size increases,the shift detection ability of the proposed NPHWMARSSconrol chart enhances.(see Fig.2).
(iv) The proposed NPHWMARSScontrol chart gains better performance under the Laplace distribution than the other distributions(see Fig.3).
(v) The proposed chart’s ARL1values increase asηincreases at a certain size of the shift.For instance,under normal distribution atη=0.25,n=10, andδ=0.025,the ARL1=199.51,whereas whenη=0.50,n=10, andδ=0.025,the ARL1=296.64(see Table 2).
(vi) The RL distribution of the proposed NPHWMARSScontrol chart is positively skewed, as ARL>MRDL(see Table 2).
(vii) The efficiency of the proposed control chart with perfect RSS outperforms the efficiency of the proposed control chart with imperfect RSS.For example, with perfect RSS under normal distribution atη= 0.10,n= 10, andδ= 0.025, 0.05, 0.075, 0.1, 0.25 the ARL measures are 141.18, 53.78, 28.36, 17.91, 4.33 whereas for imperfect RSS atη= 0.05,n= 10,γ= 0.30,δ= 0.025, 0.05, 0.075, 0.1, 0.25 the ARL measures are 286.98, 130.60, 75.72, 52.80, 12.71 (see Table 3).Similarly, with perfect RSS under t-distribution atη= 0.10,n= 10, andδ= 0.025, 0.05, 0.075 the ARL measures are 153.55, 60.16, 32.02 whereas for imperfect RSS atη=0.10,n=10,δ=0.025, 0.05, 0.075 andγ=0.30 the ARL measures are 311.25, 155.76, 88.89(see Table 4).
(viii) The ARL1values of the proposed NPHWMARSSchart are smaller than competing charts with different shift sizes in process location(see Fig.4).
Figure 1: ARL characteristics of the proposed NPHWMARSS control chart for different values of η when n=10 and ARL0 =500
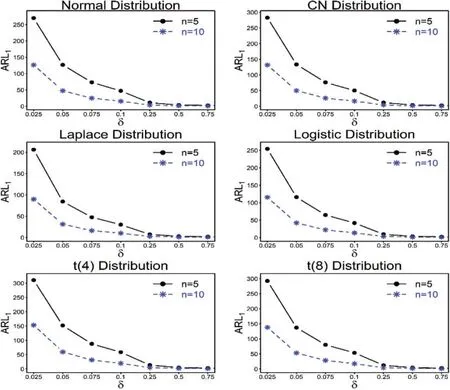
Figure 2: ARL characteristics of the proposed NPHWMARSS control chart when n = 5,10 and ARL0 =500
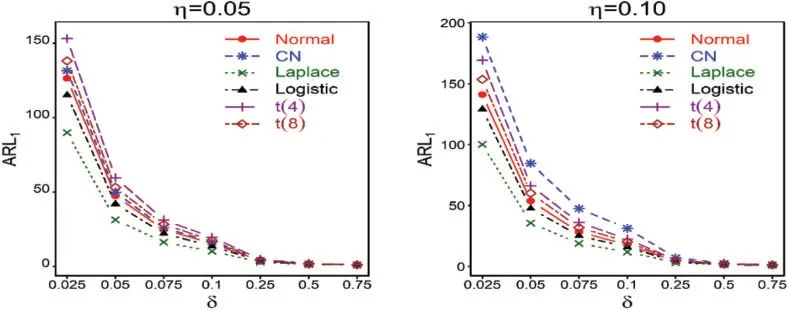
Figure 3: (Continued)
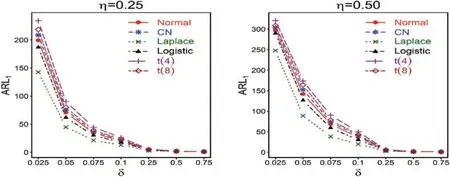
Figure 3:ARL characteristics of the proposed NPHWMARSS control chart under various distributions when n=10 and ARL0 =500
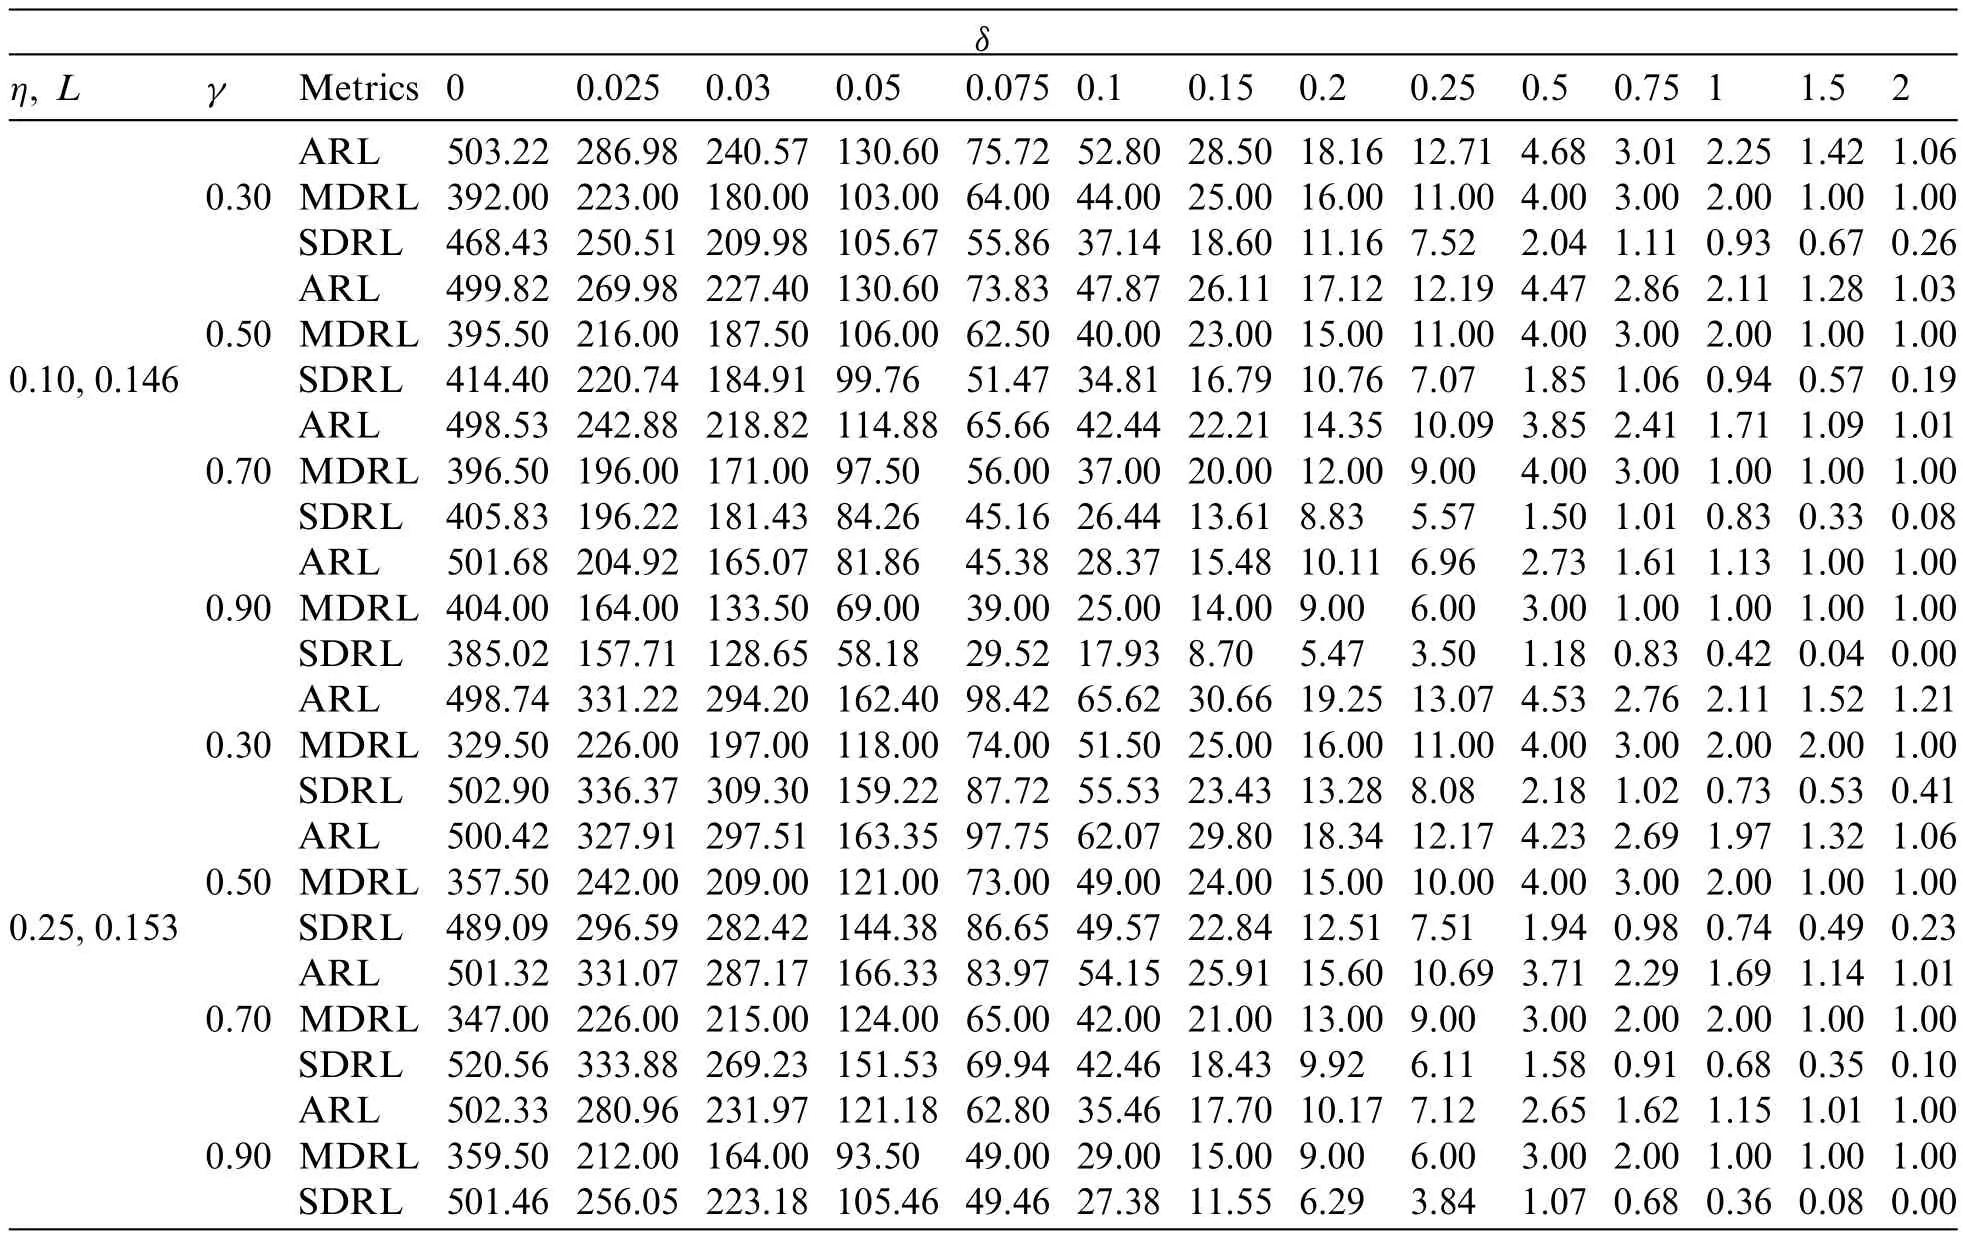
Table 3: RL characteristics of the proposed control chart with imperfect ranked set sampling under normal distribution at n=10 and ARL0 =500
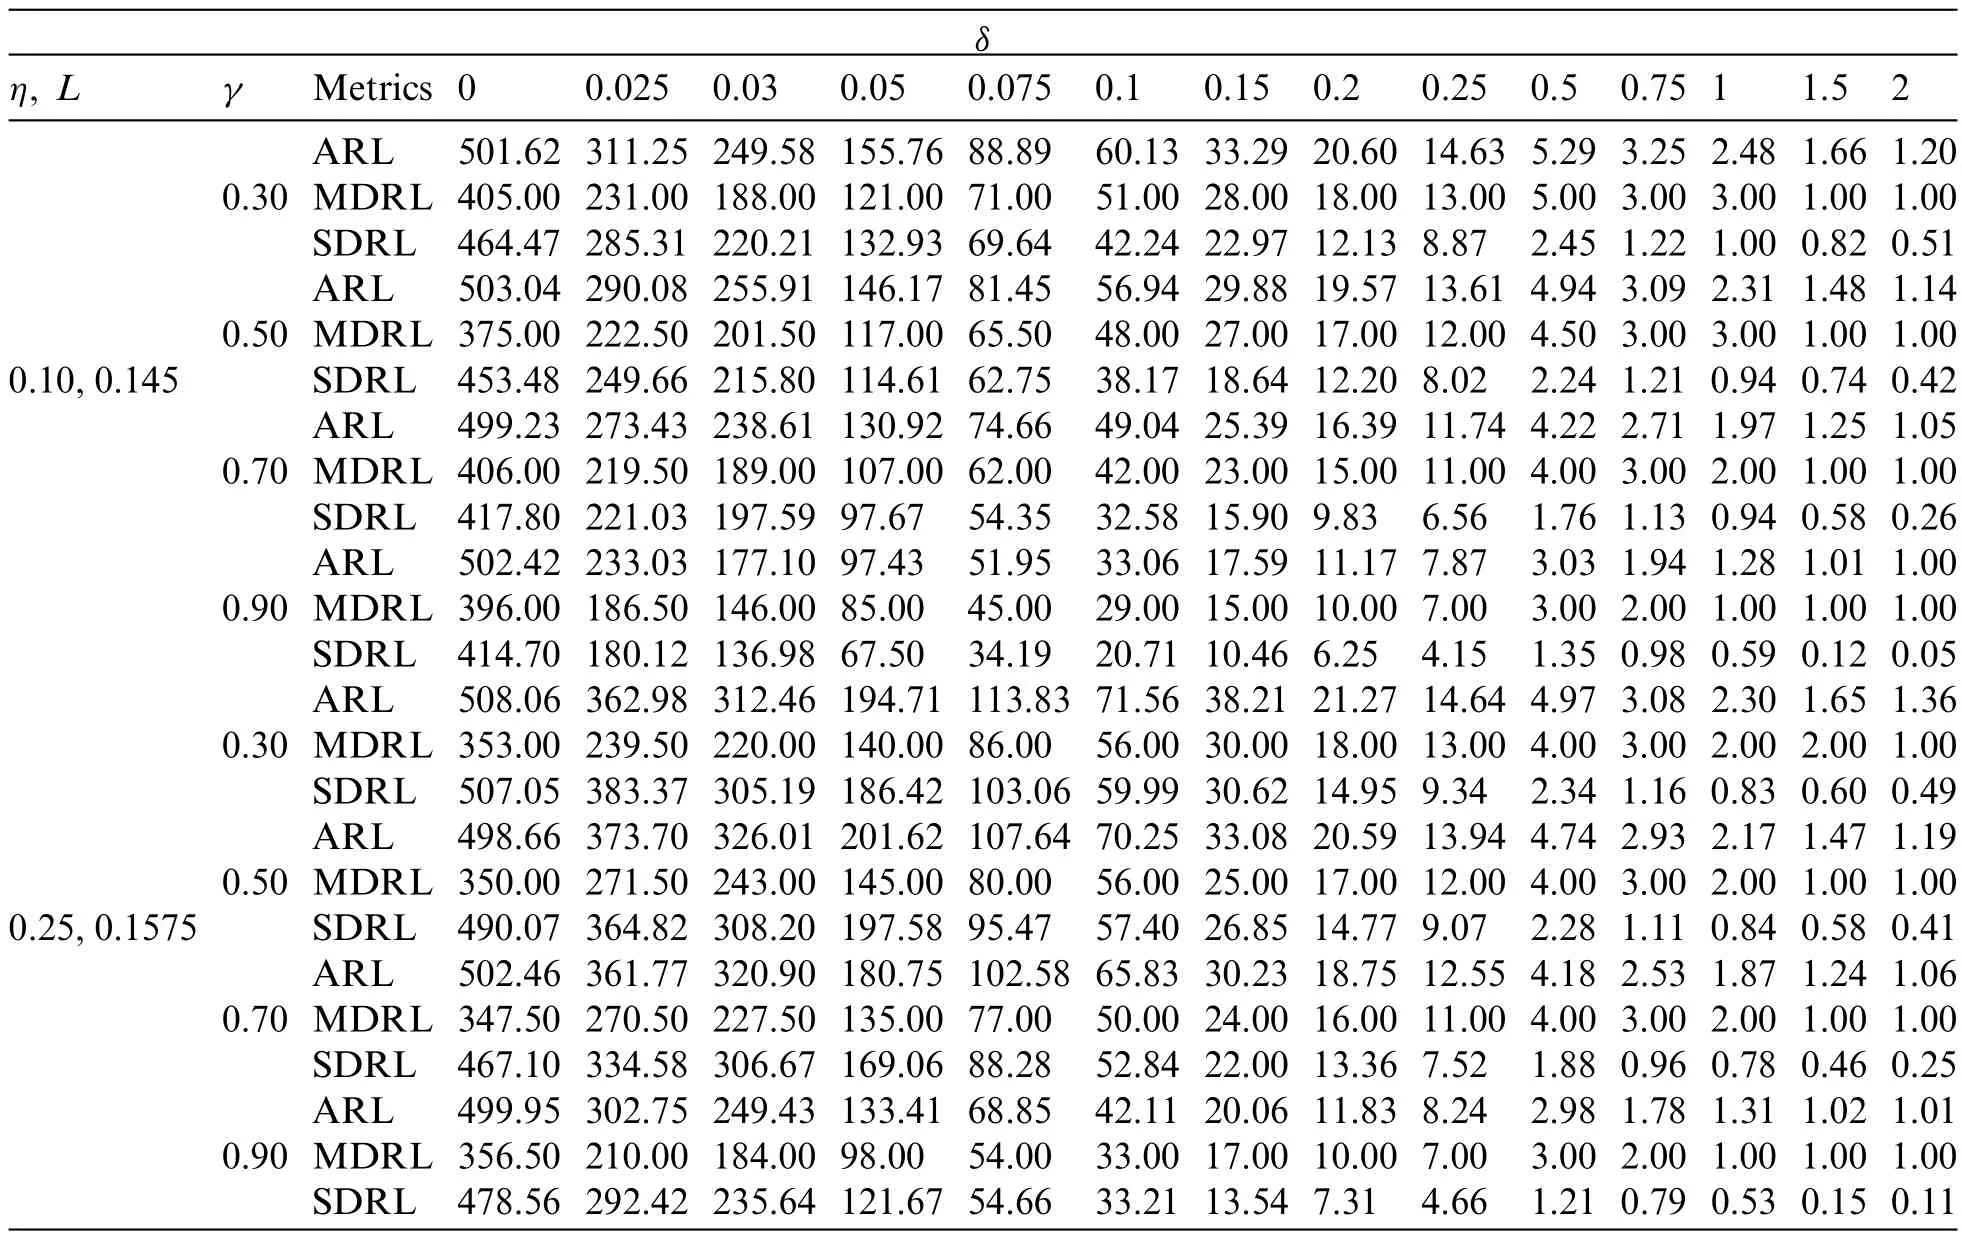
Table 4:RL characteristics of the proposed control chart with imperfect ranked set sampling under t distribution at n=10 and ARL0 =500
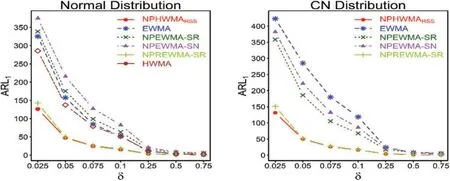
Figure 4: (Continued)
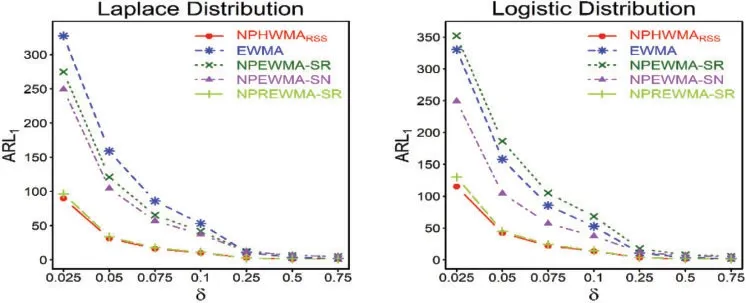
Figure 4:ARL meaures of the proposed NPHWMARSS and competing control charts under various distributions when n=10 and ARL0 =500
4 Comparative Study
This section compares the proposed chart against the competing charts, including EWMA,NPEWMA-SR,NPEWMA-SN,NPREWMA-SR,and HWMA control charts.The comparisons are given in the following subsection.
4.1 Proposed vs.EWMA Control Chart
The ARL1comparison for the proposed NPHWMARSScontrol chart against the EWMA control chart indicates that the proposed control chart outperforms the EWMA control chart.For example,under normal distribution,whenη=0.05,n=10 andδ=0.025,0.05,0.075,0.10,0.25,0.50,0.75,the ARL1values of the proposed NPHWMARSScontrol chart,i.e.,126.47,47.44,24.83,15.55,3.86,1.56,1.04,are smaller than the ARL1values of the EWMA control chart,i.e.,325.27,157.51,84.87,52.28,10.93,3.49,1.91(see Tables 2 and 5).Similarly,when we consider Laplace distribution for comparison,we observed the same behavior as the proposed NPHWMARSScontrol chart.
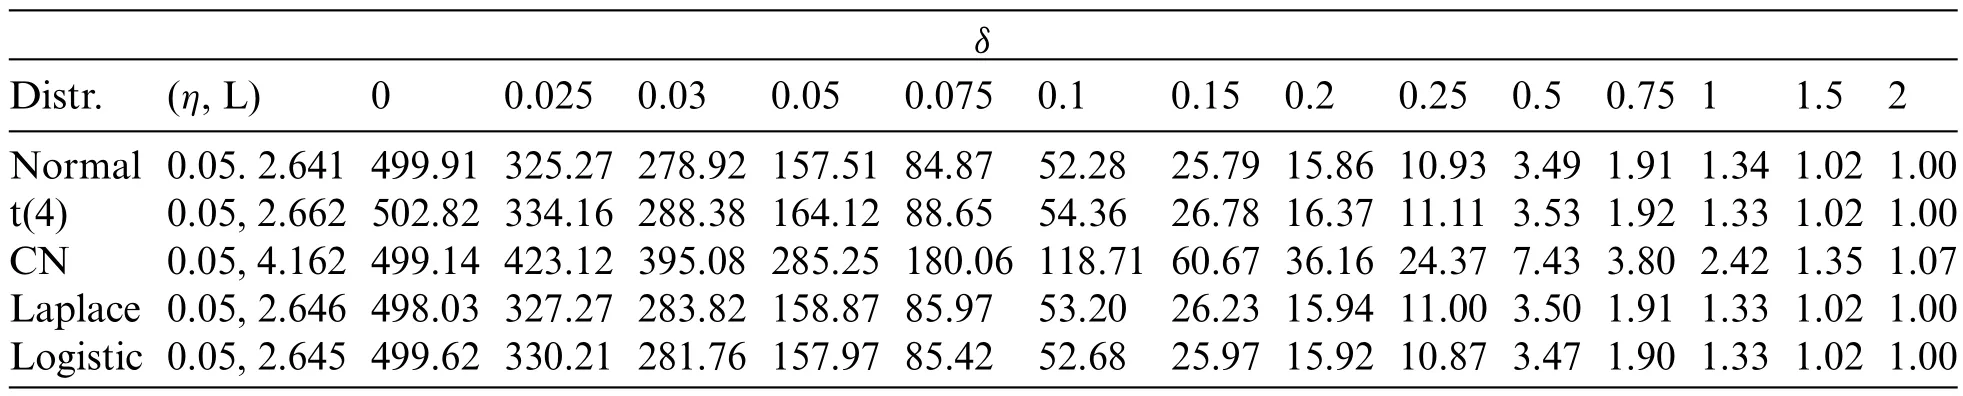
Table 5:ARL characteristic of the EWMA control chart under different distributions with nominal ARL0 =500 and n=10
For instance, with the same control chart properties, the proposed NPHWMARSScontrol chart provides the ARL1values of 89.97, 31.42, 16.34, 10.24, 2.93, 1.31, 1.03, while the EWMA control chart delivers the ARL1values of 327.27, 158.87, 85.97, 53.20, 11.00, 3.50, 1.91, respectively (see Tables 2 and 5).Fig.4 depicts the efficiency of the proposed control chart over the EWMA control chart.Likewise, the proposed NPHWMARSScontrol chart outperforms the EWMA control chart in terms of overall performance.As an illustration, in the case of normal distribution atη= 0.05 the EQL and RARL values of the proposed control chart are 1.41and1.00, while the EQL and RARL values of EWMA control chart are 1.67, 1.19 (see Table 6).These findings show that the proposed NPHWMARSScontrol chart performs better than the EWMA control chart in detecting process location shifts.
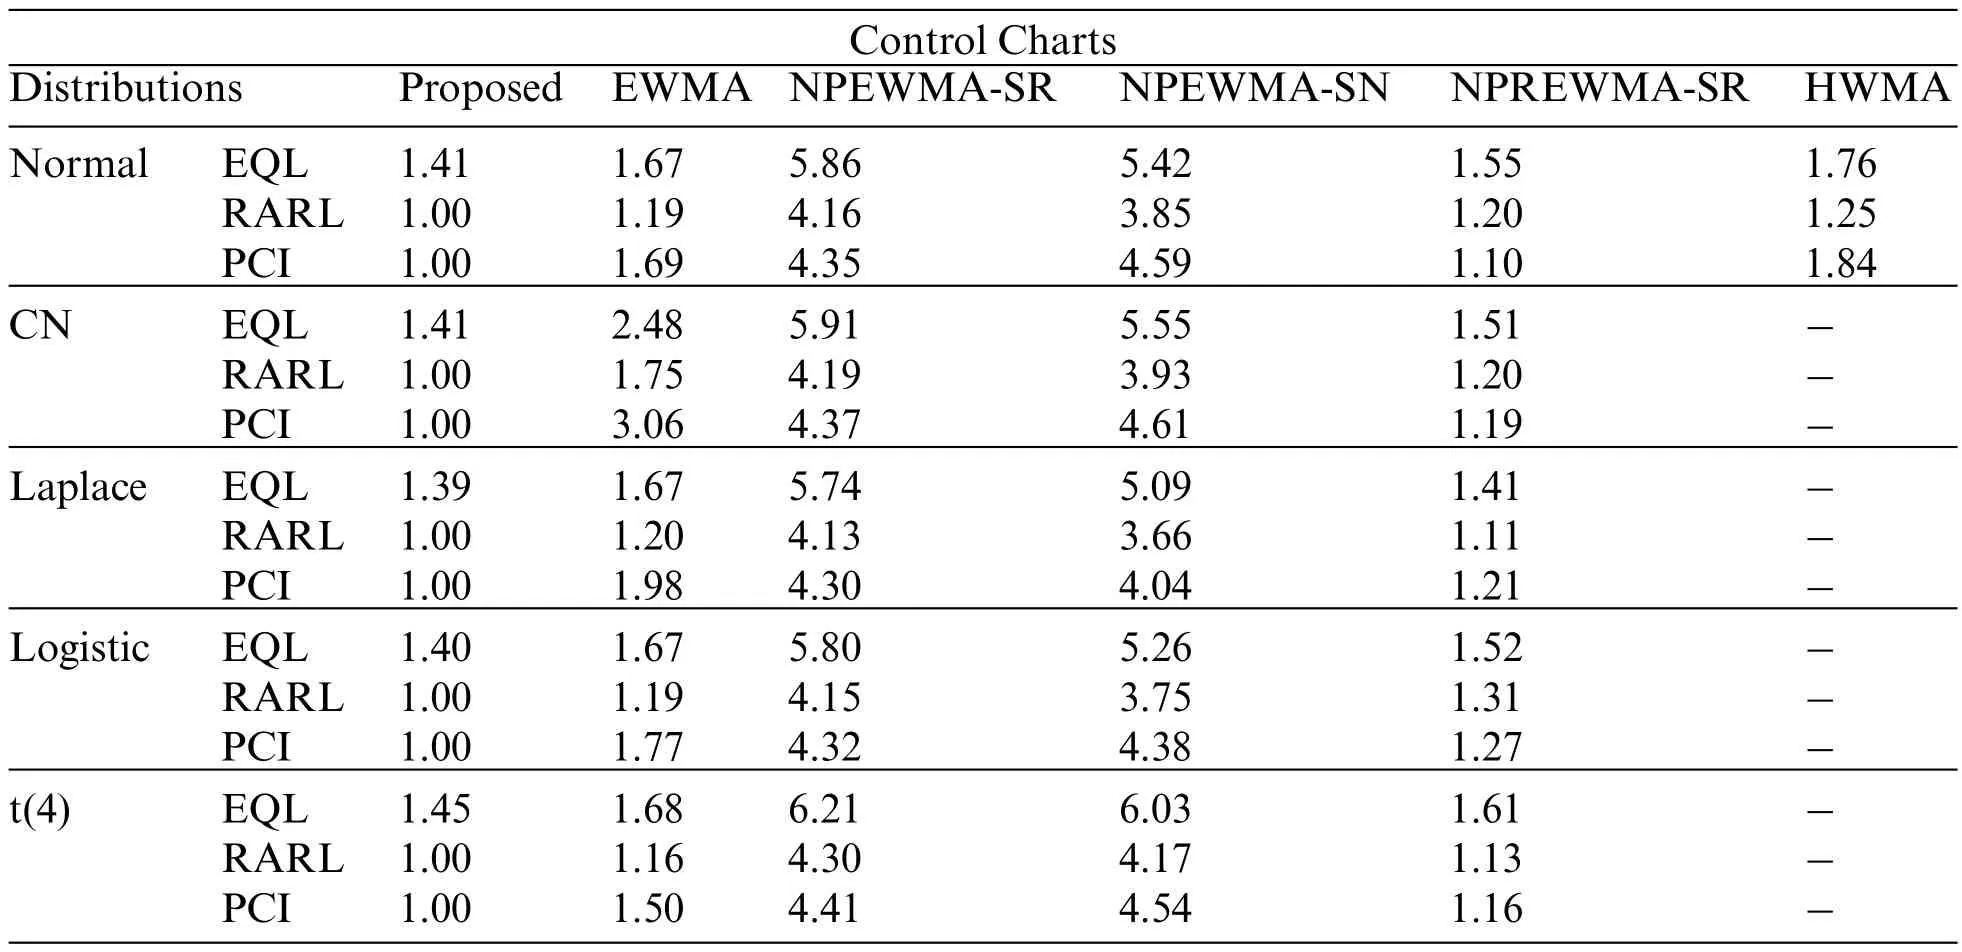
Table 6: Overall performance measures of the proposed and competing control charts
4.2 Proposed vs.NPEWMA-SR Control Chart
In comparison with the NPEWMA-SR control chart,the proposed NPHWMARSScontrol chart indicates superior performance for all combinations ofδandη.For instance, in case of logistic distribution,whenn= 10,η= 0.05,andδ=0.025,0.05,0.075,0.10,0.25,0.50,0.75,the proposed NPHWMARSScontrol chart yields ARL1values of 115.25,42.13,22.17,13.63,3.57,1.45,1.03,while the NPEWMA-SR control charts has the ARL1values of 322.05, 158.72, 89.31, 55.32, 15.24, 7.19,5.20,respectively(see Tables 2 and 7).
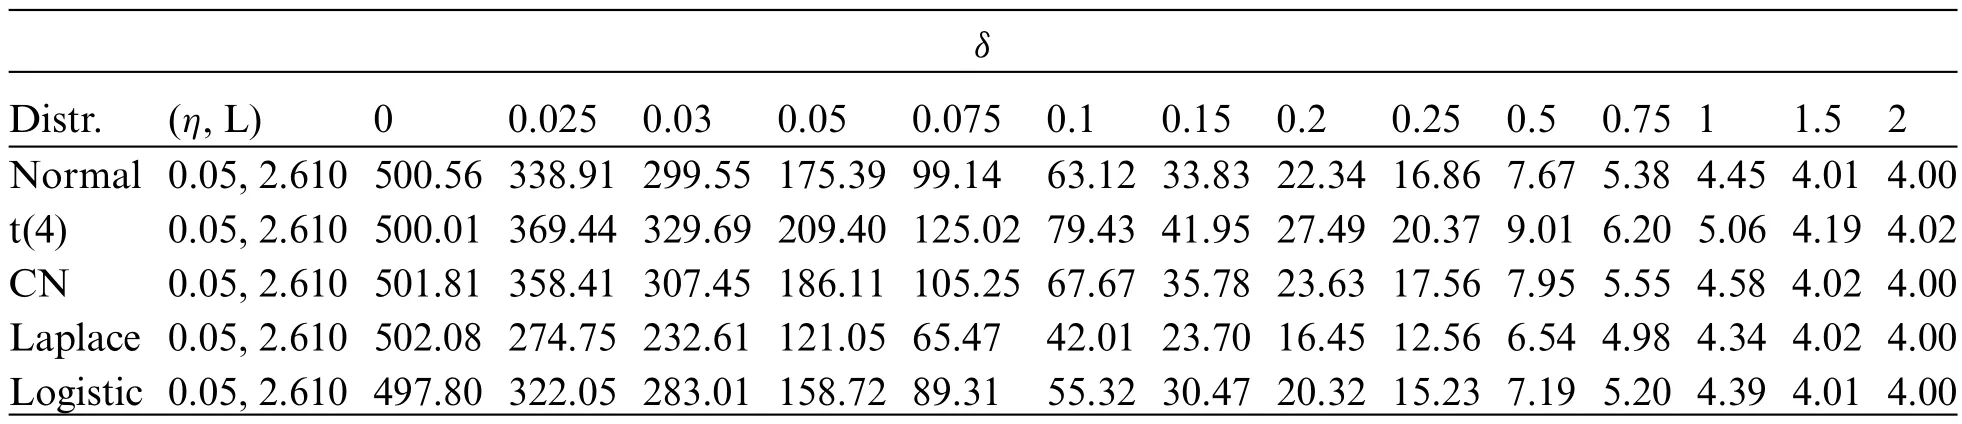
Table 7: ARL characteristic of the NPEWMA-SR control chart under different distributions with nominal ARL0 =500 and n=10
Similarly, when we examinet(4)distribution,withn= 10,η= 0.05 , andδ= 0.025, 0.10 0.25,the ARL1values of the proposed NPHWMARSSand the NPEWMA-SR control chart are 153.20,19.66,4.77,and 369.44,79.43,and 16.86,respectively(see Tables 2 and 7).Table 6 shows that the PCI performance outperforms the NPEWMA-SR control chart.For example,the proposed control chart has a PCI value of 1.00, whereas the NPEWMA-SR control chart has a PCI value of 4.37 under the CN distribution(see Table 6).The efficiency of the proposed NPHWMARSScontrol chart to the NPEWMA-SR control chart can also be observed in Fig.4.
4.3 Proposed vs.NPEWMA-SN Control Chart
The ARL1comparison reveals that the proposed NPHWMARSScontrol chart outperforms the NPEWMA-SN control chart for all choices ofηandδ(see Tables 2 and 8).In detail, for CN distribution,withη= 0.05,δ= 0.075, 0.10, 0.25,the ARL1values for the proposed NPHWMARSScontrol chart are 26.01, 16.50, 4.06, while for the NPEWMA-SN control chart these values are 132.56, 85.70, 21.61, respectively (see Tables 2 and 8).Similarly, under normal distribution, atη=5%, a 2.5% increase in process location parameter reduces the ARL by 24.76% for the NPEWMASN control chart,while the NPHWMARSSreduces ARL by 74.81%(see Tables 2 and 8).Also,Fig.4 also shows the superiority of the NPHWMARSScontrol chart over the NPEWMA-SN control chart.Table 6 shows that the proposed control chart outperforms the NPEWMA-SN control chart in EQL and PCI values under different distributions.
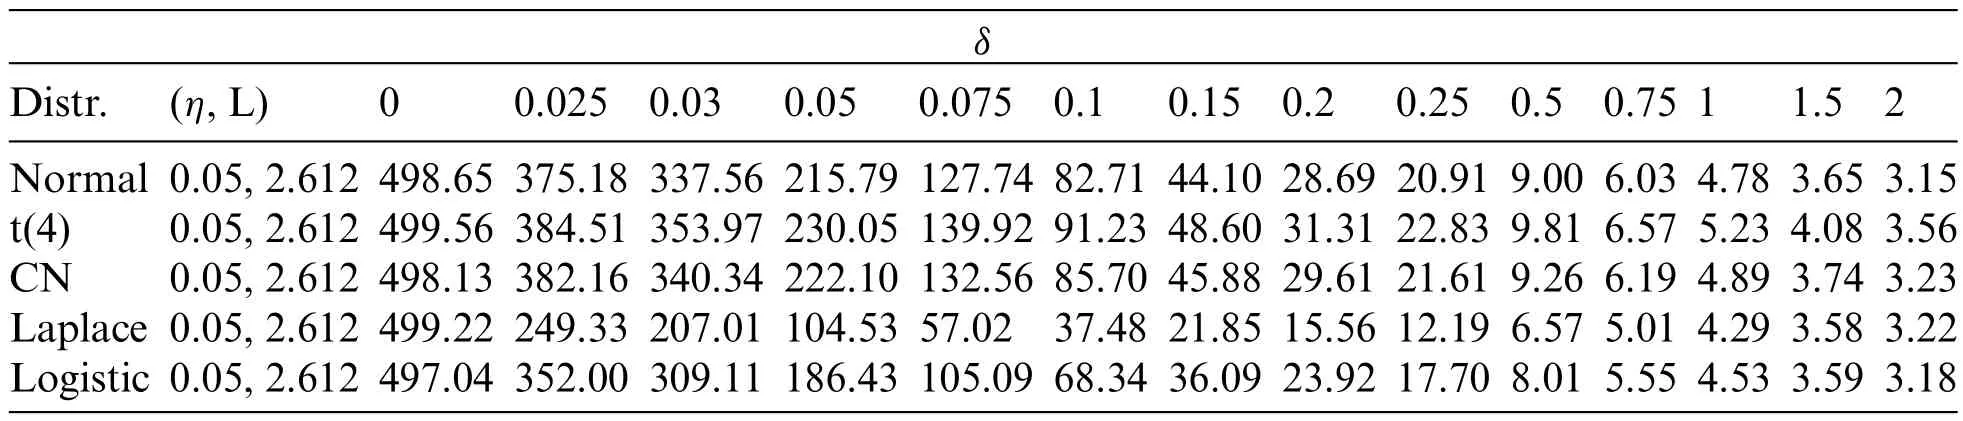
Table 8: ARL characteristic of the NPEWMA-SN control chart under different distributions with nominal ARL0 =500 and n=10
4.4 Proposed vs.NPREWMA-SR Control Chart
The proposed NPHWMARSScontrol chart performs better than the NPREWMA-SR control chart.For instance,atn=10,η=0.05,δ=0.025,the NPREWMA-SR control chart with Laplace distribution triggers the OOC signal after 94.56 observations, whereas the proposed NPHWMARSScontrol chart produces the OOC signal after 89.97 observations(see Tables 2 and 9).Similarly,in the case of CN distribution,whenn=10,η=0.50 andδ=0.025,0.05,0.25,0.50,then the ARL1values for the proposed NPHWMARSScontrol charts are 131.67,49.92,4.06,1.65,whereas the ARL1values for the NPREWMA-SR control charts are 149.06, 51.18, 4.67, and 1.89,respectively(see Tables 2 and 9 and Fig.4).Furthermore,undert(8)distribution,atn= 10,η= 0.05, andδ= 0.025, 0.05,the OOC ARL for the proposed NPHWMARSSand the NPREWMA-SR control chart are 138.20,53.18,and 152.17,54.38,respectively.It is also observed that the proposed control chart outperforms the NPREWMA-SR control chart in terms of overall performance.For example, under Logistic distribution, the RARL value of the proposed control chart is 1.00, while the RARL value of the NPREWMA-SR control chart is 1.31(see Table 6).
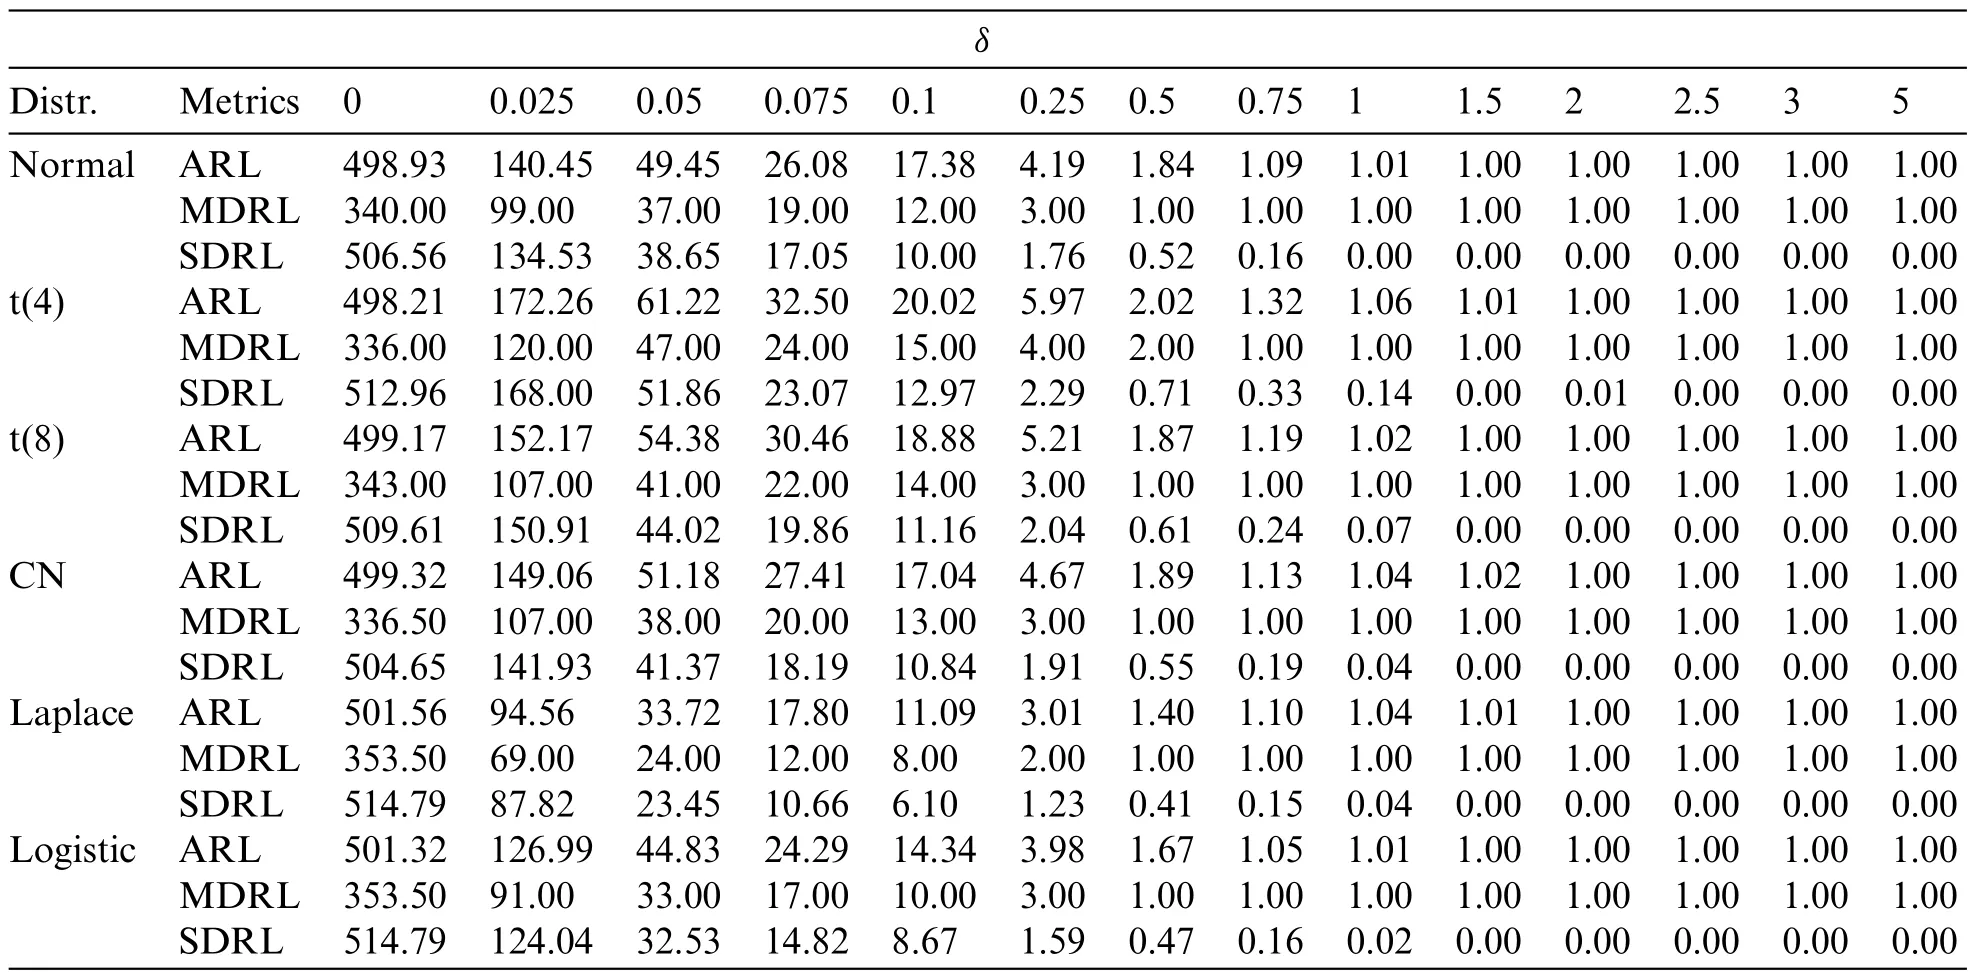
Table 9: RL characteristics of the NPREWMA-SR control chart under different distributions at η=0.05, L=2.01, n=10 and ARL0 =500
4.5 Proposed vs.HWMA Control Chart
The proposed NPHWMARSScontrol chart outperformed the HWMA control chart in terms of early shift detection in the process location.For example,investigating the normal distribution withn= 10,η= 0.10, andδ= 0.025, 0.05, 0.075, the ARL1values for the proposed NPHWMARSScontrol chart are observed as;141.18,53.78,28.36,whereas,the ARL1values for the HWMA control charts are reported as;307.44,152.37,87.46,respectively(see Tables 2 and 10).Similarly,under normal distribution,atn=10, andη=25%reduces the ARL by 124.65%in the HWMA control chart,with a 7.5% increase in the process location parameter, whereas the NPHWMARSScontrol chart reduces ARL by 34.06%(see Tables 2 and 10).The proposed control chart performs better than the HWMA control chart in terms of overall performance.For example,under normal distribution,the PCI value of the proposed control chart is 1.00,whereas the PCI value of the HWMA control chart is 1.84(see Table 6).In addition,Fig.3 illustrates that the proposed NPHWMARSScontrol chart outperforms the HWMA control chart.
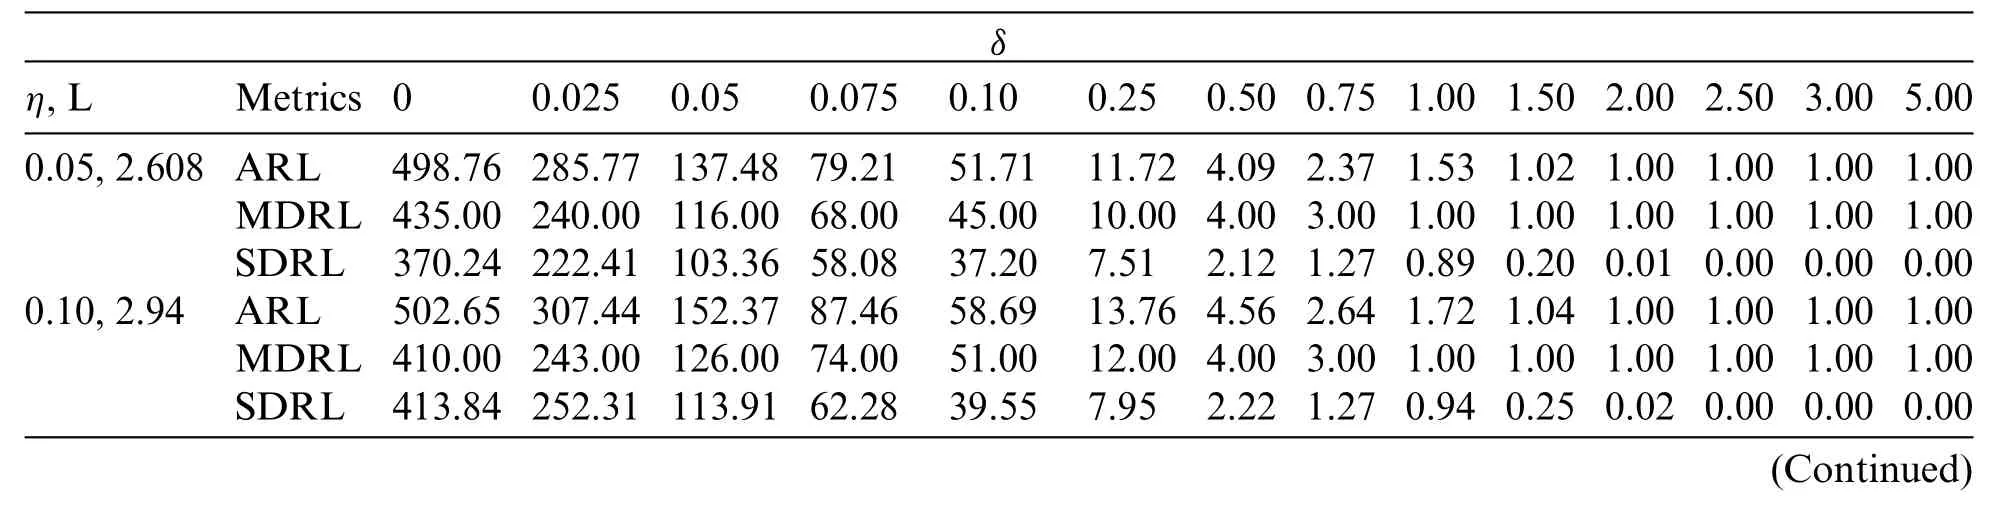
Table 10:RL characteristics of the HWMA control chart under normal distribution at n = 10 and ARL0 =500
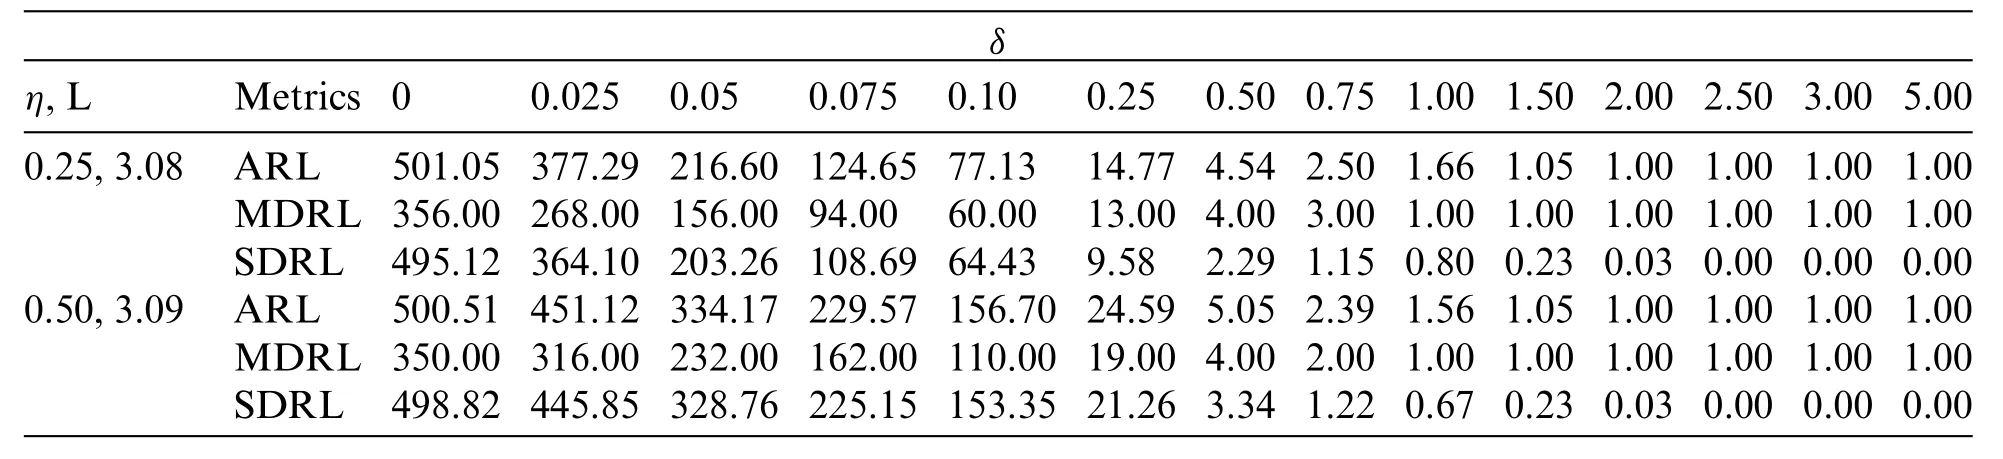
Table 10 (continued)
5 Illustrative Example Using Real Data
To demonstrate the applicability of the proposed NPHWMARSScontrol chart practically,a reallife example is provided in this section.The example used the real-life data of the non-isothermal continuous stirred tank reactor (CSTR) process.This real-life data are considered by numerous authors in their studies,for instance,Lucas et al.[43],Yoon et al.[44],Shi et al.[45],Ridwan et al.[46],and Adegoke et al.[47],etc.The CSTR process has nine variables,one of which we select as the variable of interest (X),representing the output temperature,and this variable is used in real-life application with parametersμX=369.88 andσ2X=0.32.The data initially consists of 1000 observations,with the first 500 occurring when the process was in an IC condition.The estimation is carried out with the help of the mentioned parameters,and the control limits are obtained.In order to use the proposed control chart and the existing(NPREWMA-SR)control chart in practise,the variable of interest(X),is used.We used the RSS approach to generate 40 paired observations of sizen= 5 andm= 1 from a normal distribution.After the 24thobservation, a shift in the process mean is introduced.The parameters of the proposed and NPREWMA-SR control charts used for real-life analysis areL= 2.011,η= 0.05, ARL0= 500 andL= 2.01,η= 0.05, ARL0= 500, respectively.Fig.5 indicates that the proposed NPHWMARSScontrol chart triggers the first OOC signal at sample number 27, while the NPREWMA-SR control chart detects the first OOC point at sample number 29.Similarly, the proposed NPHWMARSScontrol chart detects overall 14 OOC points, whereas the NPREWMA-SR control chart detects 12 OOC points(see Table 11 and Fig.5).
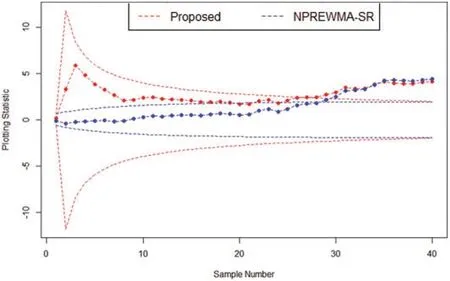
Figure 5:Real-life application of the proposed NPHWMARSS control charts against the NPREWMASR control charts
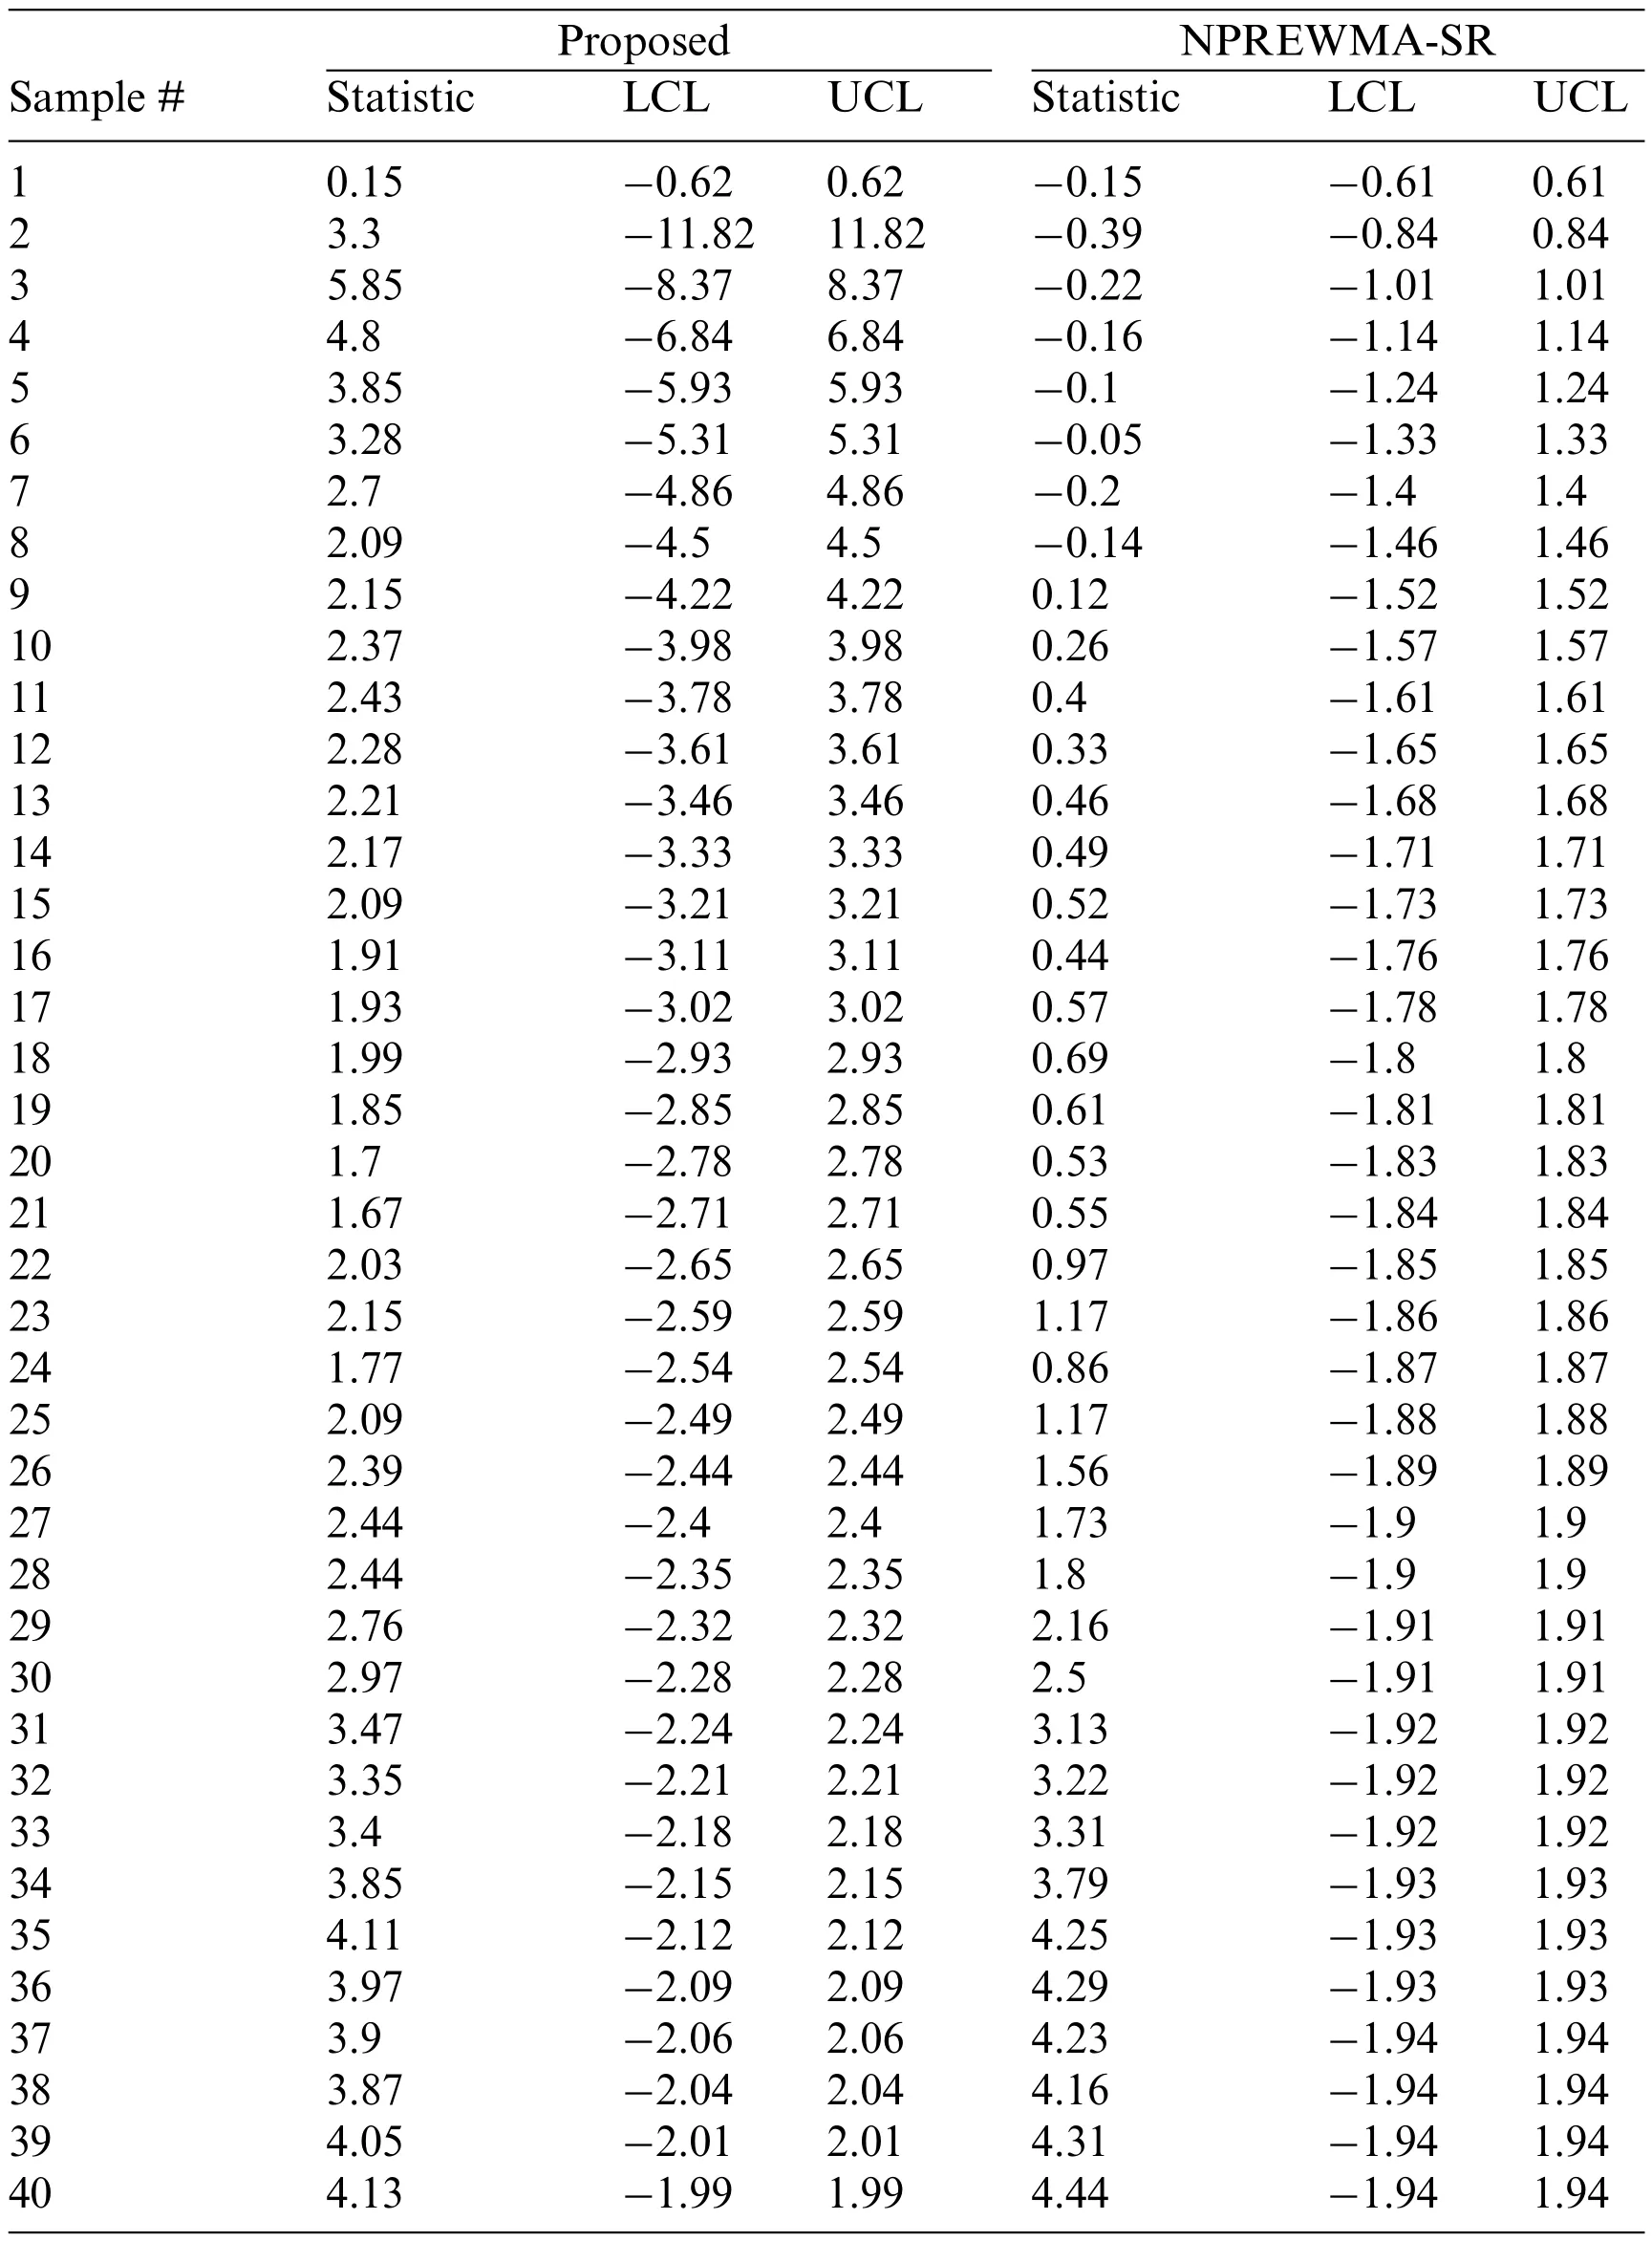
Table 11: Application of the proposed vs.NPREWMA-SR control chart
6 Summary,Conclusions,and Future Recommendations
The normality assumption for the process is essential for parametric control charts to monitor process parameters (location and/or dispersion) shifts.If the process under consideration does not follow a normal distribution, the nonparametric (NP) control charts are used.In addition, the homogeneously weighted moving average(HWMA)control chart is introduced for improved process location monitoring.Moreover,the ranked set sampling(RSS)technique outperforms simple random sampling (SRS).This study proposed the NP HWMA control chart with the RSS scheme, which results in an NP HWMA Wilcoxon signed-rank chart under the RSS technique (NPHWMARSS),which is used to improve the shifts detecting ability in the process location.The performance of the proposed chart is examined in terms of ARL, MDRL, and SDRL.The results revealed that the proposed control chart performs better than the competing charts like EWMA,NPEWMA-SR,NPEWMA-SN, NPREWMA-SR, and HWMA.Moreover, a real-life application is also offered to show the proposed control chart’s applicability in practice.The proposed study can be extended to the multivariate scenario.
Acknowledgement:The authors extended their appreciation to the Deanship of Scientific Research at King Khalid University for funding this work through Large Groups Project under the Grant No.RGP.2/132/43.The authors express their gratitude to the editor and referees for their valuable time and efforts on our manuscript.
Funding Statement:Funds are available under the Grant No.RGP.2/132/43 at King Khalid University,Kingdom of Saudi Arabia.
Conflicts of Interest:The authors declare that they have no conflicts of interest to report regarding the present study.
Appendix A
According to Kim et al.[40], for an in control processE(SR(RSS)t) = 0 andV(SR(RSS)t) =
A.1.
A.2.
SR(RSS)kandSR(RSS)jare the values from a random sample,so these values are independent of each other.Hence,
A.3.
SR(RSS)1,SR(RSS)2,...,SR(RSS)t-1denotes the first(t-1) samples and all these samples are independent of the next(i.e.,tth ight)sample,this implies that
Hence
Appendix B
B.1.
The mean ofNPHt,i.e.,E(NPHt)for an in control process is derived as
B.2.
The variance ofNPHti.e.,V(NPHt)for an in control process is derived as
 Computer Modeling In Engineering&Sciences2023年6期
- Computer Modeling In Engineering&Sciences的其它文章
- Finite Element Implementation of the Exponential Drucker-Prager Plasticity Model for Adhesive Joints
- A Review of Electromagnetic Energy Regenerative Suspension System&Key Technologies
- Arabic Optical Character Recognition:A Review
- Survey on Task Scheduling Optimization Strategy under Multi-Cloud Environment
- A Review of Device-Free Indoor Positioning for Home-Based Care of the Aged:Techniques and Technologies
- Topology Optimization for Harmonic Excitation Structures with Minimum Length Scale Control Using the Discrete Variable Method