
Quantification of Ride Comfort Using Musculoskeletal Mathematical Model Considering Vehicle Behavior
2023-02-27 10:41JunyaTanehashiSzuchiChangTakahiroHiroseiMasakiIzawaAmanGoyalAyumiTakahashiandKazuhitoMisaji
Junya Tanehashi,Szuchi Chang,Takahiro Hirosei,Masaki Izawa,Aman Goyal,Ayumi Takahashi and Kazuhito Misaji,*
1Graduate Student,Graduate School of Industrial Technology,Nihon University,Chiba,275-8575,Japan
2Hitachi Astemo,Ltd.,Tochigi,321-3325,Japan
3Former Graduate Student,Graduate School of Industrial Technology,Nihon University,Chiba,275-8575,Japan
4College of Industrial Technology,Nihon University,Chiba,275-8575,Japan
ABSTRACT This research aims to quantify driver ride comfort due to changes in damper characteristics between comfort mode and sport mode,considering the vehicle’s inertial behavior.The comfort of riding in an automobile has been evaluated in recent years on the basis of a subjective sensory evaluation given by the driver.However,reflecting driving sensations in design work to improve ride comfort is abstract in nature and difficult to express theoretically.Therefore,we evaluated the human body’s effects while driving scientifically by quantifying the driver’s behavior while operating the steering wheel and the behavior of the automobile while in motion using physical quantities.To this end,we collected driver and vehicle data using a motion capture system and vehicle CAN and IMU sensors.We also constructed a three-dimensional musculoskeletal mathematical model to simulate driver movements and calculate the power and amount of energy per unit of time used for driving the joints and muscles of the human body.Here, we used comfort mode and sport mode to compare damper characteristics in terms of hardness.In comfort mode, damper characteristics are soft and steering stability is mild, but vibration from the road is not easily transmitted to the driver making for a lighter load on the driver.In sport mode, on the other hand,damper characteristics are hard and steering stability is comparatively better.Still,vibration from the road is easily transmitted to the driver,which makes it easy for a load to be placed on the driver.As a result of this comparison,it was found that a load was most likely to be applied to the driver’s neck.This result in relation to the neck joint can therefore be treated as an objective measure for quantifying ride comfort.
KEYWORDS Human engineering; biomechanics; driver’s sense of fatigue; double lane change; musculoskeletal mathematical model
1 Introduction
According to a recent survey,the requirements specified by automobile users,in descending order of priority, are “ease of driving,”“a comfortable ride,”“a sense of security,”“good fuel economy,”and“good style and design”[1,2].In other words,users want cars that provide a comfortable driving experience and superior performance.
Early research on driving comfort was majorly focused on correlating the dynamic vehicle characteristics, such as the vehicle’s roll, pitch, and yaw rate to the driver’s subjective evaluation in terms of roll feel,steer feel and ride comfort[3-8].Gradually,the shift has been towards measuring driver’s motion from macroscopic variables like posture,seat force,etc.,to biopotentials and electrophysiological variables[9].
There are many medical studies on the analysis of objects other than automobiles using mathematical models of musculoskeletal systems[10-12].
Particularly,muscle activity and joint loads have been of interest to better understand the driver’s subjective feelings.A viable approach to non-invasively determine these is to utilize musculoskeletal model.Many such studies exist in the literature.For example,steering effort feel was correlated with the driver’s upper body muscular loads determined using a three-dimensional upper limb musculoskeletal model[13];the driver arm model was analyzed using surface electromyography signals to develop new steering technologies[14].From the ergonomics viewpoint,optimal placement of the assistive handle on the window was investigated using musculoskeletal modelling of egress[15]perception of fatigue by the driver was analyzed using muscular loads to design high-comfort car seats[16].
Most of the musculoskeletal analyses of a driver are performed using a driving simulator.Driving simulators are helpful in performing controlled experiments with greater accuracy compared to realvehicle tests, but they lack in replicating the essence of actual driving, which highly influences the feeling perceived by the driver.
Therefore, in this study, we created a three-dimensional musculoskeletal mathematical model(MMM) by measuring the driver’s behavior using a motion capture system and measuring vehicle behavior using Controller Area Network (CAN) and Inertial Measurement Unit (IMU) sensors during the real-vehicle test.We also propose a method that could incorporate in the model,data on translational motion with three degrees of freedom (x, y, z) that cut across planes linearly arranged along each axis and data on rotational motion with three degrees of freedom about the x,y,and z axes.
To our knowledge, no prior studies have utilized real vehicle tests to perform musculoskeletal analysis to quantify the ride comfort of the driver[17].
The study focused on Driving-Power, indicating the essential performance of each joint and muscle,and Angular Momentum is considered to be able to quantitatively evaluate the muscle loading degree on the time axis through the entire driving operation.Using the results of that analysis, we quantified the burden on the driver’s body in a running vehicle and compared the differences in roll feel for different vehicle damper settings.We observed that differences exist between an analysis that includes both the vehicle’s inertial behavior and the driver’s posture and an analysis that provides for only driver’s posture.
2 Experimental Method
This section describes the measurement method used in this study for obtaining motion data and the target of analysis.This method uses a motion capture system to capture the driving movements of a driver(subject)according to differences in the damper characteristics of the vehicle.The obtained data is used to calculate the physical quantities such as torque,power,and energy in each targeted joint and muscle for the purpose of making quantitative comparisons.In this experiment,a highly skilled test driver was measured three times in this way as a subject.Table 1 lists the physique information of the subject.
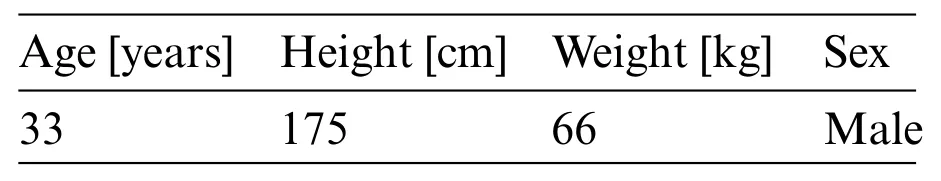
Table 1: Subject’s physique information
This section is organized as follows.Section 2.1 describes the measurement of three-dimensional position coordinates.Section 2.2 describes the measurements for estimating the degree of muscle activity.Section 2.3 describes damper characteristics,which are targeted for comparison in this study.Section 2.4 describes driving movements during a double lane change.Finally, Section 2.5 describes the method used to measure a the vehicle’s behavior.
2.1 Measurement of Three-Dimensional Position Coordinates
Six motion capture cameras were installed inside the test vehicle.In addition,32 reflective markers and 6 electromyographs were attached to the upper half of the subject’s body.To begin with,static data was measured and a rigid-body-link model appropriate for the physique of the subject was created.
Next,motion data was measured by recording data while the subject was driving the vehicle.In addition to the motion capture cameras,a gyro sensor and steering force meter were installed inside the vehicle to measure vehicle behavior and steering reaction force.Figs.1 and 2 show measurement setup and camera positions,respectively.
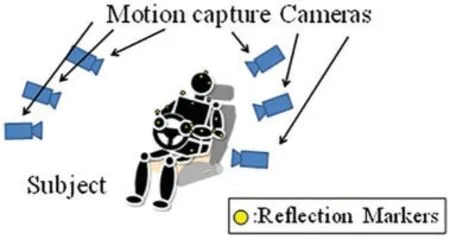
Figure 1:Outline of measurement set up
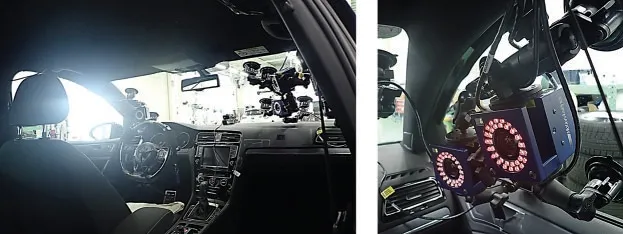
Figure 2:Motion capture installation
2.2 Measurements for Estimating Degree of Muscle Activity
Six electromyographs (MQ-Air: Kissei Comtec Co., Ltd., Nagano, Japan) were attached to the surface of certain muscles, namely, the left and right sternocleidomastoid muscles, deltoid muscles(clavicular portion),and long palmar muscles,which are considered to contribute significantly to drive the vehicle,and their myoelectric potential was measured.Based on the action of each muscle[18],the myoelectric potential was measured at the time of maximum isometric force and the value obtained was used to normalize the myoelectric potential measured while the subject was driving the vehicle[19,20].Figs.3 and 4 show the positions of the electromyographs and reflective markers,respectively,attached to the subject.Fig.5 shows the inside of the vehicle during the test.
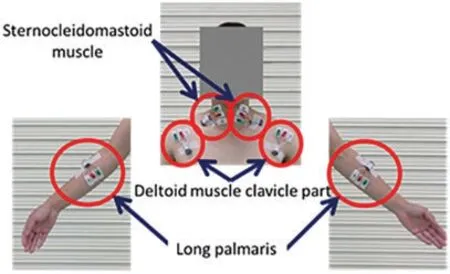
Figure 3:Attachment of an electromyograph to a subject
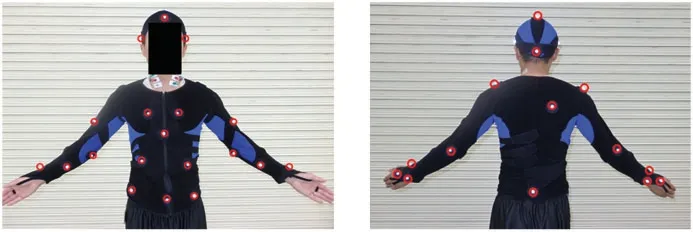
Figure 4:Position of reflection markers and EMG
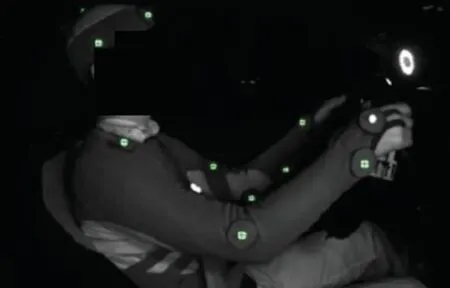
Figure 5:Inside of the cabin during measurement
2.3 Damper Characteristics
It is known that the vertical vibration of a vehicle caused by the input disturbance from the road(change in vehicle stability)is affected by the change in the magnitude of the damping force.A large damping force suppresses sprung mass resonance but increases vibration transmission in the frequency region between the sprung mass resonance and unsprung mass resonance(i.e.,transmission region).Conversely, a small damping force, while having a small damping effect on sprung mass resonance,decreases vibration in the transmission region.Consequently,a driver desiring the feel of a comfortable ride would prefer to set a variable damper to a small damping force(i.e.,comfort mode),while a driver desiring a nimble feel in driving would prefer to set a variable damper to a large damping force(i.e.,sport mode).The same practice can be observed regarding roll behavior when steering.Fig.6 shows the front and rear damper characteristics used in this study.
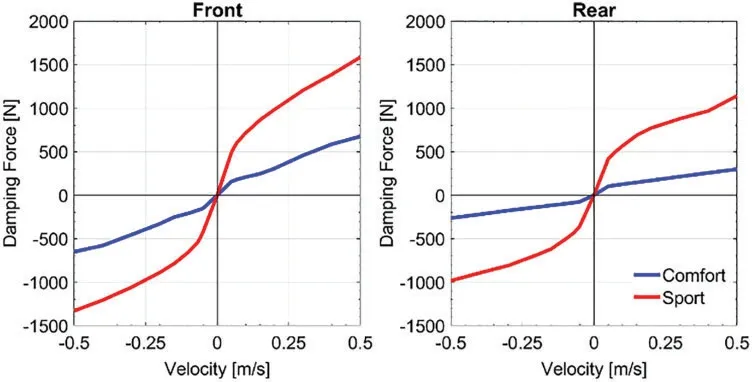
Figure 6:Damper characteristics of sport and comfort mode
2.4 Test Plan
The test vehicle was made to perform a double lane change test as shown in Fig.7 in each driving mode three times each.Using a variable damper system,we compared the results between the damper characteristics described in Section 2.3.A double lane change test emulates driving behavior when having to quickly avoid an animal or obstacle while driving.This type of test can therefore be considered to involve sudden driving actions,which are thought to generate a higher load on the human body than driving straight ahead or turning.
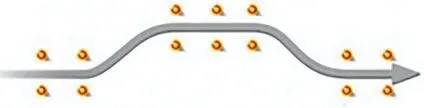
Figure 7:Double lane change test
2.5 Method of Measuring Vehicle Behavior
We adopted IMU sensors (TAG300N: Tamagawa Seiki Co., Ltd., Nagano, Japan) to quantify vehicle behavior by physical quantities during the double lane change test described in Section 2.4.An IMU sensor installed in an automobile is a device that can detect translational motion and rotational motion about the three orthogonal axes.It is equipped with acceleration sensors and gyro sensors enabling high-accuracy measurements of acceleration (translational motion) and angular velocity(rotational movement).We considered that using these values in combination with loads on the human body(driving torque,driving power,and angular momentum acting on individual joints and muscles)obtained by the motion capture system described in Sections 2.1 and 2.2 would enable us to evaluate ride comfort considering vehicle behavior.
3 Overview of Constructing a Musculoskeletal Mathematical Model
In this section, we show that a musculoskeletal mathematical model can be constructed by combining the joint model and muscle model used in this study with the three-dimensional position coordinate data captured using the motion capture cameras described in Section 2.Then, based on this musculoskeletal mathematical model and vehicle behavior data,we calculate driving torque about each joint and driving torque about each muscle in each joint using inverse kinematics calculations and inverse dynamics calculations.We calculated the driving power,which represents rotation in each joint and muscle,and angular momentum,which is the intensity of movement throughout an entire movement in each muscle.Table 2 shows the symbols used to represent physical quantities being used in this study.
Table 2: The physical quantities used in this study
This section is organized as follows.Section 3.1 describes a rigid-body-link model.Section 3.2 describes the musculoskeletal mathematical model.Section 3.3 describes inverse kinematics calculations.Section 3.4 describes inverse dynamics calculations.Finally,Section 3.5 describes calculations of driving power around each joint and driving power of muscles around each joint.Section 3.6 describes angular momentum of each muscle around the joint and Section 3.7 describes vehicle behavior.
3.1 Rigid-Body-Link Model
Infrared reflective markers were attached to the body of the subject and captured using motion capture cameras.This made it possible to obtain the three-dimensional coordinate data of each marker’s position.Then,by assigning a label to each set of three-dimensional coordinate data obtained in this way and defining links between points as a rigid body, we created a “rigid-body-link model”matching the body of the subject as shown in Fig.8.Through this rigid-body-link model, we were able to calculate the posture of each segment and the angle between each joint from the threedimensional coordinate data.For these calculations, we used an analysis software from Motion Analysis Corporation(California,USA)[10].
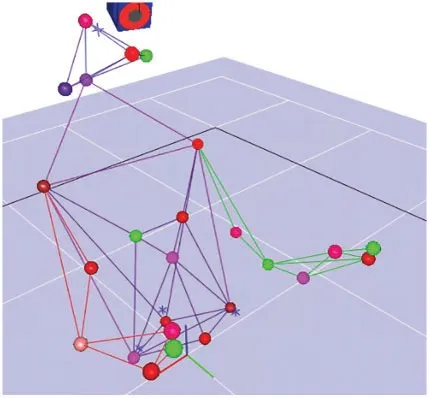
Figure 8:Rigid-body-link model
3.2 Musculoskeletal Mathematical Model
The musculoskeletal model as shown in Fig.9,represents a muscle-tendon complex consisting of muscle fibers and tendon tissues.A musculoskeletal mathematical model is created based on the rigidbody-link model of an individual subject and scaled in accordance with the physique of the subject.The musculoskeletal mathematical model is therefore a model of a muscle-tendon complex that integrates muscle fibers and tendon tissues.
Muscles in the muscle-tendon complex consist of “active contractile elements” (CE) generally called“agonist muscles”that actively exert force by muscle contraction and“parallel elastic elements”(PEE) generally called “antagonist muscles” that exert force as an elastic body that is passively elongated by muscle contraction.Tendons,meanwhile,are passively extended by muscle contraction and exert force as an elastic body.They are therefore called“serial elastic elements”(SEE).The musculoskeletal mathematical model proposed by Zajac[21]based on the Hill-type model[22](Fig.10)has been used in this study.The model proposed by F.E Zajac clearly represents the relationships between extension and tension,muscle length and tension,and muscle velocity and tension in a series of elastic elements that express the mechanical characteristics of muscles and tendons(Fig.11).To analyze these relationships,we used a motion analysis software(Motion Analysis Corporation).
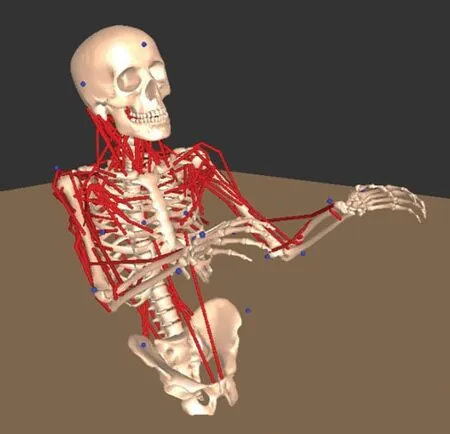
Figure 9:Musculoskeletal model
Figure 10:Hill type model
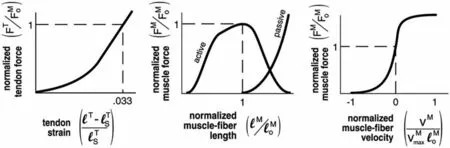
Figure 11:Mechanical properties of muscles
3.3 Inverse Kinematics Calculations
Inverse kinematics calculations using the rigid-body-link model enables each joint angle to be obtained from the measured three-dimensional coordinate data and the subject’s physique information such as height and weight[23].
The neck joint angle is defined as shown in Fig.12.The position of the reflective marker affixed at the neck joint’s center of rotation and at the back of the head and shoulder(all captured with the motion capture cameras)can be calculated by converting them into three-dimensional coordinate data.
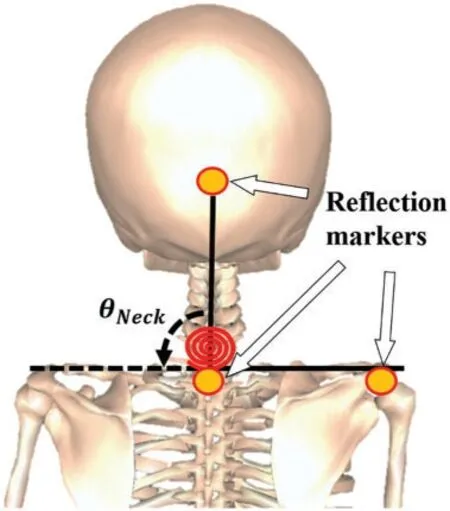
Figure 12:Driving torque around neck joint
3.4 Inverse Dynamics Calculations
Inverse dynamics calculations use the musculoskeletal mathematical model to estimate the degree of muscle activity from each neck joint angle (calculated from inverse kinematics calculations) and the driving torque around each neck joint(calculated from the three-dimensional coordinates of each segment).The driving torque around each muscle in the neck joint can then be obtained.Muscle torque around the neck joint in Fig.13[23].
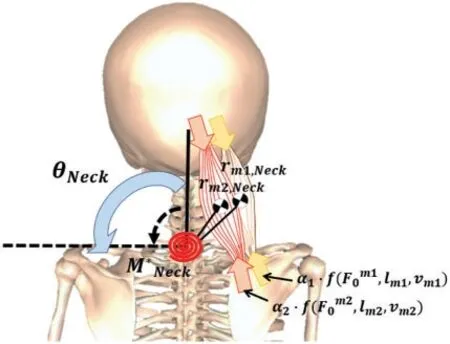
Figure 13:Muscle torque around the neck joint
3.5 Driving Power around Each Joint and Driving Power of Muscles around Each Joint
By integrating the drive torque Mj(θ)around the joint with the joint angle corresponding to one cycle of motion (θj(t1)~θj(t2)) and dividing by the motion-captured time (t1~t2) shows essential motion performance per unit time.Eq.(1) shows the formula used to calculate the drive power Pjaround the jth joint.The same can be said for muscles.
3.6 Angular Momentum of Each Muscle around the Joint
From the muscle torque Mi,j of the ith muscle connected to the jth joint,the equation of motion becomes as shown in Eq.(2).
Here, Ii,jrepresents the moment of inertia in the ith muscle with respect to the jth joint, andkθjrepresents the rotational spring characteristics around the jth joint.Also,shows the angular acceleration in the ith muscle with respect to the jth joint axes.
Assuming that the joint is a pin connection,thenkθj= 0.Eq.(2)is used to calculate the angular momentum.Integrating Eq.(2)from t1~t2,which is one cycle of motion,the formula for calculating the angular momentum becomes as shown in Eq.(3).Eq.(4)is a re-arrangement of Eq.(3).
3.7 Vehicle Behavior
Considering that the motion capture system is affixed to the vehicle,collecting the manufacturer’s position data must be regarded as a change in the camera’s coordinate system.At present, the data does not reflect vehicle effects on the driver during the double lane change(evasive maneuver)test.
We could not reproduce the inertial force caused by vehicle acceleration or the torque generated during vehicle turning.The calculations included significant errors compared with an actual moving vehicle.
As a result,we propose a method that processes data on translational motion with three degrees of freedom(x,y,z)and data on rotational motion(roll,pitch,and yaw)with three degrees of freedom around the x, y, and z axes.The axes shown in Fig.14 were incorporated in the musculoskeletal mathematical model.Steering angle obtained by the steering force meter used in the measurements of Section 2.1 is shown in Fig.15 and lateral acceleration,that is,translation motion(y direction),is shown in Fig.16.The yaw rate corresponding to rotational motion is shown in Fig.17.
The results shown in Figs.15-17 are consistent with each other,which suggests that they represent correct vehicle behavior.
In general,the integrals of acceleration and angular velocity in a dynamic coordinate system do not equate to position and angle, respectively, as seen from the ground.To therefore define vehicle behavior and position, static coordinates are set separate from dynamic coordinates.A schematic diagram of dynamic coordinates is shown in Fig.18.
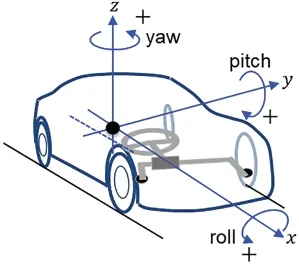
Figure 14:Six degrees of freedom
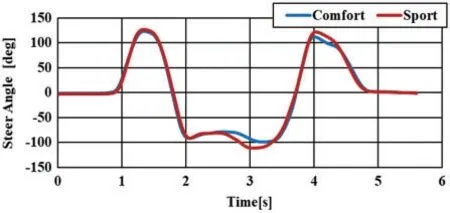
Figure 15:Steer angle during double lane change test
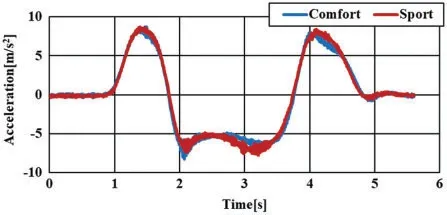
Figure 16:Lateral acceleration during double lane change test(y direction)
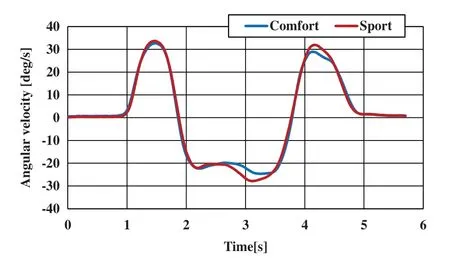
Figure 17:Angular velocity during double lane change test(yaw)
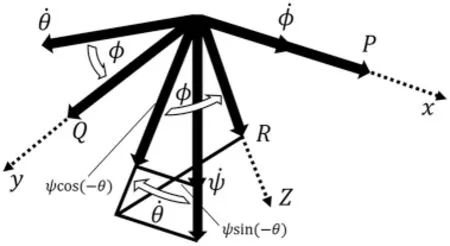
Figure 18:Dynamic coordinates
The angular velocities around the x-axis (roll), y-axis (pitch), and z-axis (yaw) in this dynamic coordinate system are P, Q, and R.The coordinate axes of the stationary coordinate system and dynamic coordinate system areφ,θ,andψ.Next,from Fig.18,the relationships between these angular velocities and angles are given by Eq.(5).
Change over time ofφ,θ,andψcan be obtained by solving the differential equations shown in Eq.(5).Treating the camera coordinate system as a stationary coordinate system,vehicle behavior and driver movement data can be obtained by rotating the positions of the driver’s 32 reflective markers.In this regard,the rotation matrix is given by Eq.(6).
The inertial forces generated by acceleration along the x,y,and z axes of the vehicle is achieved by importing additional forces into the musculoskeletal model.The mass of the driver’s head is multiplied by vehicle acceleration to define direction and magnitude of the inertial forces acting on the head at that time.Setting the sensors accurately enables vehicle behavior to be significantly restored.
4 Analysis and Considerations
This section presents a variety of comparisons to analyze different types of loads.In particular,comparison of driving torque between comfort mode and sport mode having different vehicle damper characteristics during a double lane change that requires the vehicle to make an emergency evasive maneuver.The driver’s upper body(neck,shoulders,waist)is analyzed and results are shown for the neck that is significantly affected by lateral acceleration.
4.1 Driving Torque at the Neck Joint
This section presents the results of analyzing driving torque at the neck joint.We built the marker position coordinates shown in Fig.8 into the musculoskeletal mathematical model of Fig.9.We also used inverse kinematics taking into account the inertial forces calculated from vehicle behavior in the stationary coordinate system.We were therefore able to calculate driving torque at each joint based on the joint angle,angular velocity,and angular acceleration.Analysis data were averaged over three sets of collected data.
Driving torque at the neck joint considering only driving movement data is shown in Fig.19.Driving torque of the neck joint considering the inertial force calculated from the behavior of the vehicle is shown in Fig.20.Typical motions at the neck joint are lateral bending motion, rotational motion, and forward bending motion.The results shown are those for lateral bending motion for which effects are larger in magnitude according to the results of this analysis.The horizontal axis shows time[s]and the vertical axis shows driving torque[Nm]during lateral bending motion of the neck joint.
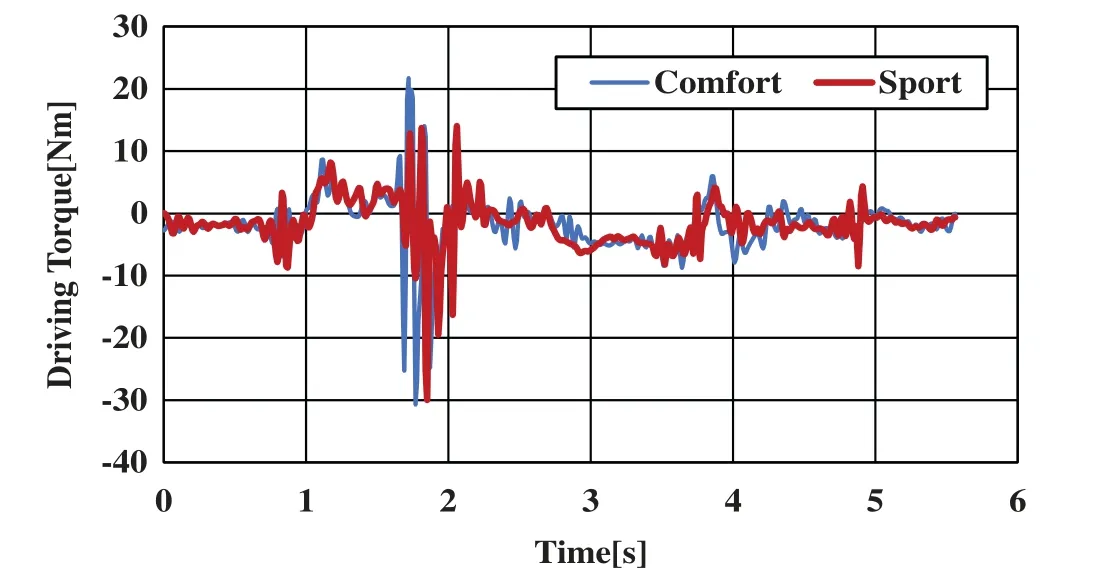
Figure 19:Joint torque of lateral bending motion(roll)of the neck joint
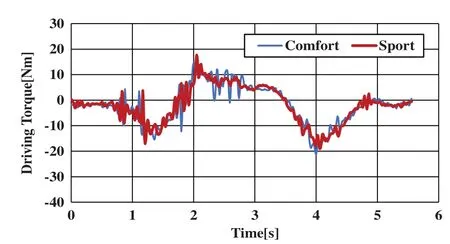
Figure 20:Joint torque of lateral flexion(roll)of the neck joint including the vehicle’s inertial behavior
Fig.19 shows that driving torque with respect to lateral bending motion of the neck joint considering only driving movement data was near 0 while also showing drastic change within the values of-10 and 10.Fig.20 suggests that driving torque with respect to lateral bending motion of the neck joint considering inertial forces calculated from vehicle behavior resisted those inertial forces in the left and right directions.This is because the driving torque in Fig.19 shows drastic change.However, in Fig.20, it can be seen that intervals of fixed driving torque are generated.In addition,there are no clear differences between comfort mode and sport mode.
4.2 Driving Power at the Neck Joint
In this section, based on the results using driving torque at the neck joint given in the previous section,we present the analysis results for driving power indicating the intrinsic motor performance of each joint using an analysis technique proposed in this study.These analysis results were calculated from 0.7 to 5.4 [s] as the target range of analysis.Analysis data were averaged over three sets of collected data.
Driving power at the neck joint considering only the driver movement data is shown in Fig.21.Driving power at the neck joint considering the vehicle’s inertial behavior is shown in Fig.22.Typical motions at the neck joint are lateral bending motion (roll), rotational motion (yaw), and forward bending motion (pitch).The results for driving power at the neck joint are shown for each of these motions.The horizontal axis shows each motion at the neck joint divided into comfort mode and sport mode and the vertical axis shows driving power[W]at the neck joint.
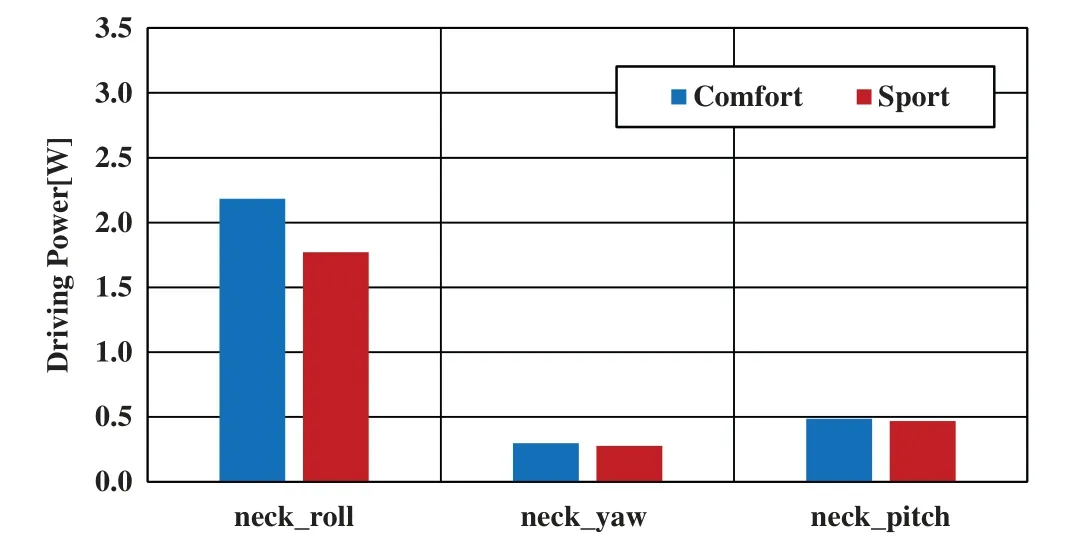
Figure 21:Neck joint drive power
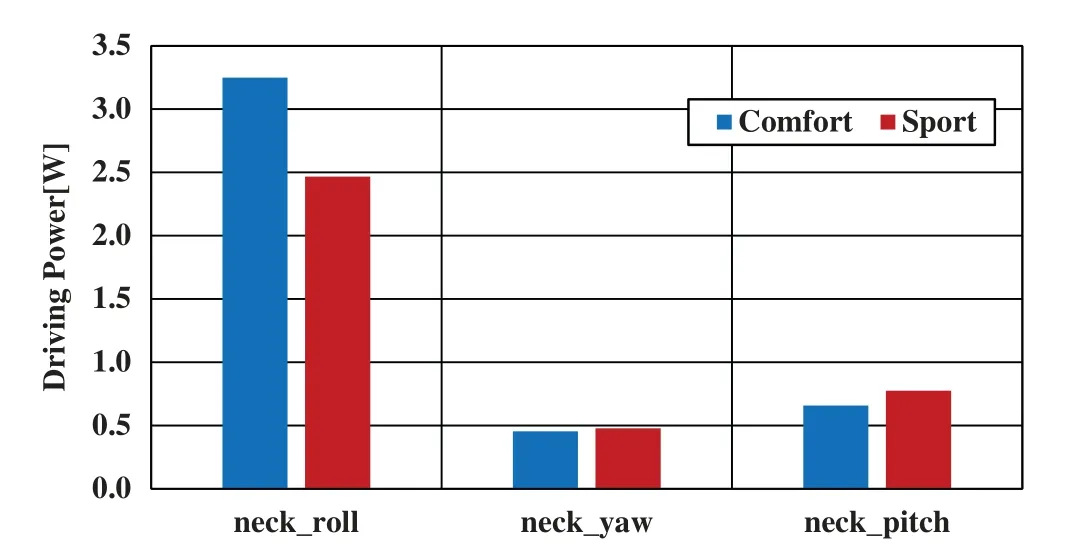
Figure 22:Driving power of the neck joint considering the vehicle’s inertial behavior
On comparing Figs.21 and 22,the analysis results considering only driver movement data turned out to have smaller values for each neck-joint motion than the analysis results considering the vehicle’s inertial behavior.The analysis results considering the vehicle’s inertial behavior produced large numerical values as expected.It can be seen that a difference in driving power of approximately 1.4 times appears for lateral bending motion(roll)at the neck joint.
In the case of lateral bending motion(roll)for which results show the highest effect at the neck joint,it can be seen that comfort mode wastes approximately 1.3 times more driving power than sport mode in either graph.In short, differences between comfort mode and sport mode can be clearly demonstrated even when considering only driver movements.
4.3 Driving Torque of Each Muscle at Neck Joint
In this section,we present the results of calculating each muscle’s driving torque acting about the neck joint using inverse dynamics calculations as described in Section 3.4.Analysis data were averaged over three sets of collected data.
The neck was divided into left and right sections in the calculations,and as the muscles exhibiting noticeable values were deemed to be the same on either side,we are showing only the muscle torque acting on the right side of the neck.Fig.23 shows the driving torque of the sternocleidomastoid muscle acting about the right neck joint considering only driver movement data.Fig.24 shows the driving torque of the sternocleidomastoid muscle acting about the right neck joint considering vehicle’s inertial behavior.Typical motions at the neck joint are lateral bending motion,rotational motion,and forward bending motion.The results shown here for driving torque are those for lateral bending motion that is impacted the most based on this analysis.The horizontal axis in the figures shows time[s]and the vertical axis shows driving torque[Nm]at the sternocleidomastoid muscle(stern_mast_r)exhibiting the most noticeable values during lateral bending motion at the right neck joint.
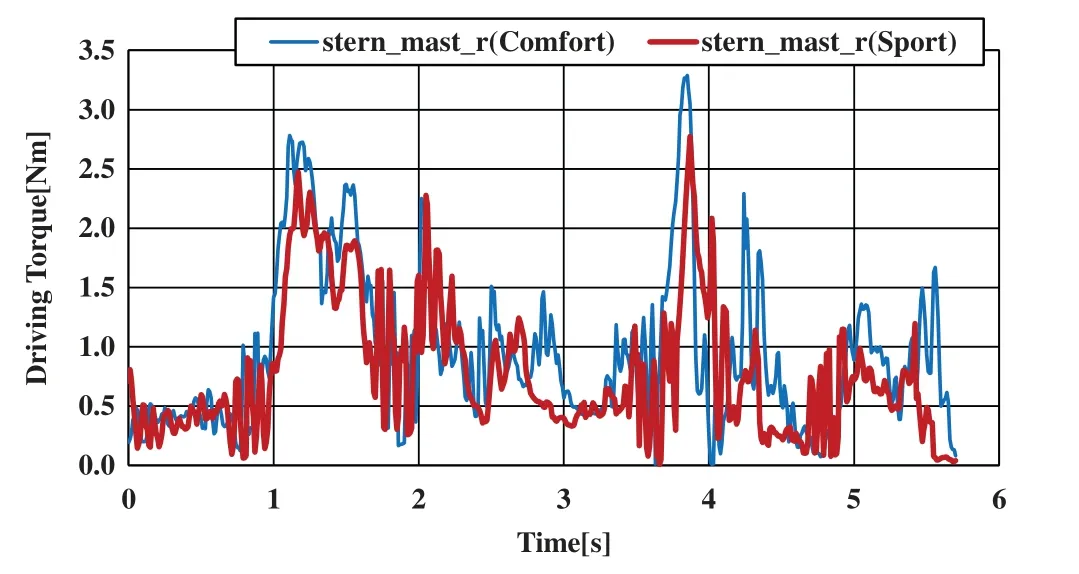
Figure 23:Driving torque of the sternocleidomastoid muscle around the right neck joint(roll)
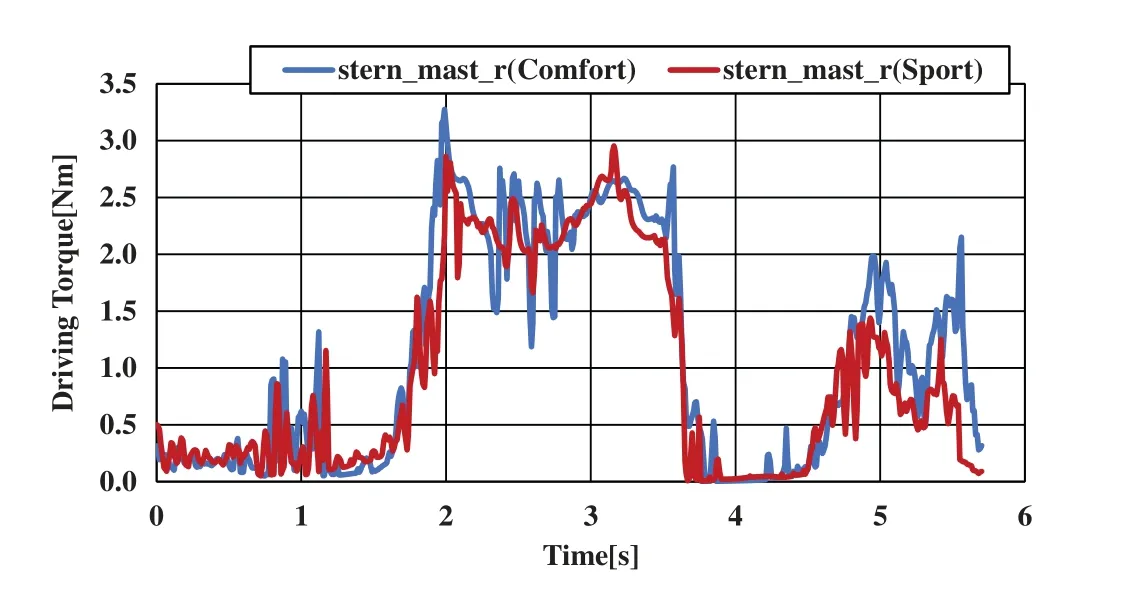
Figure 24:Driving torque of the sternocleidomastoid muscle around the right neck joint(roll)including vehicle’s inertial behavior
Instantaneous values of the driving torque at the sternocleidomastoid muscle acting about the neck joint during lateral bending motion are shown in Figs.23 and 24.Although not shown in these figures,we found that the sternocleidomastoid muscle,levator scapula muscle,and trapezius muscle could play important roles at the neck joint during each of the typical motions at this joint (lateral bending motion, rotational motion, and forward bending motion).Based on the above results, no differences arose in these important muscles regardless of the presence of inertial forces calculated from vehicle behavior.
As for differences in muscle torque between comfort mode and sport mode in lateral bending motion at the neck joint, there was no change in particular in the results considering only driver movement as shown in Fig.23.However, in the results that consider vehicle’s inertial behavior as shown in Fig.24, a constant driving torque can be seen between the time interval of 1.98-2.86 [s].Here,driving torque changes more intensely in comfort mode.Comfort mode is said to be relatively mild in steering stability,which may be the reason for this result.
4.4 Driving Power of Each Muscle Acting on the Neck Joint
Based on the results of muscle driving torque acting on the neck joint given in the previous section,we hereby present analysis results for driving power that indicates the basic motor performance of a muscle acting on a joint using an analysis method proposed in this study.These results were calculated from 0.7 to 5.4 [s] as the target interval for analysis.Analysis data were averaged over three sets of collected data.
Fig.25 shows the driving power of each muscle acting about the neck joint considering only driver movement data.Fig.26 shows the driving power of each muscle acting about the neck joint considering vehicle’s inertial behavior.Typical motions at the neck joint are lateral bending motion, rotational motion,and forward bending motion.The results shown here for driving power are those for lateral bending motion,which is impacted the most according to this analysis.In the figures,the horizontal axis shows the model names of the muscles acting about the neck joint and the vertical axis shows driving power[W].
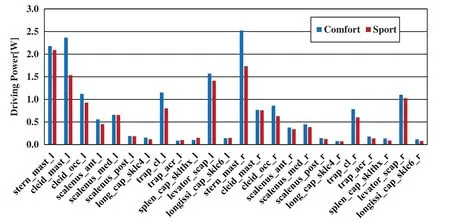
Figure 25:Driving power of muscles around the neck joint(roll)
Based on the analysis results of driving power in each muscle acting on the neck joint during a lateral bending motion as shown in Figs.25 and 26,the muscles corresponding to the most noticeable values of driving power were the sternocleidomastoid muscle, levator scapula muscle, and trapezius muscle,which are therefore thought to play an important role even in rotational motion and forward bending motion.It can be seen from these results that no differences arise in these important muscles regardless of the presence of inertial forces calculated from vehicle behavior.
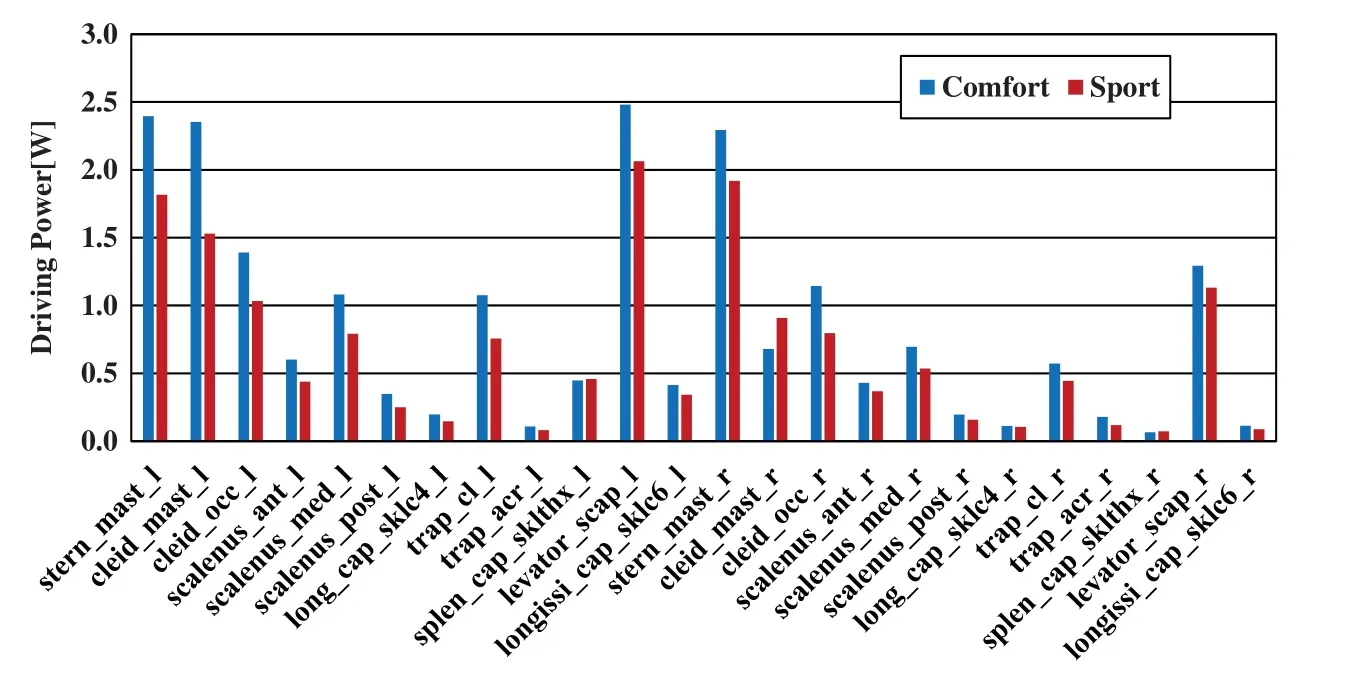
Figure 26:Driving power of muscles around the neck joint(roll)including vehicle’s inertial behavior
As for differences in driving power between comfort mode and sport mode for each type of motion at the neck joint,values were larger in comfort mode.This is because comfort mode is inferior to sport mode in terms of soft and stable steering due to the damper characteristics of this mode,which results in the use of more driving power by each muscle in comfort mode.
We compared the analysis results for the driving power of each muscle acting on the neck joint during lateral bending motion considering only driver movement data as shown in Fig.25 with the same considering vehicle’s inertial behavior as shown in Fig.26.No significant changes could be seen.
4.5 Angular Momentum
Based on the results of the driving torque of each muscle acting on the neck joint as given in the previous section,we hereby present analysis results for angular momentum that indicates the intensity of each muscle acting about the neck joint using an analysis method proposed in this study.These results were calculated from 0.7 to 5.4[s]as the target interval for analysis.Analysis data were averaged over three sets of collected data.
Fig.27 shows the angular momentum of each muscle acting about the neck joint considering only driver movement data.Fig.28 shows the angular momentum of each muscle acting about the neck joint considering vehicle’s inertial behavior.Typical motions at the neck joint are lateral bending motion,rotational motion,and forward bending motion.The results shown here for angular momentum are those for lateral bending motion,which is impacted the most according to this analysis.In the figure, the horizontal axis shows the model names of the muscles acting about the neck joint and the vertical axis shows the angular momentum[Nms]of each muscle at the neck joint during a lateral bending motion.
Based on the analysis results of angular momentum in each muscle acting on the neck joint during a lateral bending motion as shown in Figs.27 and 28,the muscles corresponding to the most noticeable values of angular momentum were the sternocleidomastoid muscle,levator scapula muscle,and trapezius muscle.The trapezius muscle corresponds to a noticeable value of angular momentum even for rotational motion, forward bending motion, and other neck joint motions, which indicates that it plays an important role here.
No differences were observed in angular momentum between comfort mode and sport mode during each type of neck joint motion.
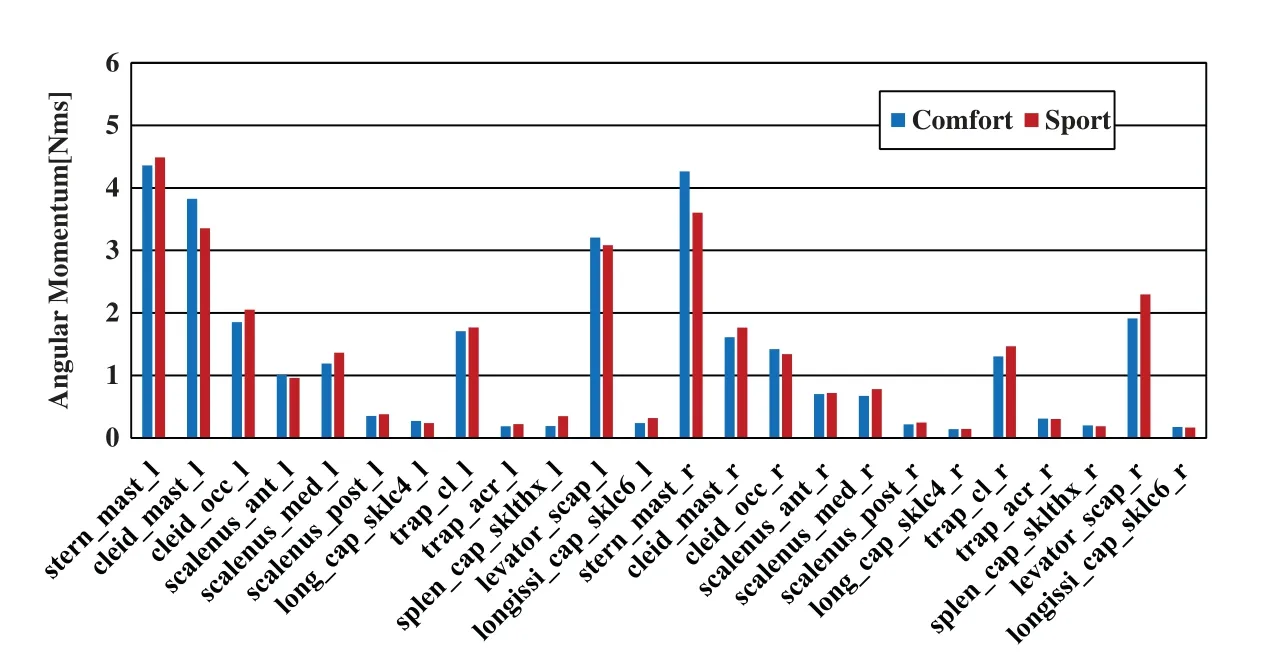
Figure 27:Angular momentum of muscles around the neck joint(roll)
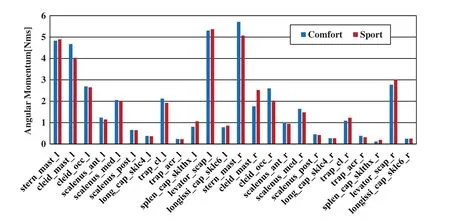
Figure 28:Angular momentum of muscles around the neck joint(roll)including the vehicle’s inertial behavior
We compared the analysis results for the angular momentum of each muscle acting on the neck joint during lateral bending motion considering only driver movement data as shown in Fig.27 with the same considering the vehicle’s inertial behavior as shown in Fig.28.To begin with, no major differences could be found in angular momentum between the left-and-right muscles of the same name in the graph considering only the driver movement data.On the other hand,there was some variation in the angular momentum between the left-and-right muscles of the same name in the graph considering the vehicle’s inertial behavior.For example,examining the graph of Fig.28 for lateral bending motion of the neck joint, a difference of approximately 1.8 times can be seen between levator_scap_l and levator_scap_r for either comfort mode or sport mode indicating a large difference even for the same muscle on the left and right of the neck.The reason for this is thought to be that taking into account the vehicle’s inertial behavior improved the accuracy of results enabling left-and-right loads to be seen in more detail.
5 Conclusions
The following conclusions can be made based on the above results:
(1) Results of analyzing the change in horizontal displacement of the head indicate that the sportmode damper setting provides more stability than the comfort mode damper-setting with respect to load on the neck.
(2) Results of analyzing driving power revealed that a more steering position could be obtained by the sport-mode damper setting in a double lane change test.
(3) By observing the driving force and angular momentum of the muscles, we can see that the muscles used to produce force are under the burden.
(4) Irrespective of accounting for the inertial behavior of the vehicle, the driving power of the neck joint clearly indicates the dominant presence of lateral bending motion.And this lateral bending motion of the neck joint is about 1.4 times when considering the inertial behavior of the vehicle.
(5) Considering the inertial behavior of the vehicle, the difference between the left and right muscles of the same name was more expressed in the muscle driving power and the angular momentum of the muscle.Specifically,the difference between the left and right levator scapula muscles is about 1.8 times.
From the above results, it can be considered that it is a reasonable method to quantify the ride comfort in terms of the roll feel of the driver by considering both the motion capture system and the IMU sensor in combination during real vehicle tests.
The approach taken in this study to quantify the ride comfort by performing musculoskeletal analysis of the driver in real vehicle test has been conducted for the very first time,so there do exist certain limitations.Specifically,the conclusions are made using the results of analysis of a single driver,which is statistically unreliable.To overcome that,an expert driver who is proficient in evaluating the vehicle feel parameters such as ride comfort was selected.
The present study will be expanded in the future by conducting the same analysis on different drivers by introducing the differences in age and driving experience.Moreover,in view of autonomous driving, research related to the ride comfort of passengers can also be analyzed using the method described in the present study.
Funding Statement:The authors received no specific funding for this study.
Conflicts of Interest:The authors declare that they have no conflicts of interest to report regarding the present study.
 Computer Modeling In Engineering&Sciences2023年6期
- Computer Modeling In Engineering&Sciences的其它文章
- Finite Element Implementation of the Exponential Drucker-Prager Plasticity Model for Adhesive Joints
- A Review of Electromagnetic Energy Regenerative Suspension System&Key Technologies
- Arabic Optical Character Recognition:A Review
- Survey on Task Scheduling Optimization Strategy under Multi-Cloud Environment
- A Review of Device-Free Indoor Positioning for Home-Based Care of the Aged:Techniques and Technologies
- Topology Optimization for Harmonic Excitation Structures with Minimum Length Scale Control Using the Discrete Variable Method