
Micro-interface enhanced mass transfer sodium carbonate absorption carbon dioxide reaction
2023-02-28 00:30HuShenYingyuXuJigangAnBowenJiangJinnanSunGuoqiangYangZhibingZhang
Hu Shen, Yingyu Xu, Jigang An, Bowen Jiang, Jinnan Sun, Guoqiang Yang, Zhibing Zhang
Key Laboratory of Mesoscopic Chemistry of Ministry of Education (MOE), School of Chemistry and Chemical Engineering, Nanjing University, Nanjing 210023, China
Keywords:Carbon dioxide Absorption Microbubble Bubble Sauter mean diameter Interfacial area Mass transfer
ABSTRACT Micro-interface intensified reactor (MIR) can be applied in series/parallel in the absorption of CO2 in industrial gases by Na2CO3 due to the ability to produce large numbers of stable microbubbles.This work focuses on the variation pattern of mass transfer characteristics parameters of the reaction gas in Na2CO3 solution under the influence of different solution properties and operating parameters in the reaction of CO2 absorption by Na2CO3.The mass transfer characteristics parameters include bubble Sauter mean diameter, gas holdup, interfacial area, liquid side mass transfer coefficient, and liquid side volume mass transfer coefficient kLa.The solution properties and operating parameters include Na2CO3 concentration(0.05-2.0 mol·L-1),superficial gas velocity(0.00221-0.01989 m·s-1),superficial liquid velocity(0.00332-0.02984 m·s-1), and ionic strength (1.42456-1.59588 mol·kg-1).And volumetric mass transfer coefficients kLa and superficial reaction rates r of the MIR and the bubble column reactor are compared in the reaction of sodium carbonate absorption of carbon dioxide,and the former shows a greater improvement under different solution properties and operating parameters.The enhanced role of MIR in mass transfer in non-homogeneous reactions is verified and the feasibility of industrial practical applications of MIR is demonstrated.
1.Introduction
With the development of mankind and the industrialization of the world,the energy demand is constantly at a high level.Although new energy sources are rising in prominence, fossil energy still dominates energy demand[1].The use of fossil fuels inevitably generates large amounts of CO2,and the reduction in global forest cover prevents the immediate absorption of the extra carbon dioxide emissions so the level of carbon dioxide in the atmosphere has been slowly increasing[2].This has led to an increase in global warming and the greenhouse effect [3] as well as a crisis in the survival of marine life caused by seawater acidification [4,5].It is therefore urgent to reduce CO2emissions and recycle it.
At present, there are two main methods to reduce CO2in the atmosphere.One is to reduce CO2emissions by developing clean energy and gradually reducing dependence on fossil energy, such as the development of new energy vehicles [1,6,7].However, the constraints of clean energy, such as either high economic costs,poor stability or fledgling development, have limited its development[8-10].Therefore,the recovery and reuse of CO2is also a goal that scientists are currently striving for[11].The main methods for capturing CO2from industrial waste gases and storing it for use as a fresh industrial feedstock are membrane separation techniques[12-14], supersonic flow techniques [15-17], physical adsorption[18-20] and chemical absorption [21-25], among others.Among these, chemical absorption has characteristics such as high selectivity [26], fast absorption rate [27] and good reversibility[28,29], which make it stand out among many methods.Whereas chemical absorption of carbon dioxide tends to select alkaline substances for absorption [21-25], sodium carbonate [23,24], sodium hydroxide [30] and amines [25] are often chosen by industry in consideration of economic efficiency.While it is important to explore more suitable absorbents,it is equally important to explore more effective reactors,such as rotating folded beds,microchannel reactors, new microreactors, rotating packed bed reactors, and micro-interface intensified reactor (MIR), to name a few [30-36].
The bubble column reactor(BCR)is a commonly used gas-liquid contact reactor in industry and is widely used in fine chemicals,wastewater degradation, petrochemicals, and other fields because of its simple structure,stable operation,high heat,and mass transfer efficiency[37-39].However,differences in the internal structure in BCR affect the size of the bubbles produced[36,40,41],while the size of the bubbles determines the size of the interfacial area[36,42,43],thus hindering further improvements in the mass transfer efficiency of BCR.The mass transfer factor is another factor that affects the superficial reaction rate in addition to the intrinsic kinetic factors of the reaction [44].Therefore, reducing the mass transfer resistance can help to increase the superficial reaction rate of a reaction[45,46].Microbubbles(mainly bubbles less than 1 mm in diameter)are more stable than macrobubbles (mainly bubbles larger than 1 mm in diameter)and have a larger interfacial area and better mass transfer in steady-state operation[36,42,43].Microbubble generation methods include foaming agent[24],laser irradiation[47],aeration[48],gas absorption[49]and turbulent shear[36,50],among others.Therefore, this group combines a BCR and microbubbles to develop a BCR capable of generating a large number of microbubbles, and investigates the mass transfer characteristics of oxygenammonium sulfite in the MIR[36], and explores the effect of ionic strength on the morphology of microbubbles under the MIR [50].Therefore, this work is to absorb CO2(20%, molar ratio) in a simulated industry using an inexpensive Na2CO3absorber in the MIR.The effects of Na2CO3concentration,superficial gas velocity,superficial liquid velocity,and ionic strength on the mass transfer characteristics parameters bubble Sauter mean diameter d32[51,52], gas holdup εg, interfacial area a [53], liquid-side mass transfer coefficient kL[54] and the liquid-side volume mass transfer coefficient kLa[55]are discussed.And the liquid-side volumetric mass transfer coefficients of the MIR are compared with the BCR to verify the mass transfer enhancement effect of the MIR.
2.Materials and Methods
2.1.Experimental setup
The experimental setup is shown in Fig.1.The experimental bubbling column was mainly made of stainless steel at the bottom and top of the column, with ball valves at the inlet and outlet to control the fluid flow,and was made of transparent resin glass with an inner diameter of 80 mm, an outer diameter of 90 mm and a total height of 72 cm.The gases used in the experiments to simulate real industrial exhaust gases were a mixture of carbon dioxide and nitrogen in cylinders,with a molar proportion of carbon dioxide of 20%.The liquid used for the experiments was a fresh homemade aqueous solution of Na2CO3.
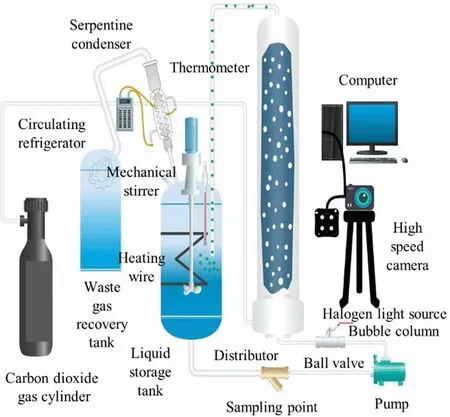
Fig.1.Experimental setup.
Before each experiment, 7 L of an aqueous sodium carbonate solution was added to the tank at the exact concentration required for the working conditions, while a thermostatic circulating oil bath was turned on to control the experimental temperature at 303.15 K.The experimental temperature was monitored in realtime by a digital thermometer at the base of the MIR,and the stirrer speed was set to 200 r·min-1to mix the gas-liquid mixing phase fed into the top of the tower to keep the instantaneous concentration inside the tank homogeneous.
The Na2CO3solution in the storage tank was pumped into the MIR through a centrifugal pump at the bottom of the tower via a rotameter, and the mixed gas in the cylinder also entered the MIR through a gas rotameter, both of which first pass through the core unit of the MIR at the bottom of the MIR and formed a large number of microbubbles through gas redistribution before flowing together into the resin glass tower column.Finally, the gas-liquid mixed phase was sent to the storage tank through the fluid transmission pipeline at the top of the tower to realize the full circulation of the liquid phase and the steady operation process of the gas-liquid concurrent flow.The Ugin the experiment ranged from 0.002210-0.01 989 m·s-1and the Ulranged from 0.003320-0.02984 m·s-1.
The characteristics and morphology of the movement of the bubbles inside the column were captured in real-time by a highspeed camera,which helped to analyze the bubble size distribution(BSD) by flow visualization techniques.The reaction was terminated after a certain time.At the end of the gas holdup measurement, the reaction was cycled for a period and a portion of the reaction liquid was collected and the pH of the reaction liquid was measured using a pH meter.The reaction liquid was then a mixture of Na2CO3and NaHCO3and the pH of the mixture was used to obtain the conversion of Na2CO3.
2.2.Chemicals and materials
Main reagents: Na2CO3(≥99.9%, Macklin), CO2in N2(CO220%(mol), TGAS), CO2(99.9%, TGAS), and deionized water.The instrument used to measure pH in the experiments was a pH meter(PXSJ-226, Leici, China).Aspen Plus is generally considered to be the most suitable and complete physical system for industry.The Aspen Plus V9 was therefore used to simulate several physical properties of Na2CO3at different concentrations, such as density,viscosity, and surface tension, to investigate their effect on mass transfer.The theoretical values of several physical properties of different concentrations of Na2CO3solutions at different solution properties and operating parameters are summarised in Table 1.

Table 1 Several physical properties of pure sodium carbonate solutions and after the addition of some sodium chloride calculated using Aspen Plus V9
2.3.Image analysis
The light source and high-speed camera system consisted of a halogen light source with adjustable power, a high-speed camera,and a computer with corresponding image analysis software.The power of the halogen light source was controlled at 400 W to provide a bright shooting environment.The high-speed camera was operated at an exposure time of 400 μs with a resolution of 1024 pixels × 768 pixels or 200 μs with a resolution of 1920 pixels× 1080 pixels,recording the high-speed motion of the gas-liquid flow at a frame rate of 2000 frames per second and transmitting it to the computer via an HDMI cable for real-time data recording.
As black and white photos compared with colour photos can highlight the relationship between light and shadow, light and dark changes,and strengthen the contrast.So the high-speed cameras all used black and white camera,and the video taken was different degrees of grey so that the bubble group in the background of the strong light illumination was more distinct, and convenient for the subsequent image analysis software recognition processing.Through the image analysis software, five photographs were randomly selected for each working condition, and 100-200 bubbles were collected for diameter analysis in each photograph, thus reducing the interference of human factors, reducing the system error, and improving the accuracy of the bubble equivalent diameter (de).The images captured and processed in the experiment are shown in Fig.2.
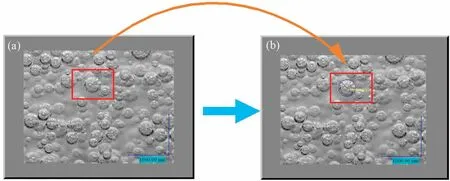
Fig.2.Schematic diagram of bubble treatment.
The accuracy of this experiment was measured down to 10 μm.The data were tested for differences using the SPSS software package: the data on bubble sizes obtained for the different working conditions were tested for a normal distribution and the results were non-normal.As the data were independent between the different working conditions, the H-test in the non-parametric test was chosen and a p-value of 0.000 <0.001 was obtained,indicating a statistically significant difference.
2.4.Carbon dioxide mass transfer
The total reaction for the absorption of CO2by Na2CO3in the MIR is as follows.
To prevent over-reaction and to ensure the accuracy of each sample, the sampling endpoint for each condition was agreed to be the 20th min after the start of the introduction of CO2gas,except for the experiment to investigate the absorption of carbon dioxide by Na2CO3with time, where the sampling frequency was 5 min per time.Three replicate experiments were completed for each condition and the three measured solutions were mixed and then measured with a temperature-compensated pH meter to obtain the pH of the final mixture at the end of the series of reactions,which was either a mixture of Na2CO3and NaHCO3solutions or a mixture with all converted to NaHCO3and with a small amount of CO2absorbed.The pH of the mixture was then used to obtain the conversion rate of Na2CO3.Aspen Plus V9 was chosen to simulate the relationship between pH and sodium carbonate concentration after carbon dioxide absorption by Na2CO3under different working conditions, to calculate the reaction rate of the reaction.
Since the absorption of CO2by Na2CO3is done instantaneously,it can be assumed that CO2is not physically dissolved in the reaction solution until the Na2CO3is consumed in the solution, that is the mass transfer rate (MTR) of CO2from the gas phase to the liquid phase is then equal to the rate of CO2consumption [24,56].
It is known from the literature [24,57] that the absorption of CO2by Na2CO3is a proposed primary reaction, and that
where k is the reaction rate constant for the reaction of CO2absorption by Na2CO3and x, y and z are the exponents on the concentration of the corresponding substances respectively.Since the absorption of carbon dioxide by sodium carbonate is a proposed primary reaction [24,57], the relative carbon dioxide excesses of Na2-CO3and H2O can be considered as constants, that is y = 1, so simplifying Eq.(3) as
k’ is the superficial reaction rate constant for the reaction of CO2absorption by Na2CO3, which can be found by integrating Eq.(4)and taking the boundary condition that Ct= C0, when t = 0.This gives
where Ctis the concentration of CO2at moment t,C0is the concentration of CO2at the initial moment, and t is the reaction time for this experiment.k’is the superficial reaction rate constant in min-1,and its value is the opposite of the slope as shown in Fig.3, k’ =0.04579±8.9156×10⁻⁴min-1.The squared linear correlation coefficient, R2= 0.99811, can see that the linear correlation is good.Since k’ should be independent of the concentration level of ions in solution and only be an Arrhenius type temperature function[58],the value of k’can be applied to each of the other working conditions due to the same temperature for each working condition.
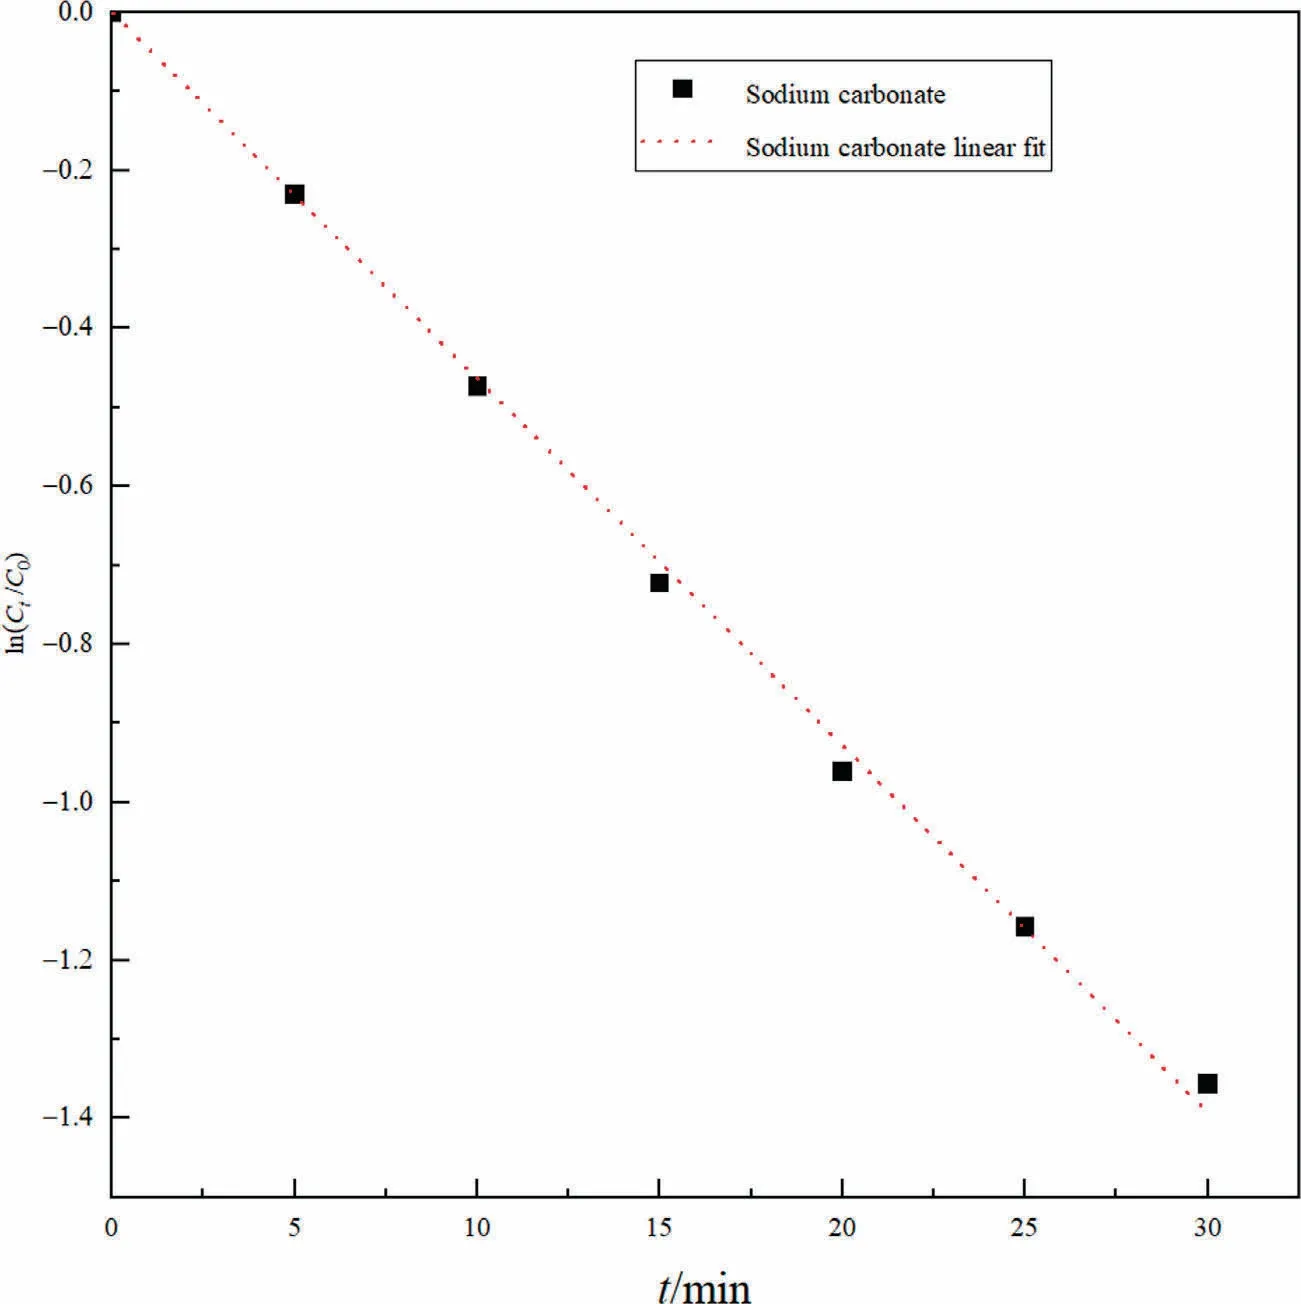
Fig.3.Kinetic fitting relationship between sodium carbonate and carbon dioxide at 303.15 K.
2.5.Mass transfer characteristic parameters
The Sauter mean diameter of a spherical bubble (d32) is the diameter of a bubble population in which spherical bubbles of different diameters are equated into a bubble population of the same diameter[52],and is a key parameter in determining the effectiveness of mass transfer in gas-liquid contact equipment.
d32of a spherical bubble can be calculated from the equivalent diameter (de) by the following equation [51].
If there is a distinct ellipsoidal bubble in a given working condition, Eq.(7) can be used to find the deof the bubble.
The gas holdup εg, as the name implies, is the proportion of the gas phase in the volume of the gas-liquid mixed phase and is an important hydrodynamic parameter in the design of bubble column reactor dimensions.Its magnitude affects the interfacial area between the gas and liquid, and thus the mass transfer coefficient of the entire bubble column reactor.The main methods reported in the literature for measuring the gas holdup are the use of the pressure difference before and after venting the reactor [59], the use of the difference in the conductivity of the gas-liquid phase [60], the use of the γ-ray optical density method[61]and the volume expansion method [62].The method used to measure the gas holdup in this experiment was a variation of the volumetric expansion method: while venting the gas in the liquid phase, the inlet valve of the gas-liquid phase was closed simultaneously, and the height of the liquid in the tower was measured by waiting for the liquid to fall back to a steady state, thus obtaining the gas holdup.
where Hcis the height of the MIR from the base to the top flange gasket and Hlis the height of the MIR from the base to the liquid level.
The interfacial area is then a function of the gas holdup and the bubble Sauter mean diameter, which is related as follows [53].
According to the two-film theory [54], MTR can in turn be expressed by the volumetric mass transfer coefficient kLa on the liquid film side and the concentration gradient(C*-CA)on the liquid film side, that is,
where kLis the liquid-side mass transfer coefficient of CO2absorbed by Na2CO3,a is the interfacial area,C*CO2is the saturated concentration of CO2absorbed near the interface of the Na2CO3solution,and CCO2is the actual concentration inside the Na2CO3solution.Since the absorption of CO2by Na2CO3is instantaneous, it is reasonable to assume that CCO2= 0, that is,
Since the properties of the Na2CO3solution differ significantly from those of the ideal liquid, and the molar fraction of carbon dioxide in the simulated industrial mixture is 20%, which is much larger than the molar fraction when Henry’s law is applied, the C*CO2cannot be estimated by Henry’s law at this time.Therefore,we combined Aspen Plus V9 to simulate the theoretical values of C*CO2under various solution properties and operating parameters,as shown in the Table 2 below.
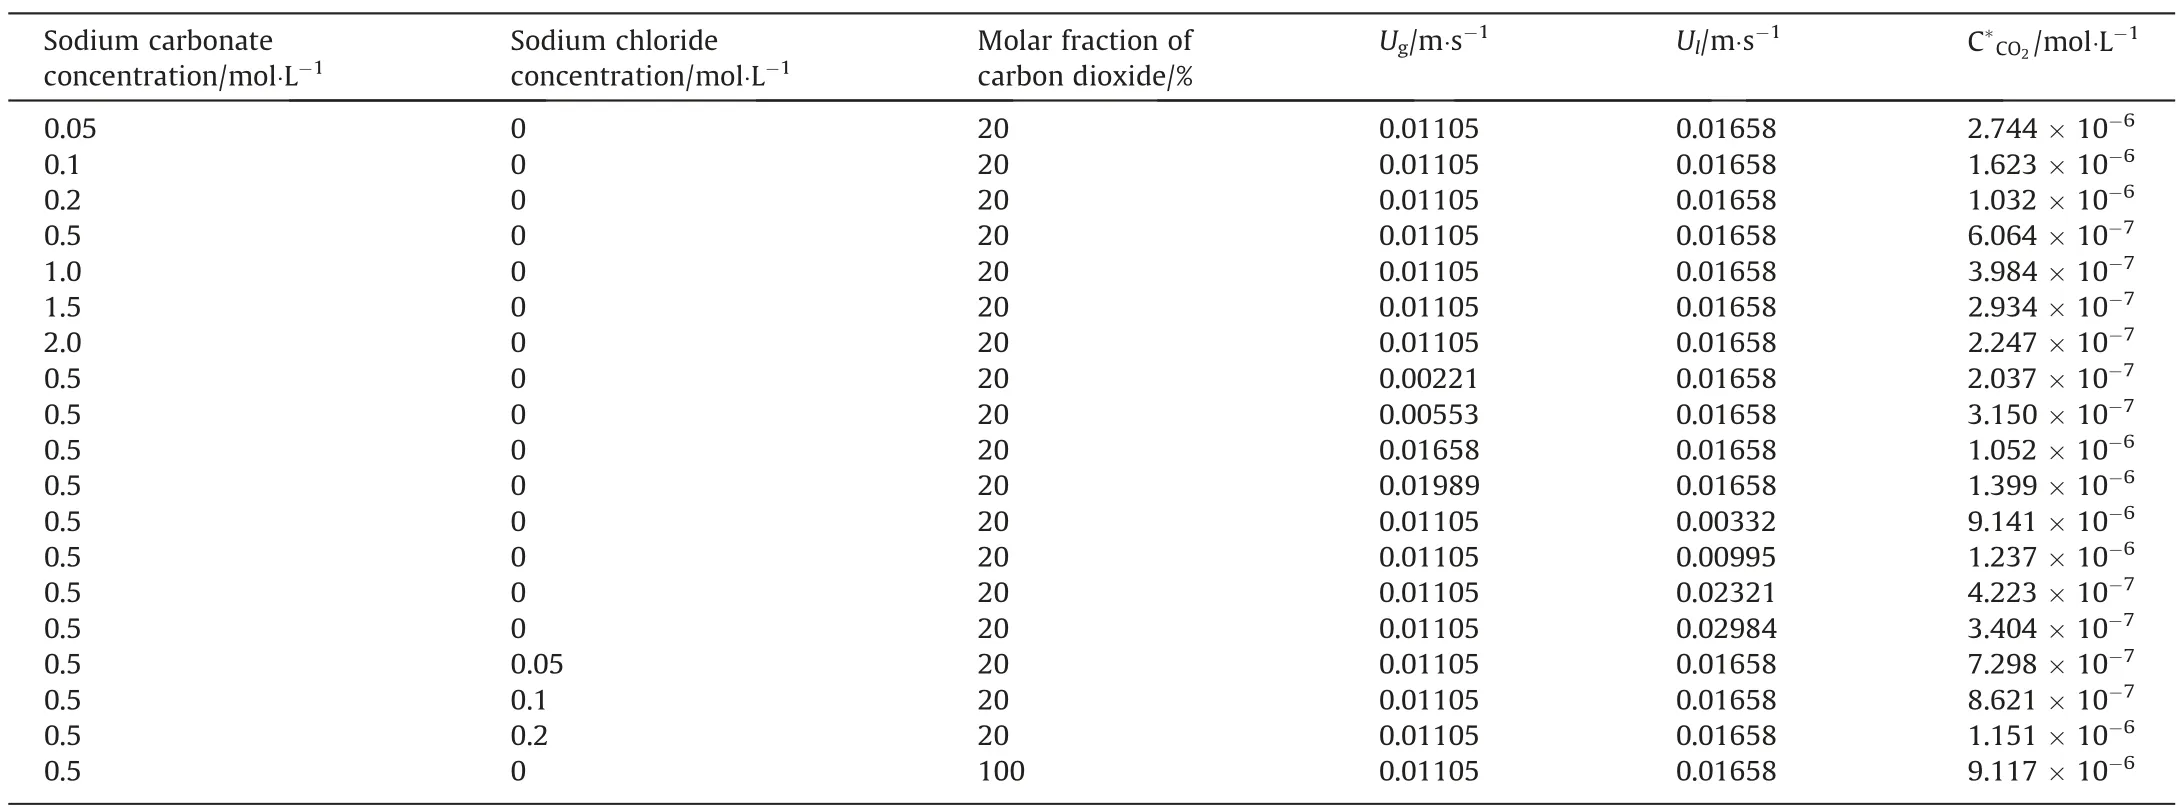
Table 2 Values of C*CO2 simulated by Aspen Plus V9 under various solution properties and operating parameters.In each case, the temperature was 303.15 K and the pressure is 101.325 kPa
So by combining Eqs.(6)and(11),the liquid-side volume mass transfer coefficient kLa and the liquid-side mass transfer coefficient kLfor the absorption of CO2by Na2CO3can be obtained as
3.Results and Discussion
3.1.Bubble Sauter mean diameter and bubble size distribution
The size of the bubble determines the efficiency of mass transfer in the gas-liquid phase.Small and uniform and stable bubbles increase the interfacial area between the gas-liquid phase.The increase in interfacial area reduces the mass transfer resistance,which increases the mass transfer rate of the reaction,thus greatly increasing the reaction rate and reducing the theoretical number of plates required in industry for the reaction tower.In multiphase vesicular flow reactions, the size of the bubbles [36,40,41] is usually influenced by their physical properties, the various operating parameters of the experiment, and the reaction process.
However, not all liquids can form large and stable microbubbles,which is related to the physical properties of the liquid itself.For example, in pure water, the bubbles mostly appear as macroscopic large bubbles and it is difficult to form large numbers of stable microbubbles.However, when the right amount of salt or surfactant is added to pure water[50], changing its physical properties, the size of the bubbles can change significantly with the number of additives.Also,the content of carbon dioxide can affect the bubble size,e.g.industrial gases with molar fraction of 20%and 100% CO2have very different bubble sizes and bubble densities,especially at the start of the reaction.This is shown in Fig.4.
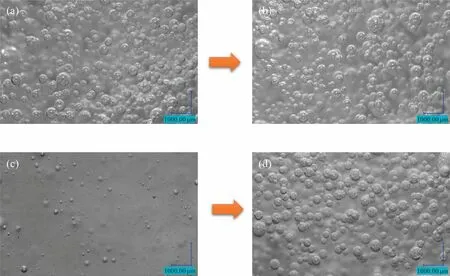
Fig.4.Effects of different molar fraction carbon dioxide contents of the reaction gas on bubble size and bubble density:(a)20% reaction initiation,(b) 20%reaction end,(c)100%reaction initiation,(d)100%reaction end.The temperature is 303.15 K,the pressure is 101.325 kPa,the Ug was 0.01105 m·s-1,the Ul is 0.01658 m·s-1 and the Na2CO3 concentration is 0.5 mol·L-1 for each condition, except for the gas compositions of 20% and 100% respectively.
Fig.4(a)and(b)show the beginning and end stages of the reaction with 20% CO2.From the graphs, it can be seen that the main body of the bubbles in both are microbubbles, the bubbles in the end stage are smaller, and the bubble densities in both are almost the same.Fig.4(c) and (d) show the start and end phases of the reaction at 100% CO2.The bubbles are smaller in the start phase and larger microbubbles in the end phase, but the bubble density in the start phase is much smaller than in the end phase of the reaction.The likely reason for this is that 100% CO2is absorbed almost entirely by the Na2CO3solution at the beginning of the reaction, unlike 20% CO2which is absorbed, and then there is 80% (mol) N2as support for the bubble size.After the conversion of a large amount of sodium carbonate to sodium bicarbonate,the reduction in the size of the carbon dioxide bubbles caused by the absorption of carbon dioxide by the sodium carbonate also gradually disappears, i.e.the carbon dioxide is passed into a salt solution with which it does not react, at which point only the MIR breaks up the bubbles.
In this experiment, the solution properties and operating parameters of the experiment are mainly Na2CO3concentration,superficial gas velocity, superficial liquid velocity, and ionic strength.The temperatures in the experiment are 303.15 K and the pressures are 101.325 kPa.Their effects on microbubble size are shown in Figs.5 and 6.
As shown in Fig.5(a), the Sauter mean diameter of the bubbles in this experiment decreases as the Na2CO3concentration increases.At a low concentration of Na2CO3(0.05 mol·L-1), the bubbles in the MIR are generally macroscopic,that is large bubbles of millimeter size,but there are also a few small bubbles of micron size mixed in.Therefore,it can be considered that there is a critical concentration in the concentration range of 0.05 mol·L-1where macroscopic bubbles and microbubbles co-exist.At this point,there is a dynamic equilibrium between the fragmentation of macroscopic large bubbles and the aggregation of mesoscopic microbubbles.The reason for this state may be that the ionic strength of the solution also reaches a critical value.The bubble Sauter mean diameter decreases sharply when the Na2CO3concentration is a little higher,after which the bubble Sauter mean diameter is in a steady and slow decreasing state as the Na2CO3concentration increases.Possible reasons for this phenomenon are,on the one hand,an increase in the overall viscosity of the Na2-CO3solution and an increase in the shear stress on the surface of the bubbles by the liquid, causing the macroscopic large bubbles to break up into smaller ones[63].On the other hand,the increase in ionic strength leads to an increase in the ζ-potential of the bubble surface, which inhibits the aggregation of microbubbles and makes them more stable [64].This leads to a rapid decrease in the bubble Sauter mean diameter and then a gentle decrease.It is also possible that all the CO2in the gas mixture is absorbed by the Na2CO3, causing the original macroscopic bubbles to collapse instantaneously into many microbubbles, just as the NH3/H2mixture is used to create microbubbles by passing it through water[49].However, when the concentration of Na2CO3is greater than 1.5 mol·L-1, the bubble Sauter mean diameter hardly changes.The reason for this stage may be that as the concentration of Na2-CO3increases,the overall surface tension of the solution gradually increases [65] and the possibility of bubble aggregation increases,leading to the impossibility of an infinite decrease in the Sauter mean diameter of microbubbles at the previous stage, which will eventually reach equilibrium at one concentration.
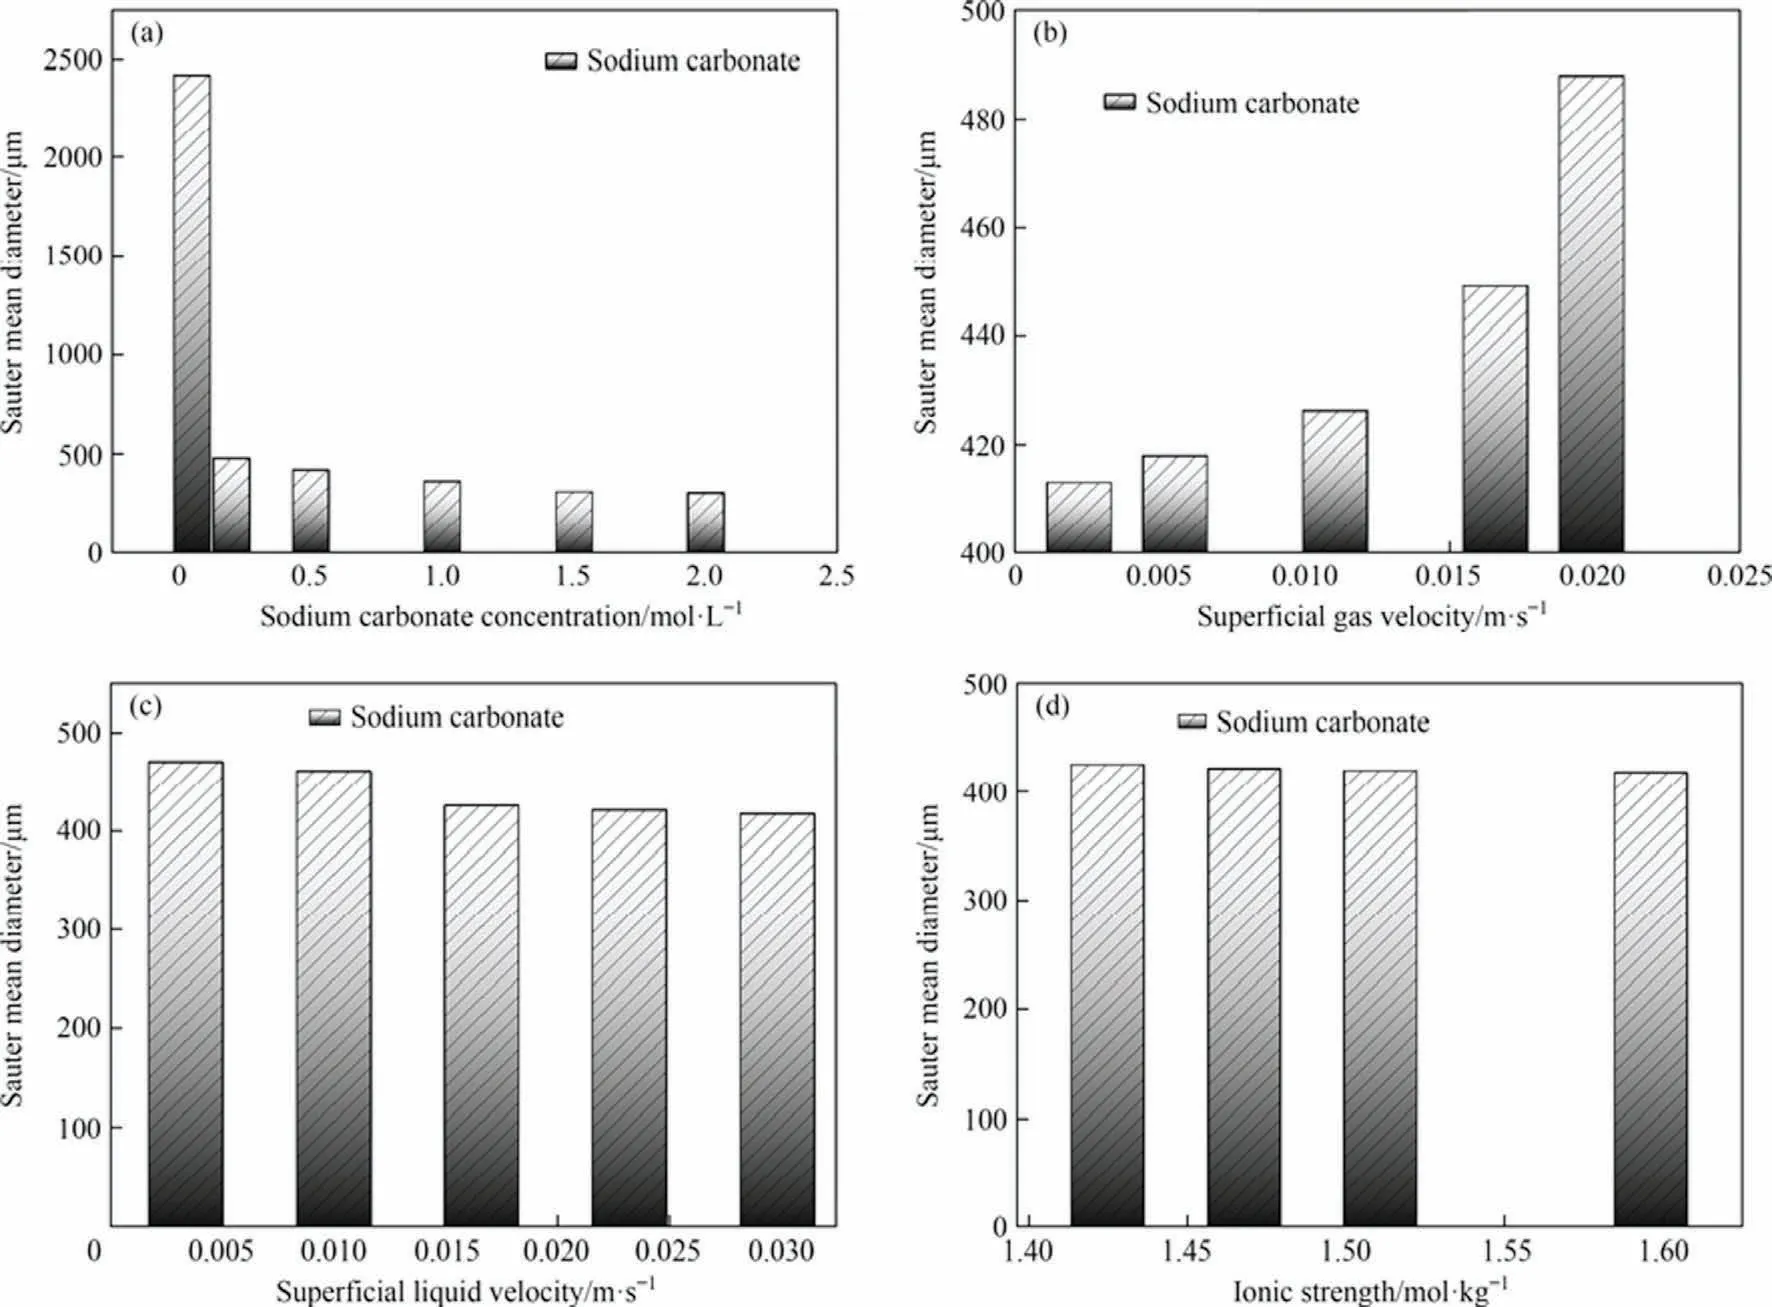
Fig.5.Effects of different operating parameters on the Sauter mean diameter of bubbles in the experiment:(a)sodium carbonate concentration,(b)superficial gas velocity,(c)superficial liquid velocity,(d)ionic strength.Where the Ug for each condition in(a),(c),(d)is 0.01105 m·s-1,the Ul for each condition in(a),(b),(d)is 0.01658 m·s-1.The Na2CO3 concentration for each condition in (b), (c), (d) is 0.5 mol·L-1.
As shown in Fig.6(a), the size distribution of the bubbles is moving overall towards smaller sizes as the concentration of the solution increases.It can be seen that the bubble size at 0.05 mol·L-1of Na2CO3solution is the critical concentration where macroscopic bubbles and microbubbles co-exist, and the overall distribution is more uniform at all sizes.However, when the concentration of Na2CO3is increased, there is a sudden change in the size distribution of bubbles,and the proportion of macroscopic bubbles rapidly decreases to all microbubbles.As the concentration increases, the largest fraction of the bubble size gradually moves towards the smaller sizes.The possible reasons for this are essentially the same as those for the change in the Sauter mean diameter of the bubbles.
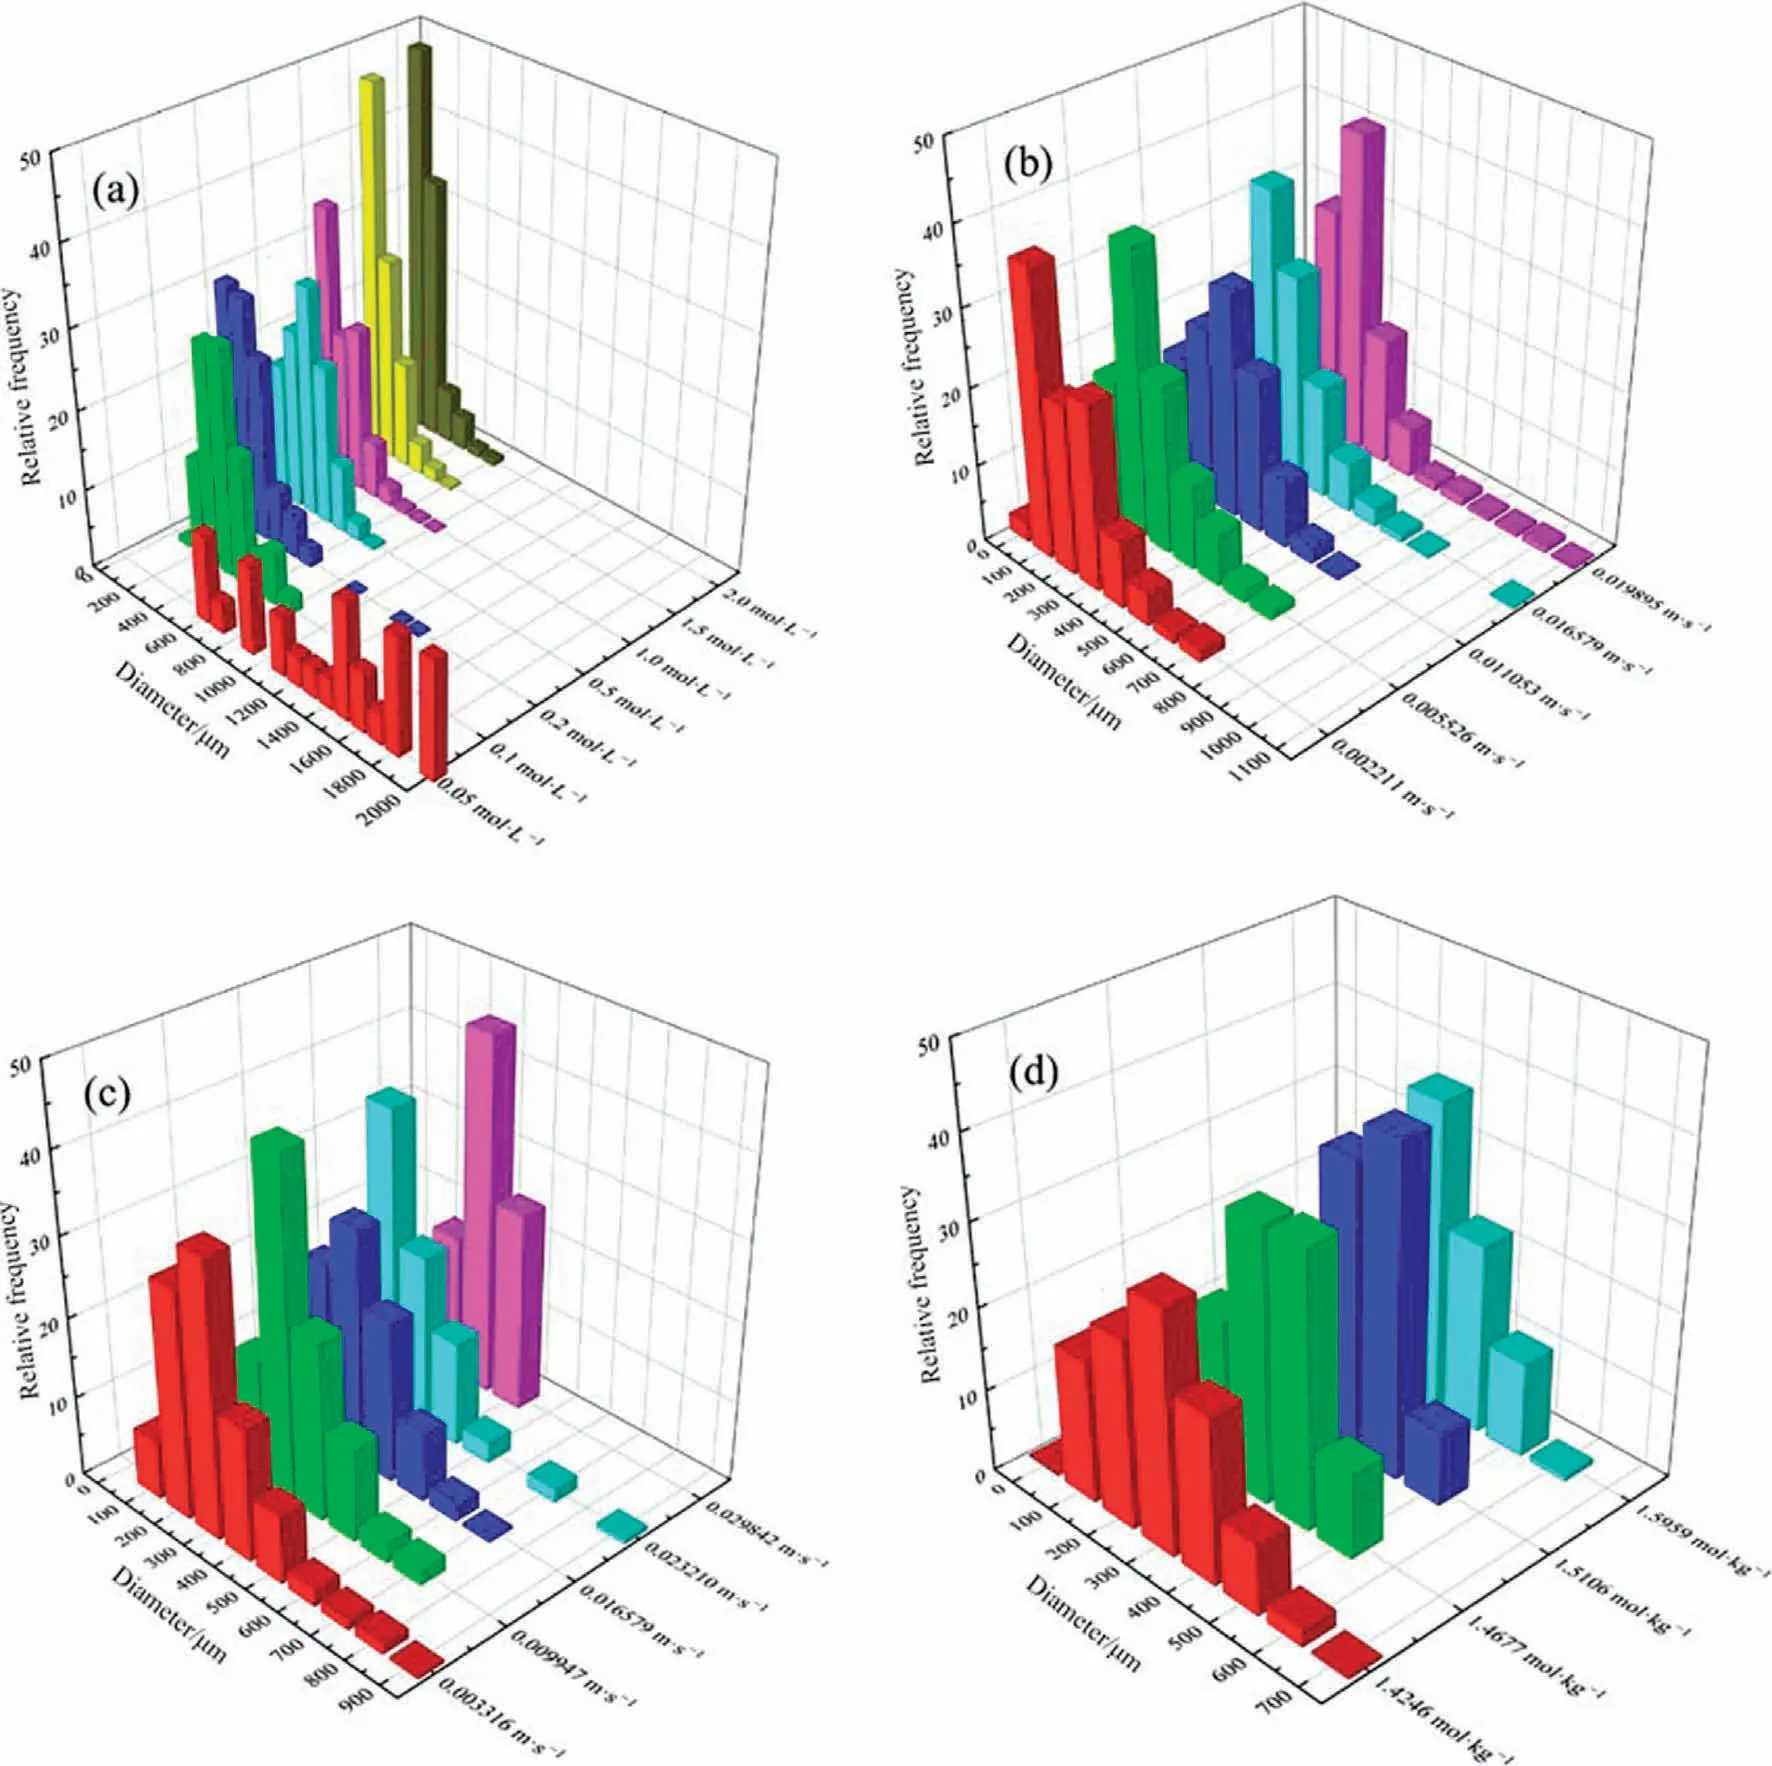
Fig.6.Bubble size distributions(BSD)under different operating parameters in the experiment:(a)sodium carbonate concentration,(b)superficial gas velocity,(c)superficial liquid velocity, (d) ionic strength.Where the Ug for each condition in (a), (c), (d) is 0.01105 m·s-1, the Ul for each condition in (a), (b), (d) is 0.01658 m·s-1.The Na2CO3 concentration for each condition in (b), (c), (d) is 0.5 mol·L-1.
As shown in Fig.5(b), the Sauter mean diameter of the bubbles increases rapidly with increasing superficial gas velocity.As shown in Fig.6(b), the bubbles as a whole appear macroscopically large with increasing superficial gas velocity, which is the reason for the rapid increase in the Sauter mean diameter at high superficial gas velocity operating conditions compared to low superficial gas velocity operating conditions.The reason for this phenomenon may be, on the one hand, the increase in superficial gas velocity and the influx of the gas mixture into the reactor, which leads to some of the microbubbles merging into larger bubbles due to the increased probability of collision between them.On the other hand, the influx of CO2may be due to the limited uptake of the Na2CO3solution,which causes limited collapse of the original bubbles and still leaves a large amount of unreacted CO2in the bubbles compared to the low superficial gas velocity.
As shown in Fig.5(c), the Sauter mean diameter of the bubbles gradually decreases as the superficial liquid velocity increases.As shown in Fig.6(c),the bubbles as a whole move towards the smallest size as the superficial liquid velocity increases, and the macroscopic large bubbles also gradually decrease to all microbubbles.The reason for this phenomenon is, on the one hand, that as the superficial liquid velocity increases, the Reynolds number increases and the entire liquid phase is in a turbulent state [66],with each micro-turbulent cluster having transverse pulsed motion in addition to pump-up motion and motion in the opposite direction to the main body.This allows the macroscopic large bubbles to be sufficiently re-broken by each micro-turbulent cluster,while the high-speed circulation of the Na2CO3solution allows the CO2within each bubble to react sufficiently, accelerating the process of bubble collapse into micro-bubbles.
To distinguish the effects of Na2CO3concentration and ionic strength in Na2CO3solution,different concentrations of NaCl were added to each condition to vary the ionic strength of each condition,provided that the temperature,pressure,superficial gas velocity, superficial liquid velocity, and Na2CO3concentration were all the same.As shown in Fig.5(d), the Sauter mean diameter of the bubbles decreases as the ionic strength increases.As shown in Fig.6(d), the larger the ionic strength, the more the bubble size as a whole favors the small size direction, and at the same time,the proportion of microbubbles becomes larger.The possible reason for this is, on the one hand, the increase in viscosity leading to an increase in shear stress on the bubbles, causing the macroscopic bubbles to stretch and deform and break into microbubbles.On the other hand,it may be that the increase in ζ-potential on the bubble surface [64] inhibits the aggregation of microbubbles.
It has been reported in the literature [36,50] that temperature changes also affect the size of the bubbles,but the effect is not significant.This is probably due to the counterbalance between the expansion of the gas with increasing temperature and the faster collapse of the bubbles due to the increased absorption rate of Na2-CO3.However,the increase in temperature reduces the solubility of CO2in the Na2CO3solution,thus reducing the effect of CO2absorption and increasing the economic cost.The reaction temperature was therefore chosen to be 303.15 K.
In addition,the course of the reaction also affects the size of the bubbles.As shown in Fig.7(a), the Sauter mean diameter of the bubble increases and then decreases as the reaction proceeds.The fraction of bubbles with the highest size also gradually moves towards the larger size first and then towards the smaller size, as shown in Fig.7(b).The reason for this phenomenon may be the result of competing factors such as the viscosity of the reaction solution, surface tension, and ionic strength.
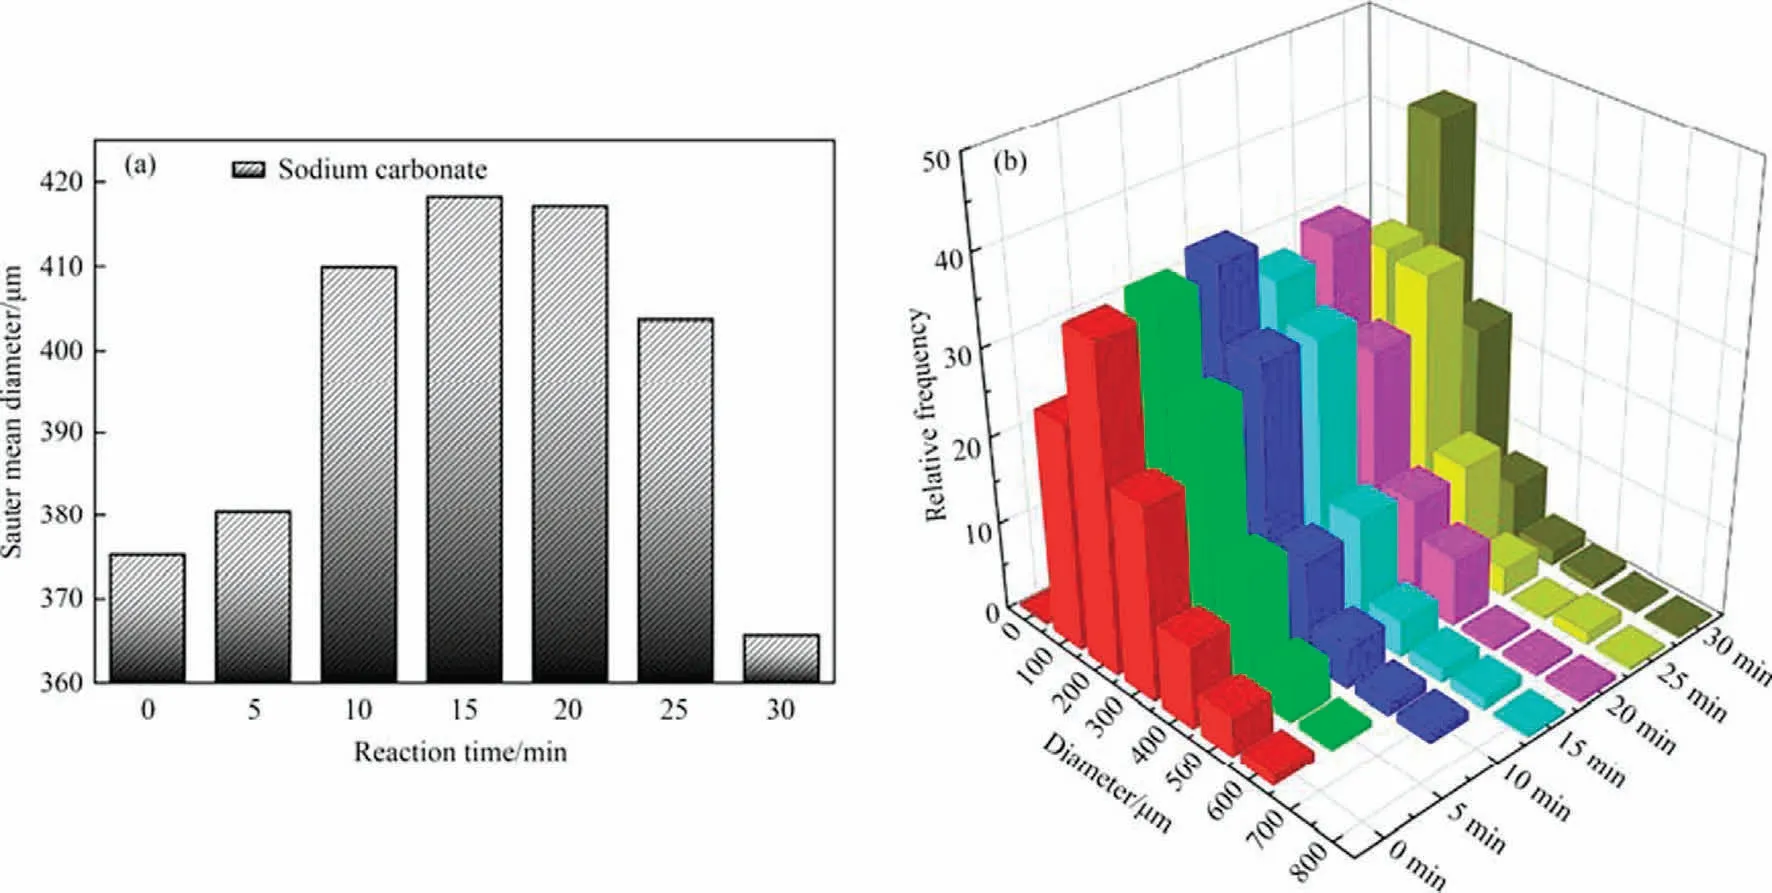
Fig.7.Effects of reaction process on d32 and bubble distribution:(a)effect of reaction time on d32,(b)effect of reaction time on BSD.The gas composition for this condition is 20% CO2, the temperature is 303.15 K, the pressure is 101.325 kPa, the Ug is 0.01105 m·s-1, the Ul is 0.01658 m·s-1 and the Na2CO3 concentration is 0.5 mol·L-1.
3.2.Gas holdup
The main factors influencing the gas holdup are the physical properties of the gas and liquid itself and the operating parameters.The gas holdup produced by different gases in the same liquid is often not the same due to solubility etc.The physical properties of the different liquids themselves, such as foaming properties,can also greatly affect the gas holdup.Most systems containing surfactants have easy foaming properties [67].The main purpose of this experiment is to investigate the effect of experimental parameters on the gas holdup.
As shown in Fig.8(a),the gas holdup increases sharply with the increase of Na2CO3concentration.The reason for this may be that as the concentration of Na2CO3increases,the viscosity of the solution increases and the gas residence time is prolonged, so the gas holdup increases.The reason for the slow increase after reaching a certain concentration (0.5 mol·L-1) may be that the surface tension of the Na2CO3solution increases with the increase in concentration and the bubble size becomes larger, which inhibits the increase in gas holdup to a certain extent.As shown in Fig.8(b),the gas holdup increases almost linearly with increasing superficial gas velocity, apparently because of the increase in the amount of gas passed into the reactor.As shown in Fig.8(c), the gas holdup increases first with increasing superficial liquid velocity, probably because the high-velocity cycle with increasing apparent liquid velocity allows the CO2gas to be fully absorbed,reducing the bubble size and extending the residence time of the bubbles.The further increase in superficial liquid velocity later forms numerous micro-turbulent clusters, which carried a large amount of gas out of the reactor and shortened the residence time of the gas,eventually leading to a decrease in the gas holdup after reaching a certain peak.As shown in Fig.8(d), as the ionic strength of the reaction solution increases, the gas holdup takes the lead in stabilizing at a certain value,probably due to an increase in viscosity and surface tension, which compete to suppress each other, resulting in a stable gas residence time.The subsequent increase in gas holdup may be due to the increase in viscosity leading to a longer gas residence time overshadowing the increase in surface tension leading to a shorter gas residence time.It has been reported in the literature[36,50]that an increase in temperature also led to an increase in the gas holdup, possibly because an increase in temperature causes the gas to expand, thereby increasing the gas holdup.

Fig.8.Gas holdup under different operating parameters in the experiment:(a)sodium carbonate concentration,(b)superficial gas velocity,(c)superficial liquid velocity,(d)ionic strength.Where the Ug for each condition in (a), (c), (d) is 0.01105 m·s-1, the Ul for each condition in (a), (b), (d)is 0.01658 m·s-1.The Na2CO3 concentration for each condition in (b), (c), (d) is 0.5 mol·L-1.
3.3.Interfacial area
The interfacial area is directly proportional to the gas holdup and inversely proportional to the Sauter mean diameter of the bubble.Therefore the interfacial area is influenced by the competition between these two aspects.As shown in Fig.9(a)and(d),the interfacial area becomes consistently larger as the Na2CO3concentration and ionic strength increase.The probable reason for this is that the increase in Na2CO3concentration and ionic strength leads to an increase in gas content as well as a decrease in the Sauter mean diameter of the bubble, so the interfacial area is also increased.As shown in Fig.9(b), the interfacial area also keeps increasing as the superficial gas velocity increases.This may be because the increase in superficial gas velocity leads to an increase in the gas holdup and the Sauter mean diameter of the bubble,but the gas holdup dominates and the rate of increase in gas holdup is greater than the rate of increase in the Sauter mean diameter of the bubble,so the interfacial area also increases.As shown in Fig.9(c),the interfacial area increases and then decreases as the superficial liquid velocity increases, with a maximum value of roughly 0.02321 m·s-1.The possible reason for this is that the gas holdup first increases and then decreases as the superficial liquid velocity increases, while the bubble Sauter mean diameter keeps decreasing and reaches a peak exactly at 0.02321 m·s-1.In addition, the literature[36,50]report that increasing temperature also increases the interfacial area for the same reason as described above.It is thus clear that the size of the reaction interfacial area can be achieved by changing the solution properties and operating parameters.
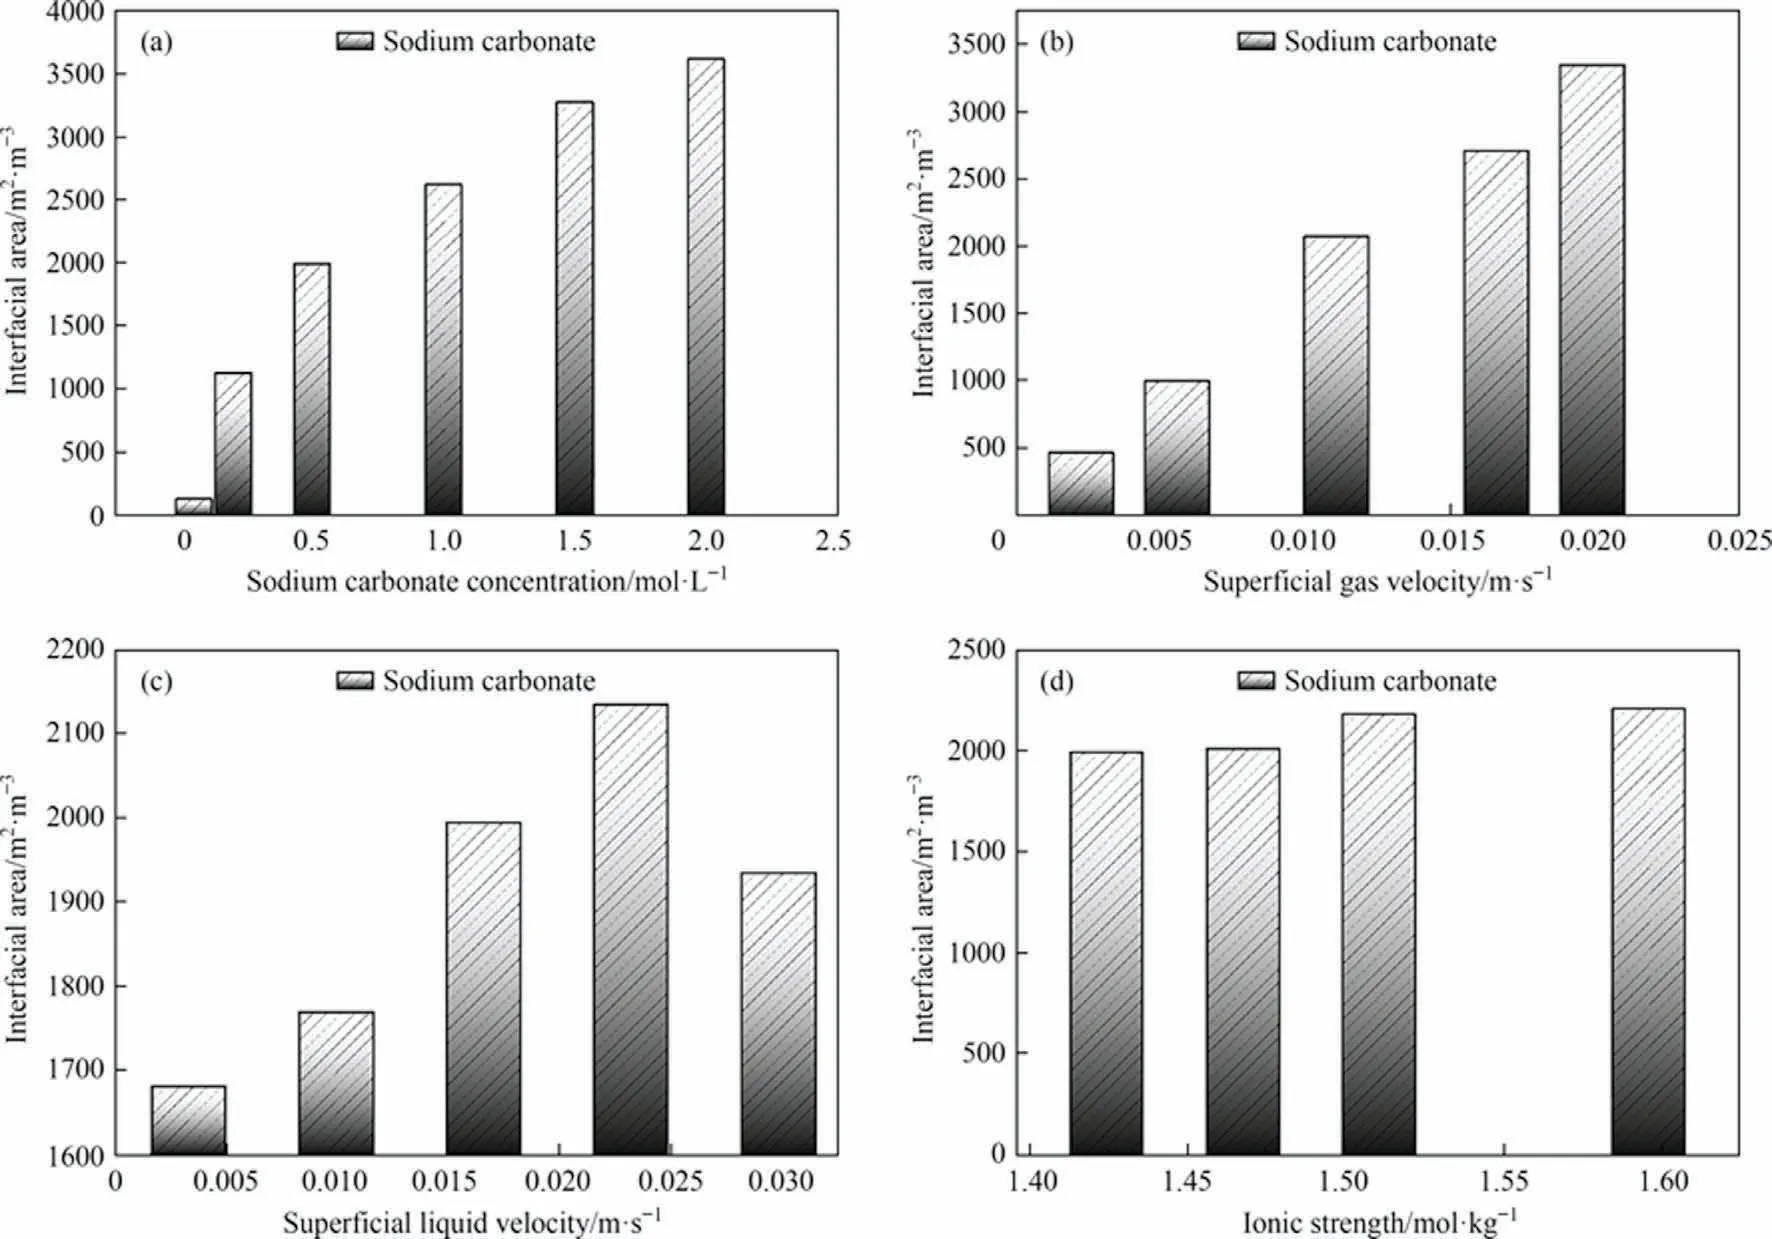
Fig.9.The interfacial area under different operating parameters in the experiment: (a) sodium carbonate concentration, (b) superficial gas velocity, (c) superficial liquid velocity,(d)ionic strength.Where the Ug for each condition in(a),(c),(d)is 0.01105 m·s-1,the Ul for each condition in(a),(b),(d)is 0.01658 m·s-1.The Na2CO3 concentration for each condition in (b), (c), (d) is 0.5 mol·L-1.
3.4.Liquid-side mass transfer coefficient and volumetric mass transfer coefficient
The liquid-side mass transfer coefficient kLis an important parameter for measuring how quickly mass is transferred between the gas and liquid phases.The kLof the Na2CO3uptake CO2reaction in a MIR can be calculated from Eq.(13).
The effect of different solution properties and operating parameters on the liquid-side mass transfer coefficient kLis shown in Fig.10.In particular, as shown in Fig.10(a), kLkeeps decreasing as the concentration of Na2CO3increases.The possible reason for this is that mass transfer is already rapid at the initial concentration,but the amount of CO2gas does not increase as the concentration increases.Originally,one equivalent of carbonate absorbs one equivalent of CO2, but the increase in carbonate causes multiple equivalents of carbonate to compete for one equivalent of CO2,affecting the mass transfer coefficient.As shown in Fig.10(b), kLkeeps decreasing as the superficial gas velocity increases.The possible reason for this is similar to the above, as the CO2gas volume increases, the Na2CO3concentration does not increase, but the increase in CO2leads to multiple equivalents of CO2competing to be absorbed by one equivalent of Na2CO3, affecting the mass transfer coefficient.As shown in Fig.10(c), kLkeeps increasing as the superficial liquid velocity increases.The probable reason for this is that the reaction fluid becomes increasingly turbulent with pump fugacity and large numbers of micro-turbulent clusters inside, which mix fully with the lateral pulse motion and increase the mass transfer coefficient.As shown in Fig.10(d), kLkeeps decreasing as the ionic strength increases.This is probably due to the simultaneous increase in viscosity and surface tension of the reaction solution.The increase in viscosity prolongs the residence time of the bubbles, but the increase in surface tension increases the possibility of bubble aggregation, thus reducing the mass transfer coefficient.
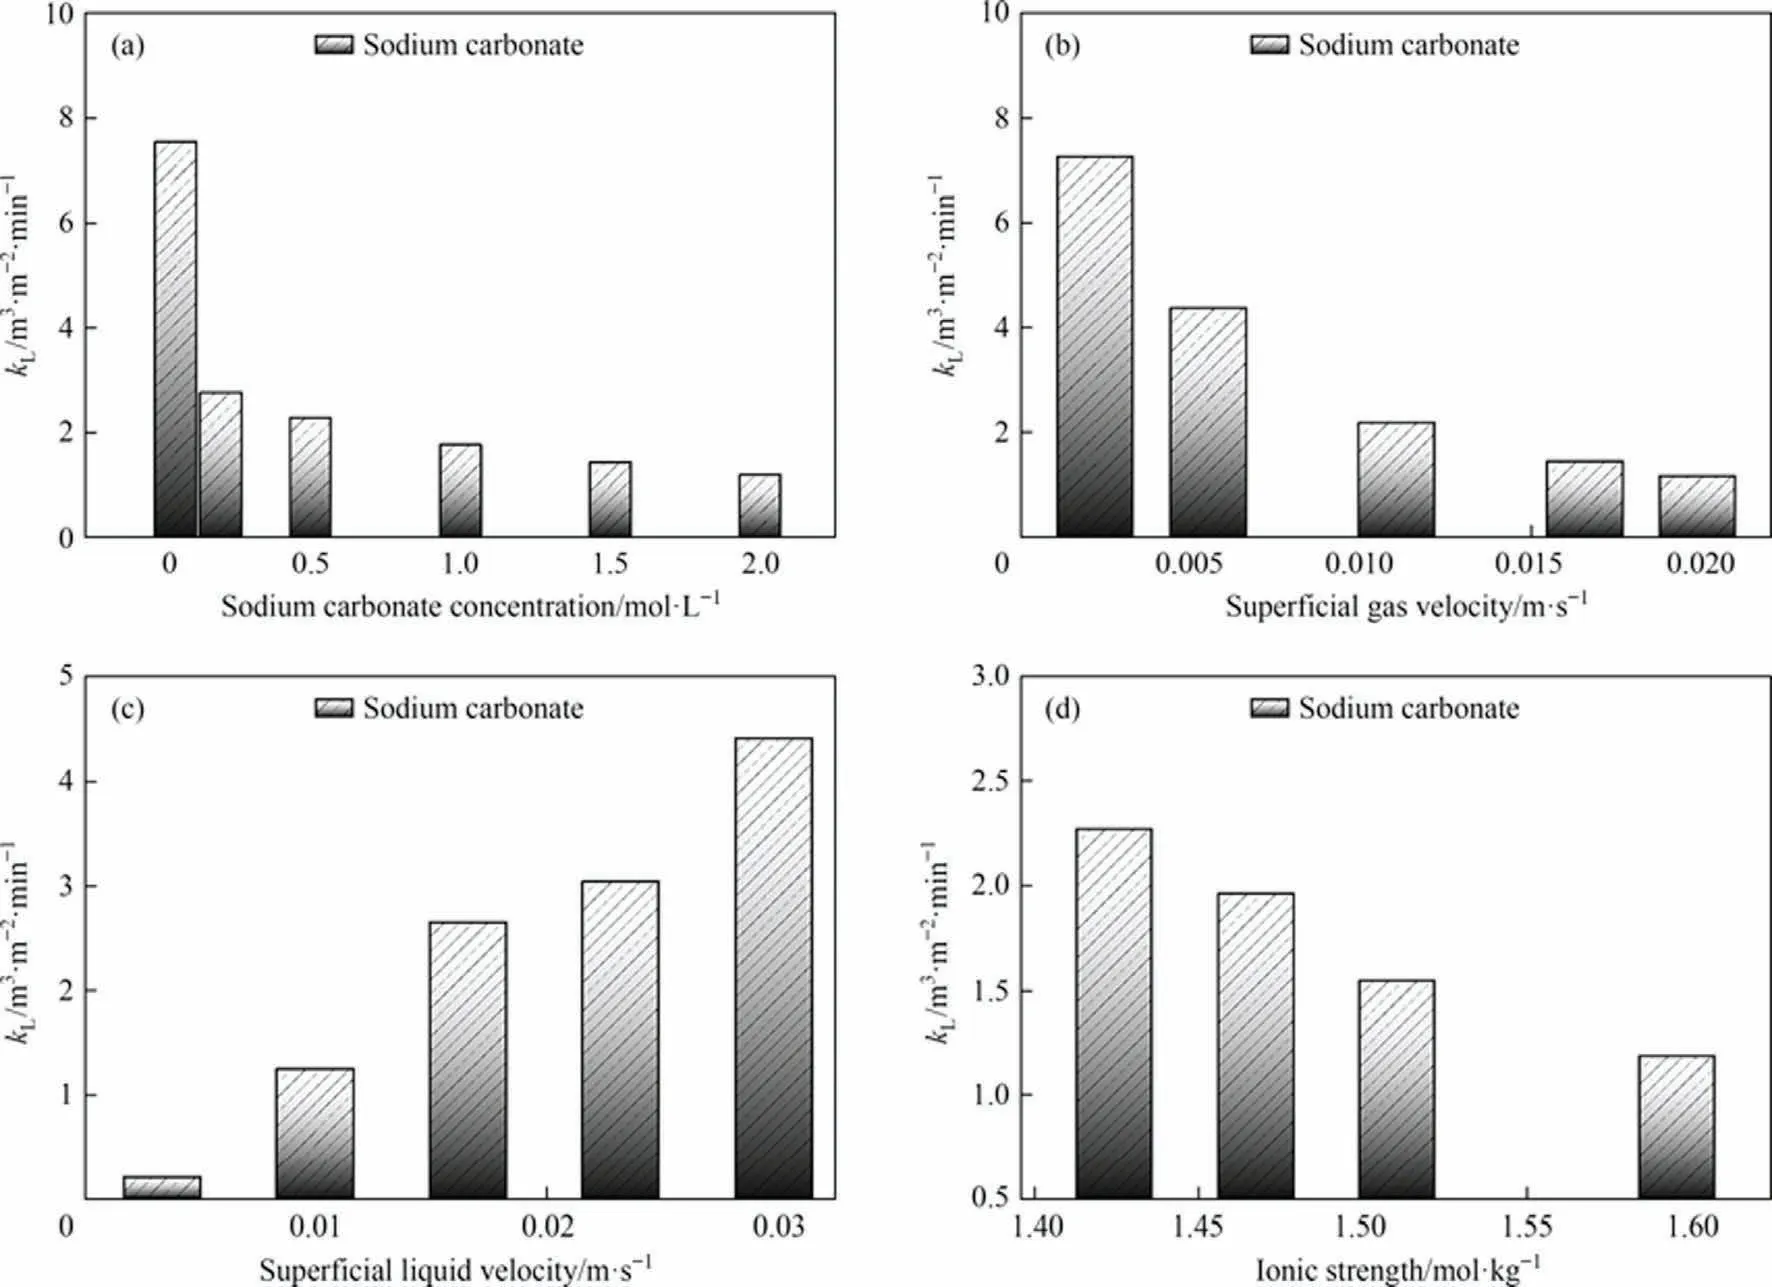
Fig.10.Liquid phase mass transfer coefficient kL under different parameters in the experiment:(a)sodium carbonate concentration,(b)superficial gas velocity,(c)superficial liquid velocity, (d) ionic strength.Where the Ug for each condition in (a), (c), (d) is 0.01105 m·s-1, the Ul for each condition in (a), (b), (d) is 0.01658 m·s-1.The Na2CO3 concentration for each condition in (b), (c), (d) is 0.5 mol·L-1.
Because the interfacial area a is not easily measured in industry,the introduction of the liquid-side volume mass transfer coefficient kLa is a guide to the design scaling of equipment and the selection of working conditions[55].The effect of different solution properties and operating parameters on the liquid-side volume mass transfer coefficient kLa is shown in Fig.11.In particular, as shown in Fig.11(a),kLa increases almost all the time with increasing Na2-CO3concentration.The reason for this may be that the enhancement of the mass transfer effect by the increase in interfacial area fills the weakening of the mass transfer effect by the decrease in kL.As shown in Fig.11(b),kLa increases and then decreases with increasing superficial gas velocity.The possible reason for this is the competing relationship between the interfacial area a and the liquid-side mass transfer coefficient kL, with a kLa maximum, the point at which mass transfer is most effective at the superficial gas velocity.As shown in Fig.11(c), kLa keeps increasing as the superficial liquid velocity increases.The possible reason for this is similar to the reason for kLgetting larger all the time, both are the formation of turbulence.As shown in Fig.11(d), kLa keeps decreasing as the ionic strength increases.The possible reason for this is that the weakening effect of decreasing kLon the mass transfer effect is greater than the effect of increasing interfacial area a on the enhanced mass transfer effect.
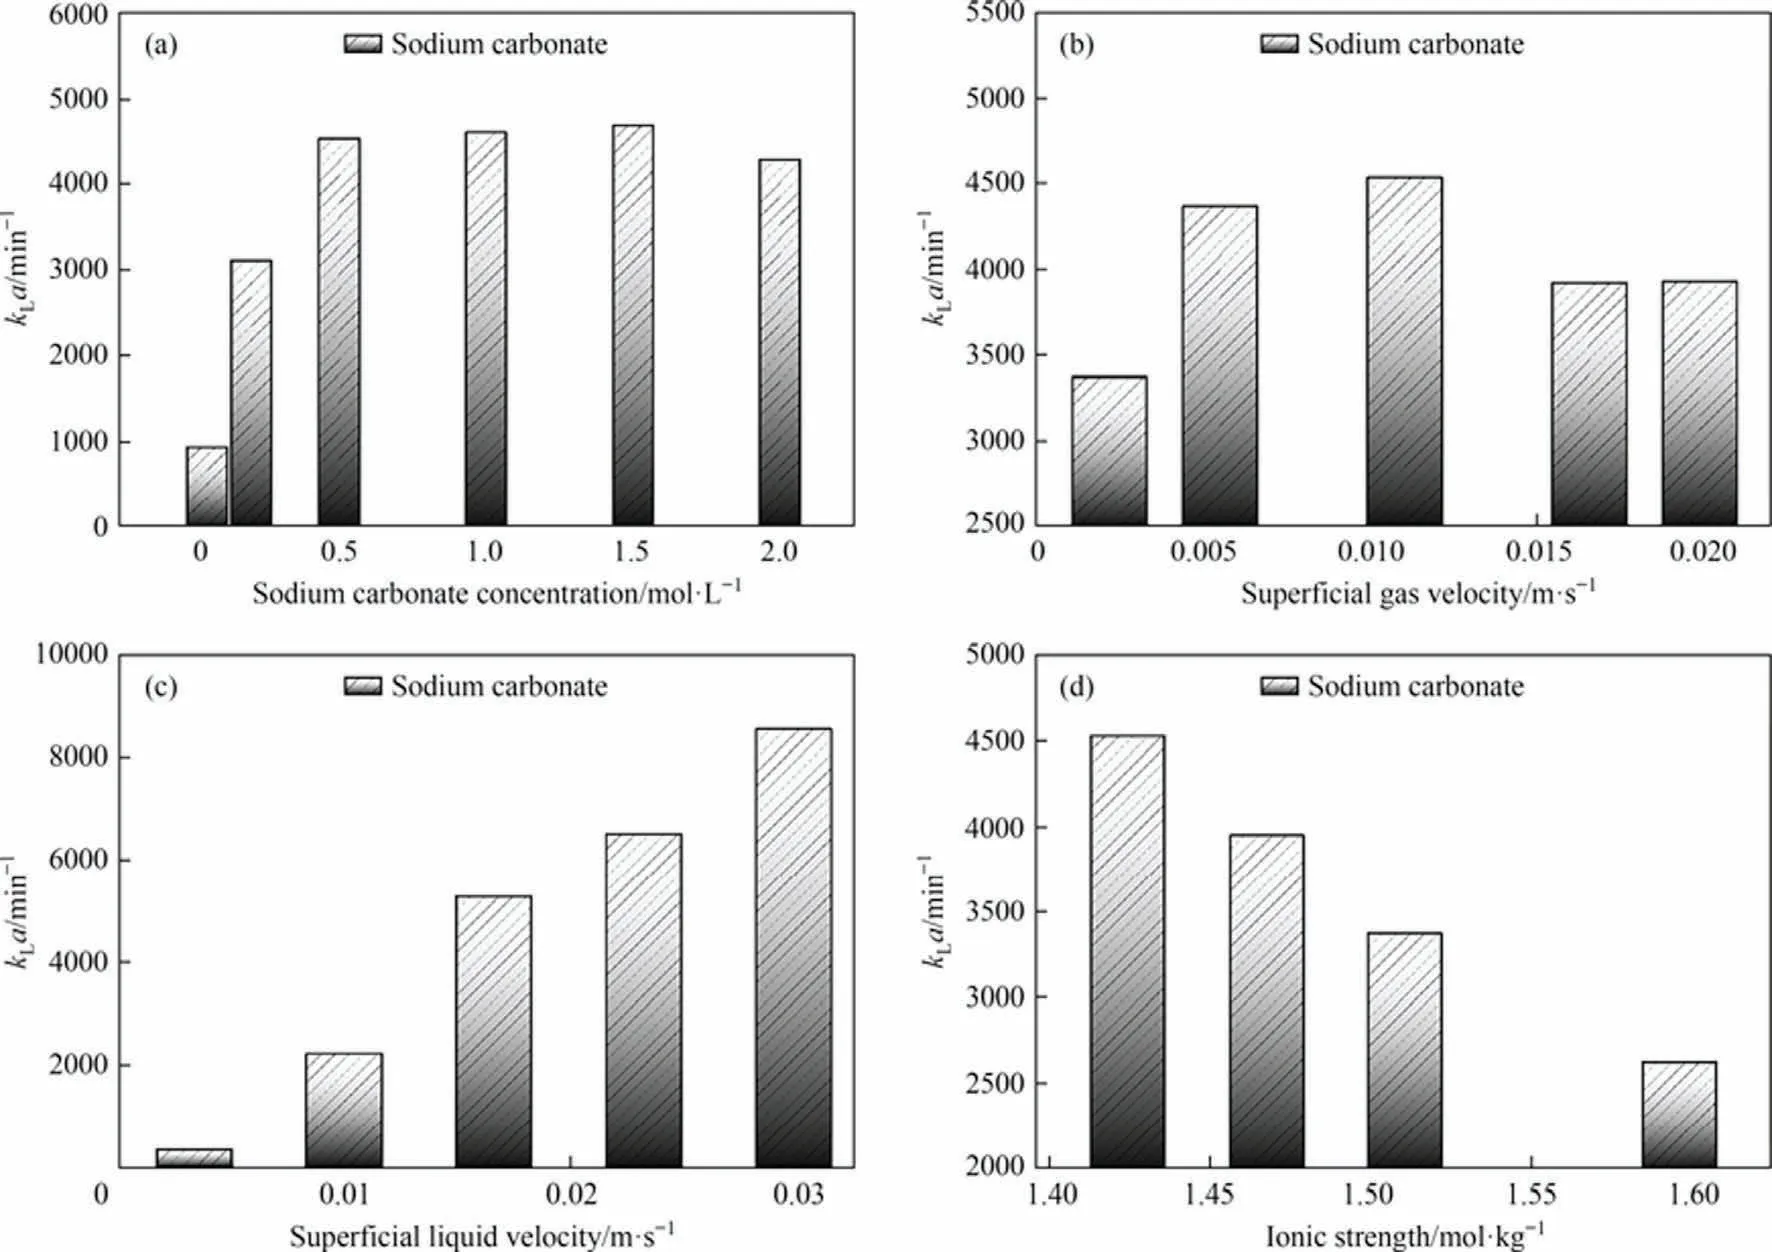
Fig.11.Liquid-side volume mass transfer coefficient kLa: (a) sodium carbonate concentration, (b) superficial gas velocity, (c) superficial liquid velocity, (d) ionic strength.Where the Ug for each condition in(a),(c),(d)is 0.01105 m·s-1,the Ul for each condition in(a),(b),(d)is 0.01658 m·s-1.The Na2CO3 concentration for each condition in(b),(c), (d) is 0.5 mol·L-1.
3.5.Mass transfer enhancement
To demonstrate that the MIR really facilitates the mass transfer of CO2,a series of comparative tests were designed.The differences in bubble size d32,interfacial area a,volumetric mass transfer coefficient kLa, and superficial rate of reaction r between the MIR and the BCR under the same working conditions are compared, as shown in Figs.12-15.In this case,the 2 mm hole industrial screen distributor is used in the BCR.
As shown in Fig.12(a), the bubble Sauter mean diameter of both MIR and BCR decrease with increasing concentration, increase with increasing superficial gas velocity, decrease with increasing superficial liquid velocity and decrease with increasing ionic strength, as shown in Fig.12(b)-(d).The bubble Sauter mean diameter of MIR is generally only one-third of that of BCR,and the bubble size are significantly smaller and more uniform and stable.As shown in Fig.13,the interfacial area of the BCR varies little with sodium carbonate concentration, superficial gas velocity, superficial liquid velocity and ionic strength and is much smaller than that of the MIR,which could generally increase the interfacial area by 1000% upwards, significantly increasing the gas-liquid contact area and thus enhancing the mass transfer effect.As shown in Figs.14 and 15, the volumetric mass transfer coefficients and superficial reaction rates of the MIR and BCR do not vary exactly with the solution properties and operating parameters, and it can be seen that the MIR can change the location of the optimum working conditions of the system and generally enhance them by more than 100%.This shows that MIR can indeed facilitate the mass transfer of CO2and thus increase the superficial reaction rate of the reaction in terms of the absorption of CO2by Na2-CO3and that MIR may be applied to more non-homogeneous reactions in the future to play a powerful role in industrial production.
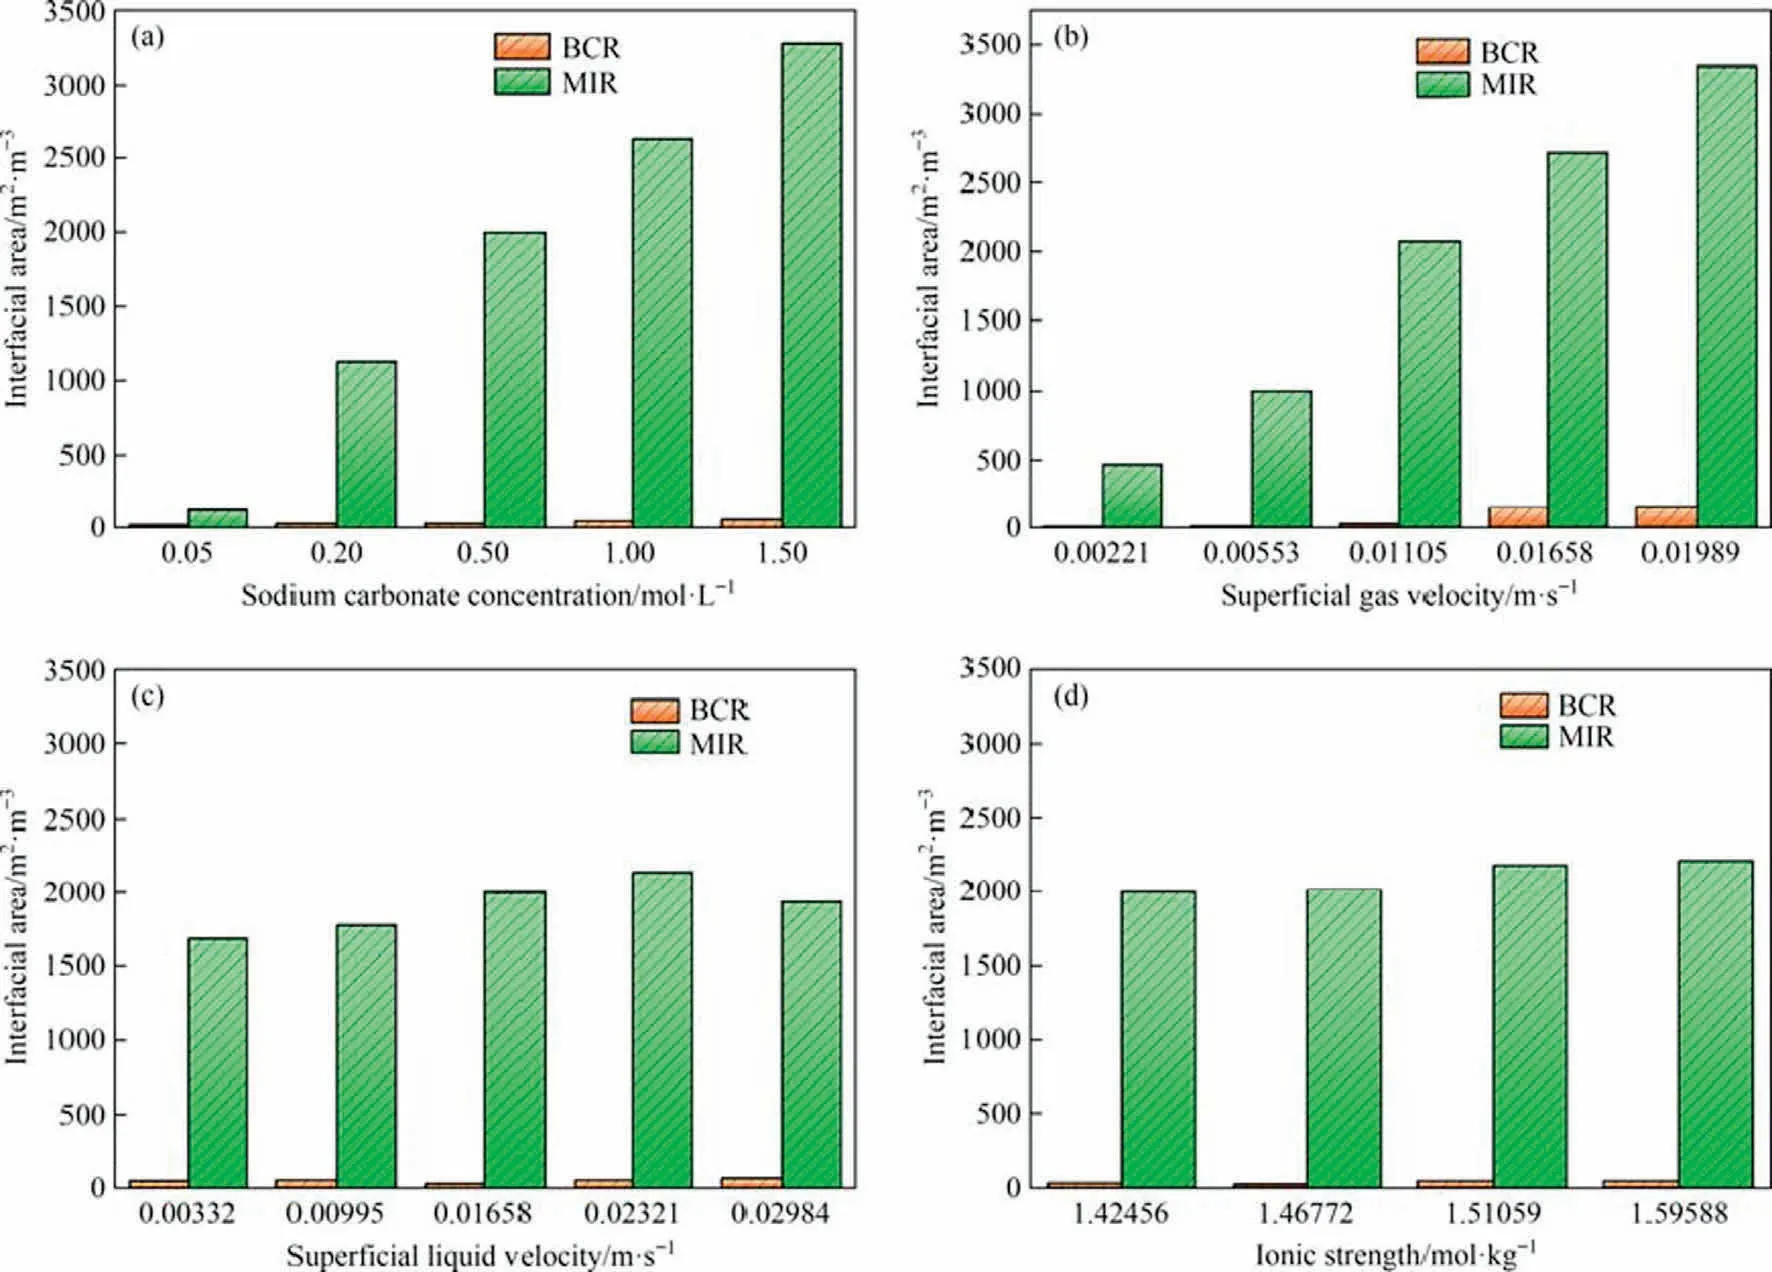
Fig.13.Comparisons of interfacial area between MIR and BCR: (a) sodium carbonate concentration, (b) superficial gas velocity, (c) superficial liquid velocity, (d) ionic strength.Where the Ug for each condition in(a),(c),(d)is 0.01105 m·s-1,the Ul for each condition in(a),(b),(d)is 0.01658 m·s-1.The Na2CO3 concentration for each condition in (b), (c), (d) is 0.5 mol·L-1.

Fig.14.Comparisons of kLa between MIR and BCR:(a)sodium carbonate concentration,(b)superficial gas velocity,(c)superficial liquid velocity,(d)ionic strength.Where the Ug for each condition in (a), (c), (d)is 0.01105 m·s-1, the Ul for each condition in (a),(b), (d) is 0.01658 m·s-1.The Na2CO3 concentration for each condition in (b), (c), (d) is 0.5 mol·L-1.
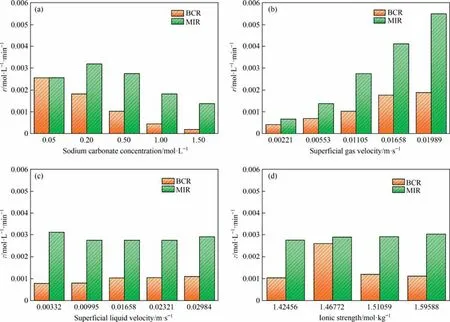
Fig.15.Comparisons of superficial reaction rate between MIR and BCR:(a)sodium carbonate concentration,(b)superficial gas velocity,(c)superficial liquid velocity,(d)ionic strength.Where the Ug for each condition in(a),(c),(d)is 0.01105 m·s-1,the Ul for each condition in(a),(b),(d)is 0.01658 m·s-1.The Na2CO3 concentration for each condition in (b), (c), (d) is 0.5 mol·L-1.
4.Conclusions
For the experiments of Na2CO3solution using MIR to absorb CO2exhaust gas in industry,the size distribution of mixed gas bubbles at the micron scale under different solution properties and operating parameters and the reasons are analyzed in combination with a high-speed camera system and real-time online image analysis software.The mass transfer characteristics of CO2under different solution properties and operating parameters and the effect on the liquid-side mass transfer coefficient kLand the liquid-side volume mass transfer coefficient kLa are investigated and the mass transfer enhancement effects of the MIR and the BCR are compared, leading to the following conclusions.
(1) The size of the bubbles is influenced by the properties of the material itself.Increases in Na2CO3concentration,superficial liquid velocity and ionic strength of the reaction solution result in a smaller bubble Sauter mean diameter and an overall convergence towards smaller bubble sizes.Increases in superficial gas velocity results in a larger bubble Sauter mean diameter.The bubble size is also influenced by the reaction process,which in this experiment is larger and then smaller.
(2) The gas holdup of the MIR has a maximum value under the influence of the superficial liquid velocity but is increasing under the influence of the Na2CO3concentration,the superficial gas velocity,and the ionic strength of the reaction solution.The interfacial area is influenced by the competing bubble Sauter mean diameter and the gas holdup, with an optimum value for the superficial liquid velocity and an increasing value for the Na2CO3concentration, the superficial gas velocity,and the ionic strength of the reaction solution.CO2uptake decreases with increasing concentration, is highest at low superficial gas velocities,fluctuates little with superficial liquid velocity, and increases slowly with ionic strength.
(3) The liquid-side mass transfer coefficient kLis decreasing with all solution properties and operating parameters except for the increasing superficial liquid velocity.This demonstrates the positive effect of the large number of microturbulent clusters formed by increasing superficial liquid velocity on the mass transfer coefficient.The liquid-side volume mass transfer coefficient kLa is increasing with both Na2CO3concentration and superficial liquid velocity, has an optimum value with increasing superficial gas velocity,and instead decreases with increasing ionic strength of the reaction solution.This shows that the working conditions of the experiment do have a non-negligible effect on the mass transfer of the reaction.
(4) Under the same reaction and experimental conditions,the MIR shows a significant increase in the liquid-side volume transfer coefficient kLa and superficial reaction rate compared to a BCR.The MIR has great potential for future applications in the non-homogeneous reaction industry and may one day replace bubble column reactor.
Declaration of Competing Interest
The authors declare that they have no known competing financial interests or personal relationships that could have appeared to influence the work reported in this paper.
Acknowledgements
This work was supported by Natural Science Foundation of Jiangsu Province (BK20210185), National Natural Science Foundation of China (22278202).
Nomenclature
 Chinese Journal of Chemical Engineering2023年12期
- Chinese Journal of Chemical Engineering的其它文章
- Intrinsic kinetics of catalytic hydrogenation of 2-nitro-4-acetylamino anisole to 2-amino-4-acetylamino anisole over Raney nickel catalyst
- Experiments and model development of p-nitrochlorobenzene and naphthalene purification in a continuous tower melting crystallizer
- α-Synuclein: A fusion chaperone significantly boosting the enzymatic performance of PET hydrolase
- Influence of water vapor on the separation of volatile organic compound/nitrogen mixture by polydimethylsiloxane membrane
- Mass transfer mechanism and relationship of gas-liquid annular flow in a microfluidic cross-junction device
- Enhanced photocatalytic activity of methylene blue using heterojunction Ag@TiO2 nanocomposite: Mechanistic and optimization study