
Techno-Economic Comparison of Dual-fuel Marine Engine Waste Energy Recovery Systems
2023-03-01 11:00UgoCamporaTommasoCoppolaLucaMicoliLuigiaMocerinoandValerioRuggiero
Ugo Campora, Tommaso Coppola, Luca Micoli, Luigia Mocerino and Valerio Ruggiero
Abstract Nowadays alternative and innovative energy recovery solutions are adopted on board ships to reduce fuel consumption and harmful emissions.According to this, the present work compares the engine exhaust gas waste heat recovery and hybrid turbocharger technologies, which are used to improve the efficiency of a dual-fuel four-stroke (DF) marine engine.Both solutions aim to satisfy partly or entirely the ship’s electrical and/or thermal loads.For the engine exhaust gas waste heat recovery, two steam plant schemes are considered: the single steam pressure and the variable layout (single or dual steam pressure plant).In both cases, a heat recovery steam generator is used for the electric power energy generation through a steam turbine.The hybrid turbocharger is used to provide a part of the ship’s electric loads as well.The thermodynamic mathematical models of DF engines, integrated with the energy recovery systems, are developed in a Matlab-Simulink environment, allowing the comparison in terms of performance at different engine loads and fuels, which are Natural Gas (NG) and High Fuel Oil (HFO).The use of NG always involves better efficiency of the system for all the engine working conditions.It results that the highest efficiency value achievable is 56% at 50% maximum continuous rating (MCR) engine load.
Keywords Matlab-simulink simulation; Marine dual-fuel engine; Waste heat recovery; Hybrid turbocharger; Energy efficiency; Natural gas;Economic analysis
1 Introduction
Regulators and stakeholders in the maritime sector are intensifying their efforts to reduce greenhouse gas (GHG)emissions from shipping.As consequence, nowadays, the ship propulsion systems design has to fulfil the internation‐al regulations regarding pollutant emissions and the opti‐mizations of the ship management costs.
According to the fourth International Maritime Organi‐zation (IMO) study (IMO 2020), the GHG emissions mainly carbon dioxide (CO2), but also methane (CH4)and nitrous oxide (N2O)), expressed in CO2eqof total shipping (international, domestic, and fishing), have in‐creased from 977 million tonnes in 2012 to 1 076 million tonnes in 2018 (+9.6% increase).The share of shipping emissions in global anthropogenic emissions has increased from 2.76% in 2012 to 2.89% in 2018.On a global scale,the IMO’s goal is to reduce GHG emissions by 40% by 2030 and by another 50% by 2050 (compared to the 2008 level).To achieve these goals, several actions have been and will be undertaken.For instance, the energy efficiency existing ship index (EEXI) was introduced in 2021 and is valid for all vessels over 400 GT under MARPOL Annex VI from 2023 onwards.The index is defined as a function of the ship type, capacity, and propulsion plant and it aims to improve vessels’ energy efficiency as well as to favour the introduction of innovative and green technologies and low or zero-carbon fuels (DNV 2022).Further action was the introduction of the Carbon Intensity Indicator (CII),which is a mandatory measure under MARPOL Annex VI applied to all cargo, RoPax, and cruise ships above 5 000 GT, measures the efficiency of a ship transporting goods or passengers.Over the years, the IMO introduced ever more stringent regulations for the Sulphur and Nitrogen Oxides (SOx, NOx) emitted by marine engines in Emission Control Areas (ECA) (IMO 2003; IMO 2008; IMO 2020).
The use of both alternative energy sources and innova‐tive technologies to increase the energy efficiency of the ships could allow the cutting emissions and improve the ship’s performance (hull resistance and propeller efficien‐cy) (Altosole et al., 2020a; Barreiro 2022).The reduction of emissions can be achieved also by recovering part of the waste energy from the ship’s propulsion engine exhaust gas.For instance, it can be used a Waste Heat Recovery(WHR) steam plant for electric energy production through a steam turbine to satisfy the electric and heat loads of a vessel (Ioannidis 1984; Ito and Akagi 1986;MAN 2005,2010).An interesting methodology of assessing a cogene‐ration system on a ship is proposed and an experiment is conducted to validate the proposed model by Tien et al.2007; results show how the net output of the cogeneration system is larger for a larger mass flow rate and a smaller exit temperature of the exhaust.Dzida (2009) presented a concept of a ship combining a high-power recovery sys‐tem with the main engine, which included a gas power tur‐bine and steam turbine subsystems.Akiliu and Gilani(2010) developed a mathematical model with Matlab to simulate a single-shaft gas turbine-based cogeneration plant with a variable geometry compressor; the effect of several parameters such as temperature, pressure, vari‐able vanes opening, efficiency, and steam generated was studied considering the dynamic thermofluidic behaviour of the components, including the heat exchangers, evapo‐rators, compressors, etc.Dimopoulos and Kakalis (2010)examined the benefits and drawbacks of analysing waste heat and cooling streams by mean value first principal models.In the works of Benvenuto et al.(2014), Choi and Kim (2013), and Grimmelius et al.(2010), different configurations of waste heat recovery systems are de‐scribed, analysed, and compared, in order to find the opti‐mal plant layout.Altosole et al.(2014) and Benvenuto et al.(2015) verified that this technology could be also ad‐opted for retrofitting.
The CO2engine emission reduction can be obtained us‐ing low-carbon fuels, such as Natural Gas (NG) in the Du‐al-Fuel (DF) marine engines.The NG also reduces the emissions of other pollutant, which are common in liquid fuels-fed diesel engines (Altosole et al., 2017), by more than 25% for CO2and CO, 85% for NOx, and more than 95% for SOx(up to 100%) and PM.Additionally, marine DF engine emissions can be further reduced by combining DF with WHR steam plants (Altosole et al., 2019, 2020b;Livanos et al., 2014), thus allowing some NG savings.The efficiency benefits of DFs in comparison with Heavy Fuel Oil (HFO) are shown in the literature(Altosole et al.,2018a, b).
As a novelty, the present work considers a Hybrid Turbo Charger (HTC) to be integrated with the WHR of DF ma‐rine engines.It aims to further increase the overall efficien‐cy by producing electric energy through an electric genera‐tor connected to the turbocharger shaft (Altosole et al.2018b, 2021), the additional electric power produced will be used to fulfil part of the vessel electric loads.The inves‐tigation conducted aims to evaluate the engine’s overall ef‐ficiency in the case of the combination of these engine en‐ergy recovery systems, specifically with a common WHR and with a variable layout (WHR-VL), with or without HTC.The paper is structured as follows: Section 2 de‐scribes the methodology used and the different energy re‐covery systems, Section 3 the case study, Section 4 the re‐sults including an economic analysis and Section 5 sets out the main conclusions.
2 Methodology
2.1 WHR steam plant
Generally, two basic schemes are used for marine en‐gine WHR steam plants: single or dual steam pressure lev‐els.Basically, the second allows a better energy recovery(Benvenuto et al., 2015).According to the WHR systems manufacturer (Ioannidis 1984) the temperature of 160 °C is the lowest limit for the exhaust gas coming from the Heat Recovery Steam Generator (HRSG), due to the sul‐phur content in the marine liquid fuels This limit reduces the HRSG’s efficiency, mainly in the WHR dual pressure steam plants, that potentially can achieve bigger energy re‐covery efficiency than the single pressure ones.Since the sulphur content in NG is almost zero, this exhaust gas stack temperature limit cannot be applied thus allowing a potential increase of the HRSG’s efficiency, and then a bet‐ter NG engines-WHR combined plants (NG–WHR) energy conversion efficiency, compared to the Diesel engine-WHR ones.In the DF marine engine WHR, the same plant is used for both the fuels (liquid fuel for Diesel cycle and NG for Otto cycle), which returns in different exhaust gas mass flows and temperatures at the same engine load and speed.A typical WHR steam plant is essentially com‐posed of an HRSG, with an economizer (E) and an evapo‐rator (EV), which feeds a Steam Turbine (ST) to electric production by an Electric Generator (EG).The turbine ex‐haust steam is condensed in a condenser (SCO), from which the saturated water is extracted by a Steam Con‐densing Pump (SCP) and preheated by the Jacket Water(JW) before being sent to the Heat Water Tank (HWT).By the Main Feed Pump (MFP), after being warmed from the turbocharger compressor outlet hot air in the SCaven‐ger (SC), the water is sent to the HRSG economizer (E).The WHR plant layout presented in Figure 1 for singlepressure saturated steam production has been designed and optimized according to(Altosole et al., 2018a, 2022;Benvenuto et al., 2014).

Figure 1 Marine engine WHR saturated steam plant scheme
Starting with the engine exhaust gas temperature and mass flow rate (1g in Figure 1), the main dimensions, the weight and the performance of the overall WHR plant components have been determined by a computer code de‐veloped in MATLAB® environment.The design proce‐dure considers the main equations of the WHR steam plant at the steady-state continuity and energy equation (1) and equation (2):
and the HRSG finned pipes wall overall heat exchange co‐efficient (ke) equation (3):
The heat exchange area (A), required for the HRSG heat exchangers pipes length evaluation is determined using the gas-wall heat exchange balance equation (4) and wallsteam heat exchange equation (5):
In both equations, the temperature differences (ΔTg-wandΔTw-s) are logarithmic mean temperature differences between gas-wall and wall-steam (Benvenuto et al., 2014).A similar procedure is used to design the other steam plant heat exchangers: the condenser, jacket water, and scaven‐ger.The steam turbine is modelled by the typical steadystate non-dimensional mass flow map (Cohen et al., 1987)while the HRSG steam drum and the heat water tank are modelled as simple fluids mixing tanks.
2.2 WHR Variable Layout (WHR-VL) steam plant
A lower saturated steam pressure plant has been added(Figure 2a blue lines) to the WHR single pressure saturated steam plant scheme of Figure 1, which constitutes the HP Economizer and Evaporator of the new (superheater)steam plant (Figure 2a black solid lines).This new WHR plant part is composed of a Low-Pressure Economizer(E LP), an Evaporator at Low Pressure (EV LP), and a Steam Drum at Low Pressure (SD LP).In addition to the WHR-VL high-pressure steam plant (black solid lines in Figure 2a), when the engine runs with NG, the low-pres‐sure plant section (blue lines) is activated by opening the three valves (V1/V2/V3), taking cold water, after the Steam Condensing Pump (SCP), or saturated steam to the Low-Pressure Steam Drum (SD-LP).This solution allows a greater cooling of the exhaust gas in the HRSG low-pres‐sure evaporator and economizer (EV-LP/E-LP).In these HRSG working conditions, the flue Gas Diverter (GD) is positioned so that the High-Pressure Economizer (E-HP)outflowing gases pass through the Low-Pressure Evapora‐tor and Economizer (EV-LP and E-LP).
When the engine is fuelled by diesel oil fuel (Figure 2b),only the WHR high-pressure steam plant (black lines) is activated.The High-Pressure Economizer (E-HP), the last heat exchanger before the stack, is fed with preheated wa‐ter by the Jacket Water (JW) and SC respectively, while ELP and EV- LP (dashed green lines in Figure 2b) are not active with the valves closed.In these conditions, the flue gas diverter is positioned to bypass the E-LP and EV-LP,as consequence, the exhaust gas stack temperature (T4g) re‐mains over the minimum value of 160 °C.
2.3 WHR and WHR-VL steam plants optimization procedure
The VHR-VL plant works normally with the engine powered by NG and only occasionally with diesel oil,therefore, the plant cycle and its components are designed and optimized referring to the engine operating with NG.Specifically, plants’ components (such as HRSG, steam turbine, and condenser) and Rankine cycles parameters(such as pressures, temperatures, and water/steam mass flow rates) are thermodynamically optimized to maximize the combined plant efficiency (ηCP), defined by Altosole et al.(2018b):
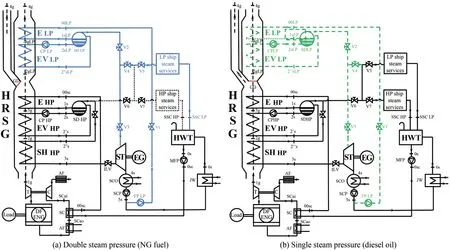
Figure 2 WHR-VL steam plant schemes
where:iis the number of propulsion and diesel generator engines,PDEis the NG and diesel engine power;PMFPis the power of the main feed pump;PSCPis the power of the steam condensing pump;PSTis the steam turbine power;LHVfis the fuel lower heating value, andMfis the fuel mass flow rate.
As reported in (Altosole et al., 2018a; Benvenuto et al.,2014) for both steam plants, the optimization procedure employs a series of constant and variable parameters.As shown in Table 1, in the single-pressure Rankine cycle(WHR plant) the constant variables are the engine exhaust gas temperature and mass flow rate (considered working at 75% MCR load and using NG fuel), condenser pres‐sure, and HP/LP Ship Steam Services (SSS) steam mass flow rates and pressure.The variable parameters (Table 2)are the HRSG SD pressure and pinch point temperature difference (ΔTpp).In addition, in the dual pressure steam plant (WHR-VL) to the above reported fixed parameters are added (Table 1) the new values of the HP SSS steam mass flow rate, the LP SSS steam mass flow rate, and HRSG LP SD pressure (Benvenuto et al.2014).For the WHR-VL plant, the variable parameters are the same as the WHR ones with the addition (Table 2) of the low-pres‐sure pinch point temperature difference (ΔTppLP).The max‐imumηCCvalue is obtained by varying the variable param‐eters according to Table 2 (Altosole et al.2018a; Benvenu‐to et al.2014).
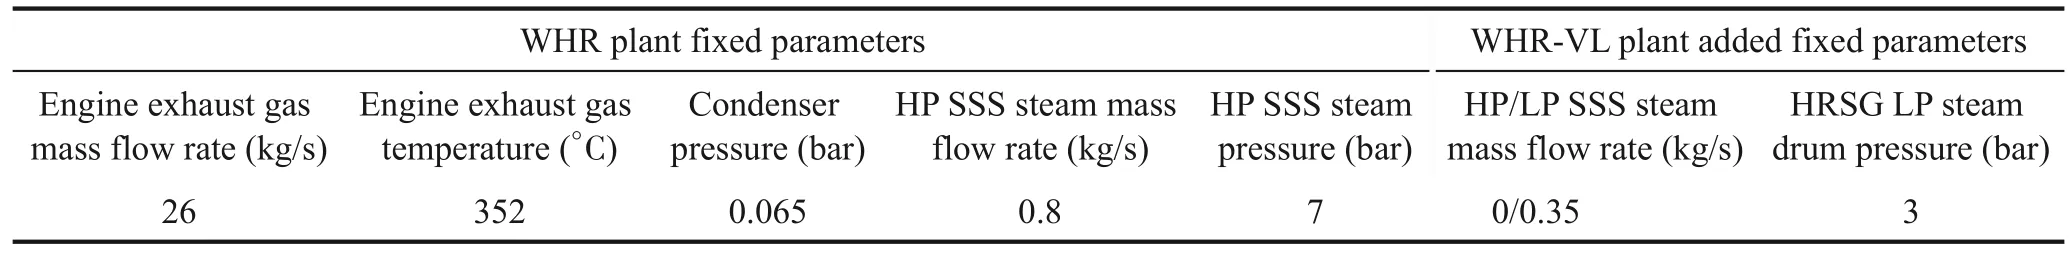
Table 1 WHR and WHR-VL systems Rankine cycle and components design fixed parameters (at 75% MCR load and fuelled by NG)
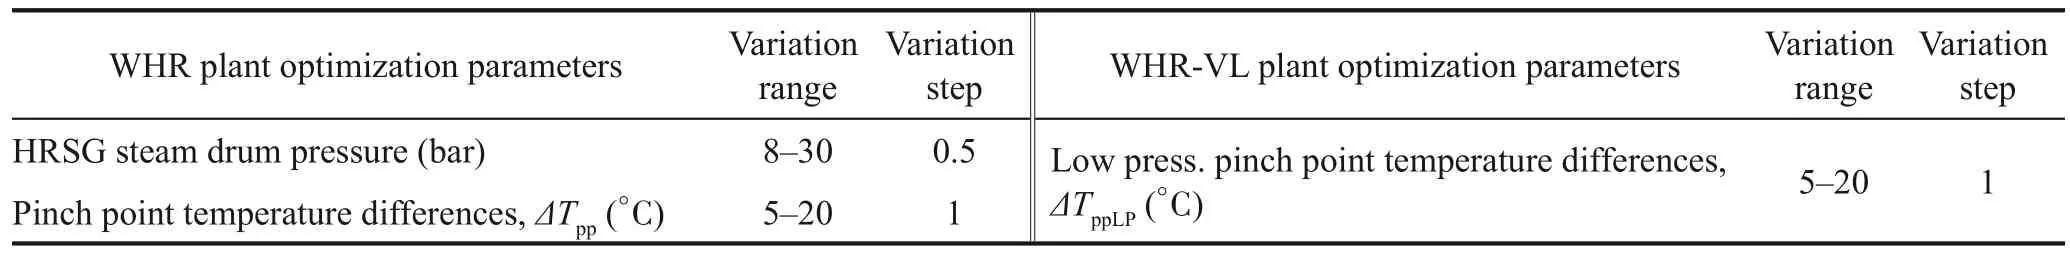
Table 2 WHR and WHR-VL systems HRSG steam plants optimization parameters variation range and step
It must be noted that an important WHR plant optimiza‐tion procedure constraint regards the already mentioned gas stack temperature minimum value, limited to 160 ℃when the engine is fuelled by liquid fuels; with NG this limit is not considered, due to the sulphur absence (Ioanni‐dis, 1984).
By a second numerical code, the engine–WHR (or WHRVL) combined plant performances in off-design load con‐ditions are determined by starting from the new values of temperature and mass flow rate of the exhaust gases com‐ing from the engine, and the plant components’ geometri‐cal design data (i.e., heat exchange surface, pipe section,and wall thickness).An off-design code determines the steady-state plant performance by evaluating the thermal exchanges that occur in each HRSG component.
2.4 Hybrid turbocharger
In the last years, the increase of the marine engine turbo‐chargers’ efficiency resulted in a turbine torque excess,compared to the compressor one, in the medium and highpower engine working conditions.For this reason, a com‐mon practice is to bypass part of the cylinder exhaust man‐ifold gas mass flow rate (about 10–15% in Normal Contin‐uous Rating) to the turbocharger turbine, to reduce the tur‐bine torque (Shiraishi et al., 2010).Recently, an alternative solution is proposed by Mitsubishi Heavy Industries (Ono et al., 2012; Rusman 2018; Shiraishi et al., 2007, 2015)and by the authors Altosole et al.(2018c, 2021).In this so‐lution, called Hybrid Turbocharger (HTC), a high-speed electric motor-generator is integrated with the convention‐al marine engine turbocharger shaft.The additional elec‐tric energy produced could be used to partially fulfil the vessel’s electric load, by controlling electric voltage and frequency through an inverter (Altosole et al., 2018c) thus reducing the diesel generators’ electric power with a con‐sequent reduction in fuel consumption and emissions.
2.5 Engine and TC/HTC simulator
The data necessary for the HTC simulation, mainly re‐garding the turbine, compressor torque, and speed, in de‐sign, and off-design engine operating conditions are not available from the technical datasheet of the engine (MAN 2015).Therefore, a fully thermodynamic mathematical model of DF engines integrated with an HTC system has been developed in a Matlab-Simulink environment (Alto‐sole et al., 2018c; 2021).An overall scheme of the simula‐tor is reported in Figure 3.Specifically, this allows to simu‐late the DF engine equipped with a conventional TC or with an HTC (“Electric Motor-Generator” block in Figure 3) us‐ing NG or liquid fuels (HFO).Each block simulates the pertinent engine component characteristics and perfor‐mances according to applicable algebraic and differential equations, and/or steady-state performance maps, using a filling and emptying simulation approach.Being the en‐gine equipped with variable valve timing opening and clos‐ing for both intake and exhaust valves (Altosole et al.,2018c; Benvenuto et al., 2017) the model can operate in the Miller cycle mode and the intake valve setting varies with engine load and fuel type.The TC is modelled by a typical steady-state performance map of the compressor and turbine while the TC shaft is governed by a typical dy‐namic equation (Benvenuto et al., 2017).The Electric Mo‐tor-Generator (EMG) module has as inputs the required electric power from the Engine Governor(EMG_cs) and the turbocharger speed value (N_TC) from the TC shaft dy‐namics; while the outputs are the electric motor-generator torque (Q’_EM/G) and the delivered electric power (P_el).
The engine model has been fully validated on reference data supplied by the engine manufacturer for several steady-state working conditions (from 25% to 100% en‐gine MCR load conditions of the DF chosen as a case study, see Section 3 (Altosole et al., 2018c; Benvenuto et al., 2017).The comparison shows a good agreement: with the engine operating both in NG and liquid fuel mode, in‐deed, the gap between simulated and reference data (pro‐vided by the engine manufacturer MAN 51/60 DF Product Guide (2015) generally remains less than 2% at high en‐gine loads (85–100% MCR), and than 4% at medium-low engine loads.

Figure 3 Simulink scheme for simulating a marine engine DF integrated with an HTC system
2.6 Economic analysis
Economic analysis has been carried out by evaluating CAPEX and OPEX annual costs (CAPital EXpenditure and OPerational Expenditure) for all the considered sys‐tems (Dotto et al., 2021).CAPEX represents the initial In‐vestment Costs (IC),settled to 25 years, which have been estimated for any system configuration starting from the specific machinery costs (referring to engine MCR power)(Dotto et al., 2021; Livanos et al., 2014; Su et al., 2020;Theotokatos et al., 2020), in Table 3 and according to the following equation (7) (Dotto et al., 2021):
whereRis the discount rate (for the maritime sector as‐sumed equal to 10% (Livanos et al., 2014)),nis the con‐sidered number of years in economic computations.
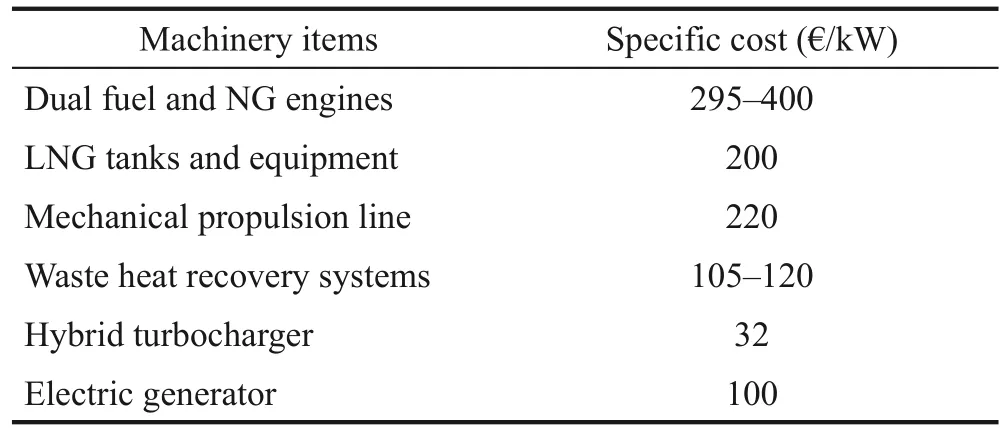
Table 3 Specific machinery costs
Table 4 reports the overall costs of the considered sys‐tems, normalized to the engine cost without energy recovery.
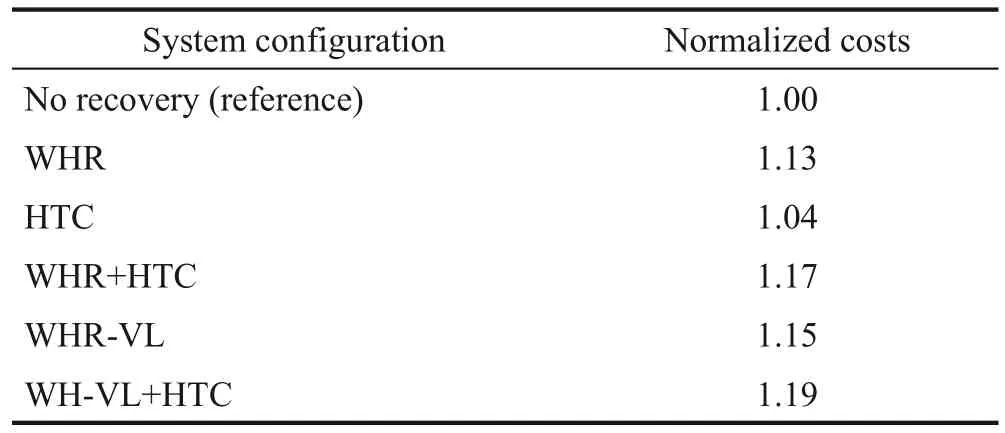
Table 4 Overall systems normalized costs
According to Dotto et al.(2021), OPEX cost is the sum of Annual Fuel Cost (AFC), Annual Lubrification Oil Cost(ALOC), and Annual Maintenance Costs (AMC).For the different system configurations here considered, engines with or without energy recovery systems, cost differences are found only for the AFC and AMC, about the latter, be‐tween the different configurations studied, they differ only about the maintenance costs relating to the WHR and HTC systems, whose specific values considered are: 0.3 M€/year for WHR and WHR-VL systems and 0.1 M€/year for HTC one (Dotto et al.2021).
3 Case study
A mathematical model of the MAN 4-stroke DF (51/60 18V) engine, characterized by an MCR of 17 550 kW of power at 500 rpm (MAN 2015) has been developed as well.In the simulation environment, this engine has been considered for the propulsion of a cruise ferry with an overall length of 211 m, a displacement of 49 257 t, and a max speed of 25.0 knots.For the ship propulsion system,two controllable pitch propellers have been considered,each driven by one DF engine.
The vessel services thermal power needs 0.8 kg/s of sat‐urated steam at 7 bar and 0.35 kg/s at 2 bar (at least).When the NG is used as fuel, to fulfil the ship’s thermal power, only 0.35 kg/s of steam at 2 bar is necessary.
For this application, the MAN DF (51/60 18V) engine’s Normal Condition Rating (NCR) power corresponds to 75% of the MCR (13 162 kW) at 23.1 knots of ship speed(Altosole et al., 2018a).
Figures 4a and b show the engine exhaust gas tempera‐ture and outlet mass flow rate respectively trends accord‐ing to the engine MCR load percentage.It is remarkable the difference in values of the turbine outlet exhaust gas temperature and mass flow rate as function of the fuel and,at different engine loads (Figures 4a and b) (MAN 2015).
The propulsion systems have been compared on the same route: Genoa-Palermo, whose main data are reported in Table 5.
4 Results
A very good agreement between reference and calcu‐lated quantities is observed in Altosole et al.(2018a) as regards of physics and thermodynamic parameters of the WHR plant characteristics (i.e., heat exchangers surface and HRSG pipes number, Rankine cycle thermodynamic fluid data and efficiency).A difference value lower 1% is observed by comparison between calculated and refer‐ence data at design conditions, these lasts are from two similar existing WHR plants which have been modelled with the procedure used in this article; in the off-design engine working these differences are generally less than 4%.
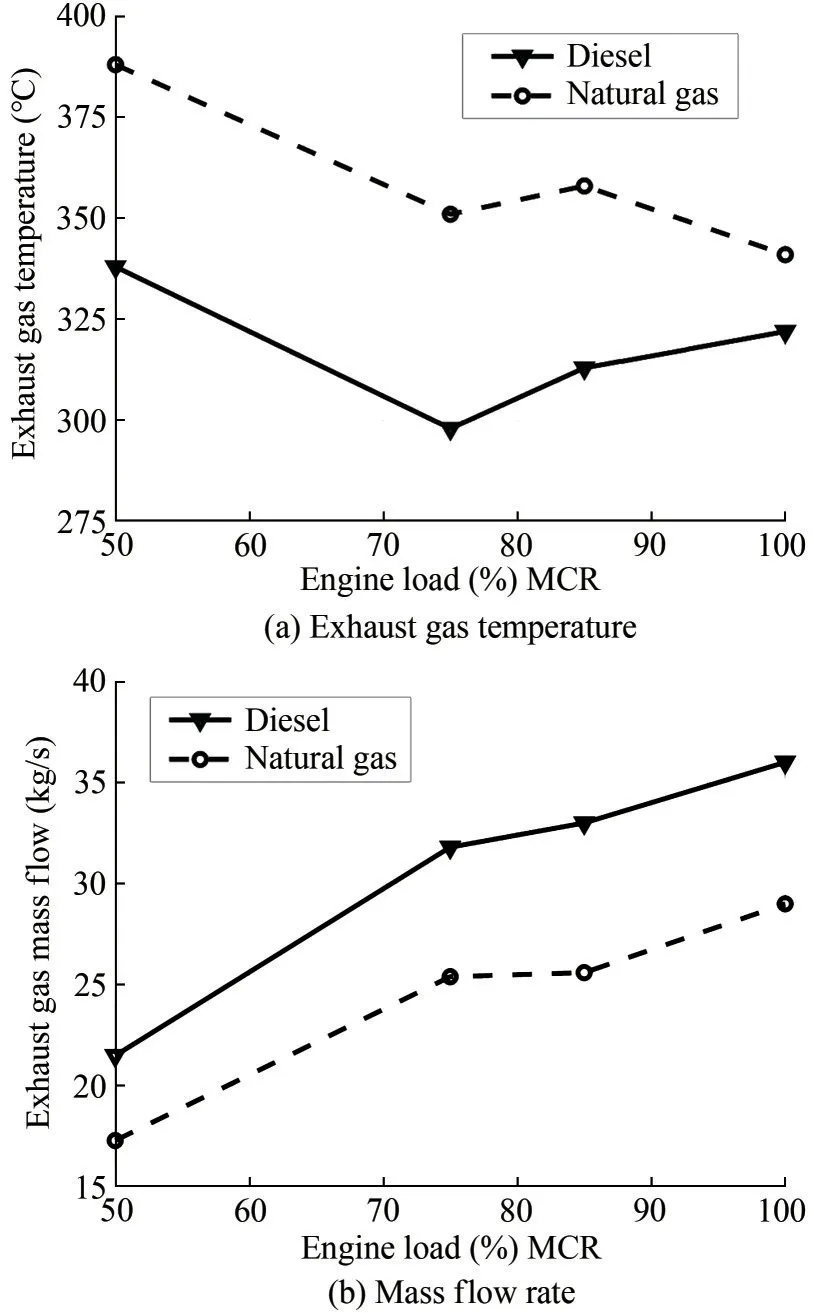
Figure 4 MAN 4-stroke DF (51/60 18V) exhaust gas temperature and mass flow rate as a function of the engine load and fuel (diesel oil: black curves; NG: dotted curves)
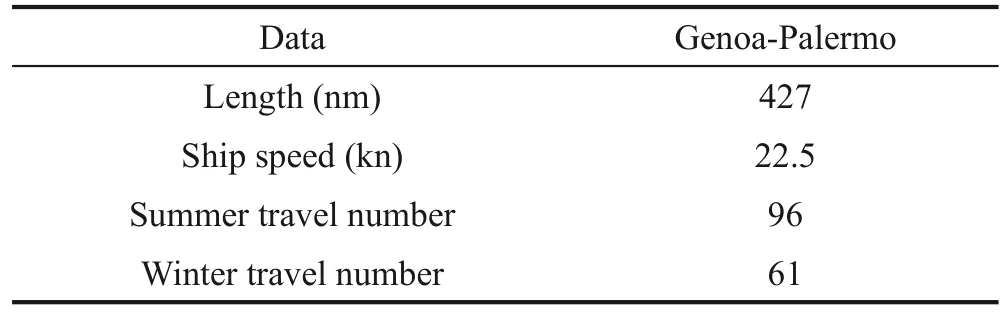
Table 5 Ship route main data
Considering the engine exhaust gas data reported in Figure 5 and the procedure reported in paragraph 2.2.1,the WHR single-pressure steam plant parameters have been evaluated and optimized.Tables 6 and 7 report the main DF-WHR combined plant data, in both WHR de‐sign (NCR condition) and off-design working conditions,with both HFO and NG fuels.In Table 6 and Table 7, the engine efficiency (ηE) is determined according to Benve‐nuto et al.(2017), the efficiency (ηCP) of the DF-WHR combined plant according to equation (6), and the HRSG one (HRSGeff) according to equation (8) (Benvenuto et al., 2014):
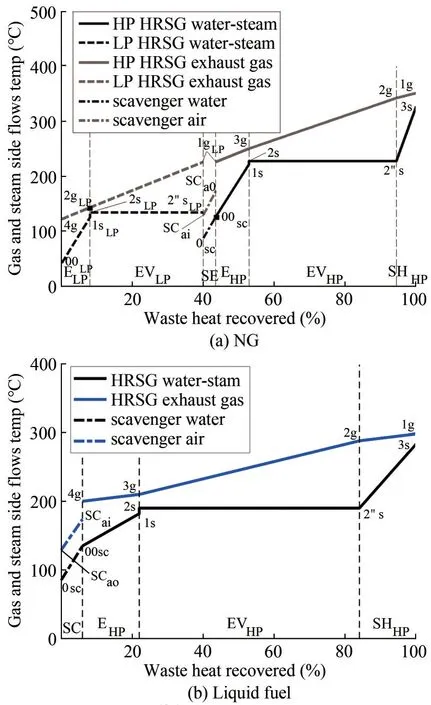
Figure 5 WHR-VL plant HRSG gas-steam temperature profile vs waste heat recovered with engines operating at 75% MCR load and 488 rpm speed

Table 6 DF engine–WHR single pressure combined plant simulator results in design and off-design engine load conditions (Fuel HFO)
where:T1gandT4gare the HRSG inlet and outlet gas tem‐perature respectively andTambis the ambient temperature.
Results of Table 6 show higher values ofηEin the case of the engine-fed NG (in the range of 46.3%–47.5%) com‐pared to HFO (in the range of 44.9%–46.54%) at the sameMCR.The WHR system increases the combined plant(DF-WHR) efficiency (ηCP), between 2.5 and 3.7% in the case of NG, and between 2.2 and 2.7% for HFO.Under the same engine working conditions, the fuelling of NG gives always HRSGeffvalues higher than the case of the HFO; this difference is lowest at 100% engine load(4.2%) and increases up to 15.3% at 50% of engine load.HRSG stack temperature is always equal to or greater than 170 ℃ in the case of HFO, while slightly lower val‐ues (in the range of 148–174 ℃) are found with the engine powered with NG.
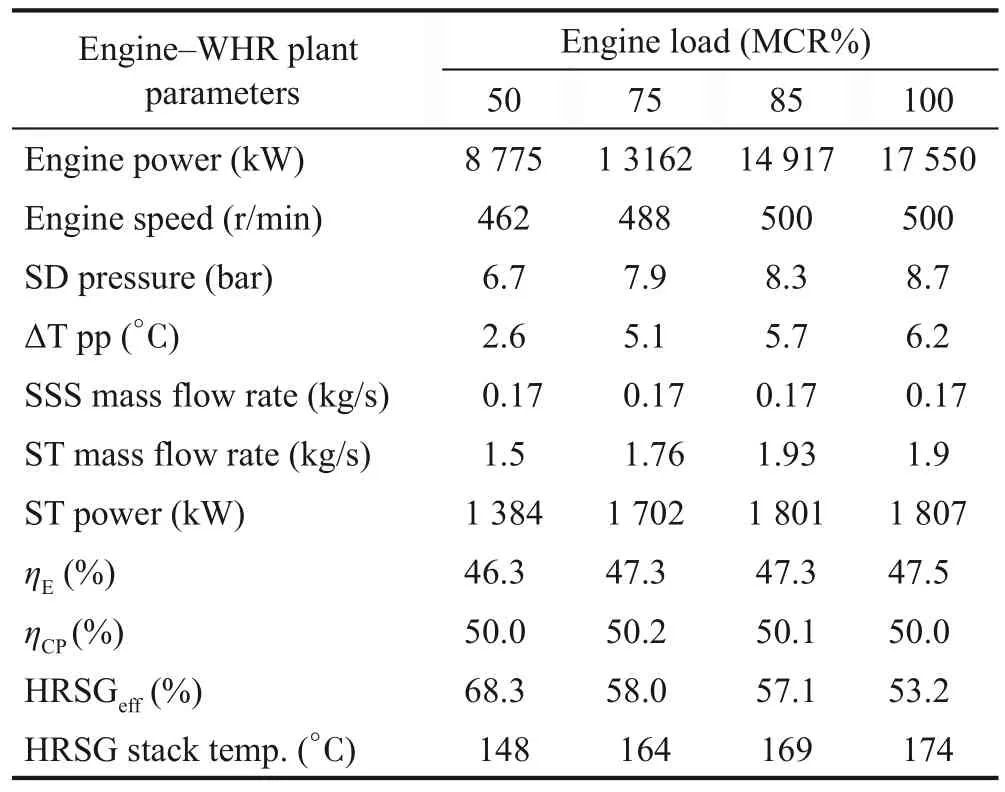
Table 7 DF engine–WHR single pressure combined plant simulator results in design and off-design engine load conditions (Fuel NG)
Figure 5 shows the WHR-VL steam plant the gas and water/steam temperature profile in the HRSG components with the engine running at 75% MCR load and 488 rpm speed, fed with NG and HFO (Figure 5a and Figure 5b, re‐spectively).
It can be seen a better engine exhaust gas waste energy recovery when NG is used as fuel.Moreover, the doublepressure steam plant reduces the HRSG outlet temperature(point 4g in Figure 6a) to a very lower value referring to the single-pressure one (point 4g in Figure 6b).
Figure 6a shows that the NG engine-WHR-VL plant HP steam drum pressure is much greater than the NG engine-WHR one.The steam drum pressure in the WHR single steam pressure plant remains always lower by referring to the WHR-VL plant, both in the case of NG and that of HFO fuels.With these fuels, the pertinent WHR steam drum pressure remains about constant at high and medium engine loads while it increases up to 11.8 bar at lower en‐gines load with HFO.This is essentially due to the necessi‐ty of maintaining the steam pressure not lower than 7 bar,as required by the high-temperature steam service (only when HFO is used).In this case, the SD pressure is gov‐erned by the ILV valve (Altosole et al., 2018b).Figure 6b indicates that, with regards to the HRSG HP pinch point difference temperature, no relevant difference is observed between WHR-VL and WHR steam plants, with the only exception of the WHR-VL plant in the case of engines fed with HFO.In this case, the HRSG HFO-WHR-VL pinch point values are higher varying in the range of 14-19 ℃.

Figure 6 HRSG steam plants SD HP pressure and HP pinch point temperature difference at different engine loads
According to Figure 7a, whit the engines fed by NG and at high engine loads, the WHR-VL plant HRSG efficiency is very high compared to that of the WHR single steam pressure.Furthermore, with the engines fed by HFO, the HRSG efficiency is smaller, particularly in the WHR-VL plant.This is particularly due to the HRSG outlet gas tem‐peratures, which are reported in Figure 7b for different en‐gine loads.The HWR-VL plant is more advantageous with the engines fed by NG; while, referring to the WHR-VL plant, the effect of the low-pressure section deactivation is highlighted when the engines run with HFO.As a general comment, being the same as the WHR steam plant scheme used for the engine fed by NG or HFO, the WHR single steam pressure plant is characterized by a minor difference in the HRSG outlet gas temperature between NG or HFO engine fuel.

Figure 7 HRSG steam plants efficiency and gas outlet temperature at different engine loads
The WHR and WHR-VL plant’s steam turbine mass flow rates trends versus the engine loads, in the case of fu‐elling NG and HFO, are presented in Figure 8.With the en‐gine load reduction, the ST mass flow rate decreases slight‐ly with an engine powered by NG, while a much more con‐sistent reduction can be seen with the HFO.Regarding the WHR-VL plant, in the double steam pressure, with NG as fuel, the HP steam mass flow rate remains nearly constant for all engine loads, while the LP one value almost reduces to about a quarter of its value at 100% MCR engine load when the engine running at 50% MCR.When the engine is fuelled by HFO in the WHR-VL configuration the tur‐bine steam mass flow rate is the lowest among the cases considered, with a little variation at different engine loads.
4.1 Hybrid turbocharger
According to Section 2.5, the simulator has been used to compare the engine performance with HTC as an alter‐native to the original TC.Specifically, the data reported in Table 8 and Table 9 refer to engines using HFO or NG,for different working conditions (100%, 85%, 75%, and 50% of the MCR power).Results show that the electric power recovered by the HTC is 728 kW and 769 kW in the case of HFO and NG respectively at 100% MCR.At engine medium and lower loads, the recovered power in‐creases with the engine fed by NG, while it reduces pro‐gressively with the engine powered by HFO mainly due to the greater NG’s lower heating value compared to that of HFO (49 000 kJ/kg for NG, 42 700 kJ/kg for HFO), the different combustion processes and equivalence ratio (Al‐tosole et al., 2021).

Figure 8 WHR and WHR-VL plants steam turbine mass flow rate vs engine load

Table 9 Simulation results condition for the DF engine with HTC(NG)
4.2 Combined plants comparisons
The electric powers produced by the steam turbine and that by the HTC at different electric loads are reported in Figure 9 for WHR and WHR-VL plants.It is quite evident for the WHR-VL plant the difference between NG and HFO fuels, indicating the highest power production in the case of NG.The steam turbine power difference varies in a range of 1.1 MW and 1.7 MW (at 50% and 75% MCR en‐gine load respectively).The steam turbine electric power difference between the WHR-VL and WHR single steam pressure plants, with both the engines fed by NG, varies between 0.75 MW at 50% and 1.08 MW at 100% engine load, always to the WHR-VL plant’s advantage.Accord‐ing to Figure 9, it should be noted that, with the engine fed by HFO, the WHR steam turbine electric power is always higher than that of the WHR-VL plant, this power differ‐ence is greater at 100% engine load (0.71 MW) and de‐crease almost to cancel itself out to 50% one.With NG fu‐el, the HTC electric power produced (red dash-dot line in Figure 9) is similar to that of WHR, with an opposed trend to engine load variation.With the engine fed by HFO, the HTC electric power undergoes a consistent and approxi‐mately constant decrease as the engine load decreases,from 790 to 146 kW.

Figure 9 WHR and WHR-VL plants ST & HTC electric powers as a function of the engine load
Fuelling NG gives an engine efficiency that is higher than that of HFO (dash-dot black curves in Figure 10a and Figure 10b, respectively).According to Figure 10a, the en‐gine-WHR plant efficiency with NG is higher than the en‐gine alone from 4.1 to almost 5% with the engine load de‐creasing.The engine-WHR-VL efficiency is higher than the engine-WHR one (continuous and dashed black lines respectively), with a WHR-VL plant maximum advantage,referring to the WHR one, near to 2% with the engine run‐ning to 75% MCR load.Using HTC (dotted red line) with NG increases the engine alone efficiency (dash-dot black line) from 2.6 to 4.8% to the engine load decrease.In com‐bination with the WHR and mainly with the WHR-VL plants, the HTC system increases the engine-WHR &HTC efficiency up to 56% (dash-dotted red line) at 50% of engine load (with the NG the HTC provides the maximum electrical power at 50% of the MCR engine load).
Figure 10b shows how with HFO the engine-WHR-VL system efficiency is lower than the system with single pressure WHR (continuous and dash-dot black lines re‐spectively in Figure 10b); this difference is reduced as the engine load decreases.Furthermore, it can be noted that the WHR and WHR-VL plant’s efficiencies vary slightly and have similar values (but with WHR single pressure plant advantage), but these are higher than the efficiency of the engine alone showing a maximum increase of 2.7%at 50% MCR.Figure 10b shows that with HFO fuel the HTC (dotted red line) increases the engine efficiency be‐tween 3% to 1% to engine load decrease; indeed, in spite of what happens with NG, in the case of HFO the HTC electric power decreases with the decrease of the engine load, as reported in Table 5.As a consequence, the engine-WHR & HTC system efficiency improvement decreased from 2.5% to 2%, referring to the engine alone efficiency,to engine load increase (solid red line in Figure 10b).The engine-WHR-VL & HTC system efficiency is slightly less referring to the engine-WHR & HTC one (dash-dotted red line in Figure 10).
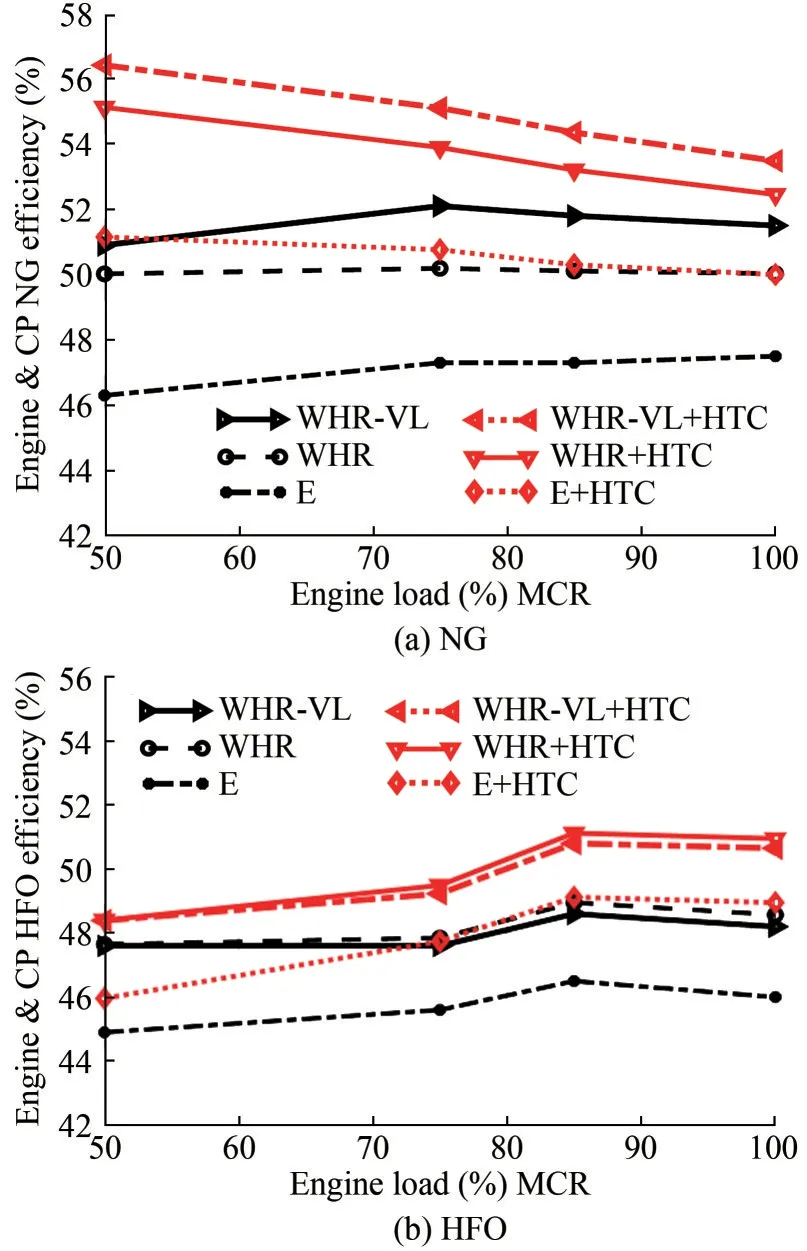
Figure 10 Engine and combined plants efficiency as a function of the engine load for NG and HFO
A comparison with a similar system, a marine DF 4-stroke engine fed with NG with single steam pressure WHR plant, can be made considering the work of Livanos et al.(2014), where it is demonstrated that, within the out‐put engine range from 50 to 100% of the MCR engine load, the engine efficiency of the DF engine with WHR plant increased by 2% (dashed black lines Figure 10a).It should be noted that the efficiency of the engine consid‐ered by Livanos et al.(2014) without a WHR plant is not known.No other energy recovery systems from marine DF engines, comparable with the WHR-VL dual stem pres‐sure system have been found in the literature, particularly in combination with the HTC system.
4.3 Economic analysis
Results of the economic analysis show that the installa‐tion of WHR-VL leads to a slight increase in costs com‐pared to the simple WHR (see Table 4), furthermore the same table shows that the addition of HTC alone alters the cost of the system by very few values.OPEX costs include the sum of annual fuel and maintenance costs (AFC and AMC respectively) (Dotto et al., 2021).AFC is the sum of NG and MDO annual costs while AMC differs (between the considered systems) only for WHR, WHR-VL, and HTC system installation; in particular, the specific annual maintenance costs are 20 €/kW for WHR and WHR-VL systems and 0.4 €/kW for HTC (Dotto et al., 2021).Being DF marine engines almost always used with NG, and only occasionally with HFO, the considered plant’s economic analysis is carried out with reference to the NG only, with a small quantity of Marine Gas Oil (MGO), used for the start ignition in the engine cylinders.Due to the significant marine fuels price variation in these last years, as shown in the literature (Jeong et al., 2018; MAN 2015; MIDAS 2022; Theotokatos et al., 2020; Sharples 2019; Völker 2015) it has been considered two values (Theotokatos et al., 2020) of the fuels price for the economic analysis of the systems: a baseline value referred to the end 2018 (398€/t for NG and 575 €/t for MGO), and a 60% increase price referred the previous one (637 €/t and 920 €/t for NG and MGO respectively).Figure 11 shows the economic comparison of the studied systems in the case of the en‐gine fed with NG, being NG the fuel normally used by DF marine engines, while HFO is used only in case of emer‐gency (such as NG exhaustion).Figure 11a and Figure 11b are related to the baseline fuel prices and the increased ones, respectively.
In Figure 11 the costs of the reference propulsion sys‐tem (NG-engines without energy recovery devices, ‘E on‐ly’) are represented by the solid red zero line.Each other line is obtained as the difference between the annual refer‐ence propulsion system OPEXrefand the same parameter referred to the considered option (OPEXco), multiplying each annual cost by the chosen ship’s lifetime (25 years)equation (9):
In the graphs of Figure 11, the considered options ordi‐nate value at the beginning of the lines (year zero) is deter‐mined by subtracting the considered plant total cost from the reference one.
Referring to the baseline fuel price (Figure 11a), the propulsion system with WHR or HTC (solid black and magenta lines, respectively) allows analogues economic savings, slightly higher for the HTC, this is due to its lower initial plant cost compared to WHR one.Both sys‐tems’ simultaneous use allows greater savings (dotted black line).Employing WHR, HTC, and both energy re‐covery devices, the respective payback times are 4.1, 0.8,and 2.8 years respectively (Figure 11a).The WHR-VL re‐covery system obtains better results referring to the WHR one (green and black solid lines respectively in Figure 11a), thanks to the WHR-VL higher energy recov‐ery efficiency.The same consideration can be done if it is combined the WHR-VL with the HTC system (dotted green line in Figure 11a).In these last two cases, the pay‐back times are 4.4 and 2.6 years, respectively.
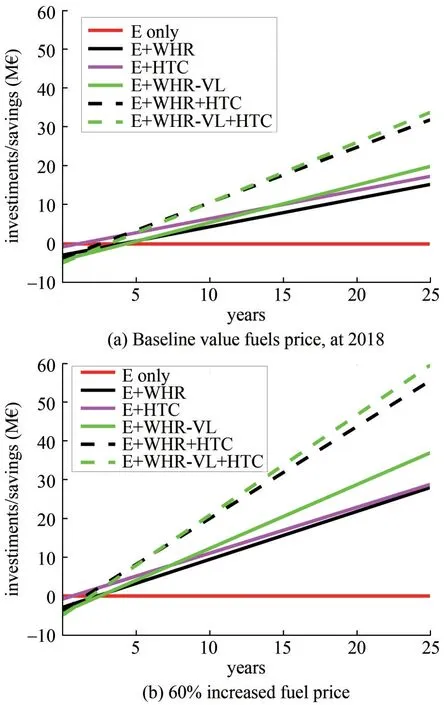
Figure 11 Engine fed by NG, economic comparison for the case study on the route Genoa-Palermo
Comparing Figures 11a and 11b, it results that a high fu‐el price generates a consistent payback time reduction, and above all, a considerable increase in fuel cost savings in the 25 years of the ship’s life, referring to the same heat re‐covery system typology.
5 Conclusions
In this paper, three different energy recovery systems have been considered for the application to a DF fourstroke marine engine to increase the overall energy effi‐ciency: engine exhaust gas WHR and WHR-VL steam plants, which can be employed individually or together with an HTC system.Comparisons in terms of perfor‐mance at different engine loads and with different fuels(NG and HFO) have been carried out, analysing the output results of the engine simulations carried out in the Simu‐link environment.Results indicated that the use of NG al‐ways involves better energy efficiency of the system, com‐pared to HFO, for all the engine working conditions, with or without an energy recovery system.With NG fuel the double steam pressure system (WHR-VL) had higher effi‐ciency than the single pressure one (WHR); in the case of fuelling NG, if the engine load decreased, the HTC elec‐tric power slightly increased, while with engine fed by HFO, the HTC considerably reduced to engine load reduc‐tion.With the engine fed with NG, the simultaneous use of the WHR, or VHR-VL, and HTC systems led to a very high combined system, with NG fuel this efficiency in‐creased as the load decreased; on the contrary, using HFO the efficiency of these combined systems decreased as the engine load decrease.In conclusion, when the engine was fed with NG, the WHR-VL steam plant allowed a better engine exhaust gas waste heat recovery, compared to the WHR single pressure one, the opposite occurred with the engine powered by HFO.Being the DF engines fed mainly by NG, the combination of WHR-VL & HTC systems re‐sulted as the best choice.In the case of diesel engines, the WHR combination with HTC systems was the best solu‐tion.Finally, the economic analysis, referring NG only,shows that all engine waste energy recovery systems bring a considerable economic benefit in the 25 years of consid‐ered ship operation time.The simultaneous use of the WHR and WHR-VL plants with the HTC one produces a significant increase in ship management cost savings, par‐ticularly in the case of WHR-VL & HTC.
Nomenclature
ACair cooler
AFcompressor inlet air filter
AFCAnnual Fuel Cost
AMCAnnual Maintenance Cost
Aepipe wall external area (m2)
Aipipe wall internal area (m2)
Amlpipe wall logarithm area (m2)
BVbleed valve
Cturbocharger compressor
CAPEXCapital Expenditure
CIICarbon Intensity Indicator
CPevaporator circulating pump
DFDual-Fuel engine
EEconomizer
ECAEmission Control Area
EEXIEnergy Efficiency Existing Ship Index
EGElectric generator
EM/GElectric Motor/Generator
ENGEngine
EVEvaporator
FPFeed Pump
GDGas Deviator
GHGGreen House Gases
HFOHeavy Fuel Oil
HPHigh Pressure
HRSGHeat Recovery Steam Generator
HTCHybrid Turbocharger
HWTHeat Water Tank
hspecific enthalpy (kJ/kg)
heexternal pipeconvective heat transfer coefficient2(kW/(mK))
hiinternalpipeconvective heat transfer coefficient(kW/(m2K))
kwall thermal conductivity (kW/(m K))
ICInvestment cost
ILVIsenthalpic Lamination Valve
IMOInternational Maritime Organization
JWJacket Water
LPLow Pressure
MCRMaximum Continuous Rating
MFPMain Feed Pump
Mmass flow rate (kg/s)
Nshaft speed (r/min)
nNumber of years
NCRNormal Continuous Rating
NGNatural Gas
OPEXOperational Expenditure
PPower (kW)
Q’shaft torque (Nm)
ppressure (Pa)
PPower (W)
RDiscount rate
Reexternal pipe thermal resistance (K/kW)
Riinternal pipe thermal resistance (K/kW)
SCSCavenger
SCOSteam COndenser
SCPSteam Condensing Pump
SDHRSG evaporator Steam Drum
SHSuperHeater
SSCSteam Service Condensing outlet
SSSShip Steam Service
STSteam Turbine
spipe wall thickness (m)
Ttemperature (K), turbocharger turbine
T CTurboCharger
VValve
VLVariable Layout
VTNAVariable Turbine Nozzle Area
WHRWaste Heat Recovery
0sheat water tank outlet
0s CONDsteam condensing pump outlet
0scmain feed pump outlet
00scscavenger water outlet
1gturbocharger turbine outlet
1seconomizer water outlet
2gevaporator gas inlet
2sevaporator water inlet
2’sevaporator steam outlet
3geconomizer gas inlet
3ssuperheater steam outlet, steam turbine inlet
3sdHRSG stean drum steam outlet
4gHRSG gas outlet
4svacuum condenser inlet
5ssteam condensing pump
6sjacket water outlet Subscripts
aAir
ambAmbient
csControl Signal
eExternal
elElectric
EEngine
EM/GElectric Motor/Generator
fFuel
gGas
HPHigh Pressure
iInlet, Internal
LPLow Pressure
MFFuel Mass
oOutlet
sSteam, Signal
ppPinch Point
TTurbine
T CTurbocharger
wWall
Competing interestThe authors have no competing interests to de‐clare that are relevant to the content of this article.
 Journal of Marine Science and Application2023年4期
- Journal of Marine Science and Application的其它文章
- Review of Risk Analysis Studies in the Maritime LNG Sector
- Design and Optimization of an Integrated Power System of Solid Oxide Fuel Cell and Marine Low-Speed Dual-Fuel Engine
- Maritime Energy Transition: Future Fuels and Future Emissions
- Environmental and Economic Evaluation of Dual-Fuel Engine Investment of a Container Ship
- Combustion Analysis of Low-Speed Marine Engine Fueled with Biofuel
- The Potential of Inedible Biodiesel as an Eco-Friendly and Sustainable Alternative Fuel for Marine Diesel Engines in India