
CEMA-LSTM:Enhancing Contextual Feature Correlation for Radar Extrapolation Using Fine-Grained Echo Datasets
2023-03-12 08:59ZhiyunYangQiLiuHaoWuXiaodongLiuandYonghongZhang
Zhiyun Yang,Qi Liu,★,Hao Wu,Xiaodong Liu and Yonghong Zhang
1School of Computer and Software,Engineering Research Center of Digital Forensics,Ministry of Education,Nanjing University of Information Science and Technology,Nanjing,210044,China
2School of Computing,Edinburgh Napier University,Edinburgh,EH10 5DT,UK
3School of Automation,Nanjing University of Information Science Technology,Nanjing,210044,China
ABSTRACT Accurate precipitation nowcasting can provide great convenience to the public so they can conduct corresponding arrangements in advance to deal with the possible impact of upcoming heavy rain.Recent relevant research activities have shown their concerns on various deep learning models for radar echo extrapolation,where radar echo maps were used to predict their consequent moment,so as to recognize potential severe convective weather events.However,these approaches suffer from an inaccurate prediction of echo dynamics and unreliable depiction of echo aggregation or dissipation,due to the size limitation of convolution filter,lack of global feature,and less attention to features from previous states.To address the problems,this paper proposes a CEMA-LSTM recurrent unit,which is embedded with a Contextual Feature Correlation Enhancement Block(CEB)and a Multi-Attention Mechanism Block(MAB).The CEB enhances contextual feature correlation and supports its model to memorize significant features for near-future prediction; the MAB uses a position and channel attention mechanism to capture global features of radar echoes.Two practical radar echo datasets were used involving the FREM and CIKM 2017 datasets.Both quantification and visualization of comparative experimental results have demonstrated outperformance of the proposed CEMA-LSTM over recent models,e.g.,PhyDNet,MIM and PredRNN++,etc.In particular,compared with the second-ranked model,its average POD,FAR and CSI have been improved by 3.87%,1.65%and 1.79%,respectively on the FREM,and by 1.42%,5.60%and 3.16%,respectively on the CIKM 2017.
KEYWORDS Radar echo extrapolation;attention mechanism;long short-term memory;deep learning
1 Introduction
Precipitation nowcasting is to forecast the precipitation intensity at the kilometer level for local areas within a relatively short time range (e.g., 0–2 h) in the future, which is an effective way to predict severe convective weather such as short-term heavy precipitation [1].It can help local meteorological departments make accurate decisions on severe precipitation warnings in time,guiding government sectors in transportation, agriculture, electric power, and other industries to respond in advance, therefore reducing the potential economic losses [2].However, precipitation nowcasting is a challenging task due to the complexity of severe convective weather systems,small spatiotemporal scales and the rapid evolution of the atmosphere and clouds[3].
With the rapid development of weather radars and corresponding techniques in recent years,precipitation nowcasting has become one of the hot investigative spots in the field of weather forecasting[4,5].These weather forecasting methods convert the data scanned by a Doppler weather radar into radar echo maps and generate maps of future moments based on these observed maps.With the help of automated algorithms[6],potential future storm circulation patterns,tracks,precipitation intensity and other indicators can be provided based on extrapolated radar echo maps[7,8].Accurate radar echo extrapolation is therefore regarded as a vital task before conducting effective precipitation nowcasting.Traditional methods for radar echo extrapolation include cross-correlation methods [9,10], centroid tracking methods [11,12] and optical flow-based methods [13,14].The cross-correlation methods calculate the correlation of each sub-region in two consecutive radar echo images to get the motion vectors[15].These methods have low prediction accuracy regarding the condition that echoes evolve rapidly [16].The centroid tracking methods regard the single radar echo as a 3-Dimensional entity,and then perform extrapolation by tracking its centroid; however, these methods are not applicable when echo splitting, or the convective weather is severe and complex [17].The optical flow-based methods proposed in computer vision area [18] establish an optical flow field by observing changes of pixel value between adjacent frames,and then extrapolate by considering other possible influences.These methods have separate steps for optical flow estimation and radar echo extrapolation,making it difficult to optimize parameters to obtain the best predictions.In addition,these methods are difficult to explain the connection between echo generation,echo dissipation and optical flow fields.They are only applicable for short-term prediction [19].Therefore, the three traditional methods mentioned above are limited in that they are not applicable to all conditions.In addition,they only use the most recent observed echo images and do not make full use of a large amount of historical observation data.
Recently,deep learning as a powerful tool has achieved excellent performance in many fields such as natural language processing[20,21],anomaly detection[22,23],medical image segmentation[24,25],etc.The models proposed in these works are driven by data and can learn potential features from historical data.In addition, deep learning-based methods are not easy to be limited by conditions.They outperform traditional methods of these fields in many tasks.Therefore, some researchers have attempted to apply deep learning models to radar echo extrapolation tasks,to achieve accurate prediction of radar echo maps.Shi et al.[26]innovatively treated the radar echo extrapolation task as a spatiotemporal sequence prediction problem;that is,predicting the most likely futureKradar echo map sequences with the givenJobserved radar echo maps.The authors also designed a ConvLSTM model and applied it to perform radar echo extrapolation.Its extrapolation results were better than traditional extrapolation methods and the classical Fully Connected LSTM(FC-LSTM)model.This work demonstrated the feasibility of deep learning-based methods for this task.Since then, a large number of models based on Recurrent Neural Networks (RNN), or its variants [27–30] have been proposed.
However, the input data, memory cell and hidden states are isolated in these methods.The contextual feature correlation between them is weak.Some important features may be discarded by the forget gate when performing long-term prediction.In addition, these models use convolution operations to capture features in spatial domain,so the models may lose some spatial features limited by the size of convolution filter,such as features related to high-intensity echo areas.Affected by the two factors above,it may be difficult for models to accurately predict the motion trends of radar echo such as moving direction,generation,and dissipation,which limits the prospects of the deep learning methods for radar echo extrapolation tasks.
To address the above-mentioned problems,this paper proposes a Contextual Feature Correlation Enhancement Block(CEB)and a Multi-Attention Mechanism Block(MAB).These two blocks are fitted into a ConvLSTM structure to establish the proposed model,called CEMA-LSTM.The CEB enhances the contextual correlation between input data and hidden states by using convolution and element-wise product operations.The MAB uses the attention mechanism from the perspective of position and channel dimension,respectively to capture global spatial features effectively.With these two components,the model can accurately extrapolate radar echo maps.
2 Related Work
2.1 Models for Spatiotemporal Sequences Prediction
As a kind of spatiotemporal sequence prediction problem,radar echo extrapolation has attracted a lot of research concerns and efforts.Many deep neural networks were proposed.The backbone structure of these models can be mainly divided into two categories.One is the encoder-decoder network consisting of convolutional and deconvolutional layers; the other is based on RNNs and its variants.
Shi et al.[26]replaced linear operations in the original LSTM structure with convolutional ones,which enhanced the dynamic modeling ability of the model.The proposed model obtained better results than optical flow-based methods and traditional deep models in extrapolation tasks, which attracted the attention of many researchers.Zhuang et al.[31]designed a novel spatiotemporal convolutional network(ST-CNN)to learn spatiotemporal dependencies among meteorological variables for extreme precipitation forecasting.Singh et al.[32]used a hybrid structure of LSTM and CNN with a discriminator for radar echo state prediction.Shi et al.[33]proposed a Trajectory GRU(TrajGRU)based on the ConvGRU.This model overcomes the problem that the convolutional recurrent structure is difficult to model transformation objects due to invariant location.It can actively learn the locationvariant structure to achieve high-resolution forecasting of regional rainfall.Wang et al.[27] added spatiotemporal memory to the ConvLSTM to build an ST-LSTM unit,which were stacked to build a PredRNN network.Wang et al.[28] then proposed a PredRNN++ network by optimizing the PredRNN, which consists of four layers of Causal LSTM units.A single unit has a dual-cascade gated structure and a gradient highway.These two components can model both the short-and longterm dynamics compared with the original model.Tran et al.[34] designed a sequence-to-sequence network to predict multi-channel radar sequences.Ayzel et al.[35] used a deep fully convolutional neural network for precipitation forecasting, and experiment results showed that this model can capture and learn the features of convective weather generation and evolution well.Wang et al.[36]introduced the concepts of stationary and non-stationary states into a deep learning area and proposed a Memory in Memory (MIM) model, which can capture these two types of features separately by using two cascaded,self-updating modules,and have achieved the best prediction results on multiple spatiotemporal sequence datasets.Guen et al.[37]proposed a two-branch network PhyDNet.It can capture rough-and fine-grained features of moving objects by using physical and residual branches,respectively.A series of work[38–41]further improved the structure of the classical encoder-decoder model,U-Net for specific spatiotemporal sequence prediction tasks.
2.2 Models Integrating Attention Mechanism
Attention mechanism has recently been a hot topic in the field of deep learning.Inspired by the attention of the human brain,this mechanism amplifies or suppresses features by calculating a weight matrix compared with ordinary convolutional operations [42].With this mechanism, the original models can effectively learn important global features from existing data and then perform specific tasks better.
Vaswani et al.[43]abandoned the traditional CNN or RNN structure and designed a Transformer model.This model uses multi-head attention for machine translation tasks.Song et al.[44]proposed a Mask-Guided Contrastive Attention Model (MGCAM) to learn features from different parts of an image for person re-identification.Woo et al.[45]used a Convolutional Block Attention Module(CBAM)for feature refinement.The module greatly improves the performance while keeping the holistic network lightweight.In addition,the CBAM can be embedded in other models.Trebing et al.[46]introduced it into the original U-Net model to build SmaAT-UNet.The performance of this model in doing precipitation nowcasting tasks is comparable to those of larger and more complex models.Zhao et al.[47]used a scene parsing model,called Point-wise Spatial Attention Network(PSANet)to adaptively learn features from the feature map for the collection of contextual information.Li et al.[48]proposed a MANet for remote sensing image semantic segmentation tasks.This model can efficiently extract the contextual dependencies of data with the help of multiple attention modules,and it uses a novel kernel attention mechanism to reduce the computational complexity.
Some models have also been proposed for spatiotemporal sequence prediction by integrating attention mechanisms.Lin et al.[49]optimized the attention mechanism by adding a gated structure and an additional memory to build a Self-Attention Memory(SAM)module.The SAM was integrated into the original ConvLSTM unit to build the SA-ConvLSTM model, which achieved improved performance in making spatiotemporal prediction while maintaining fewer parameters.Chai et al.[50]designed a Context-Embedding Block and a multi-scale-based Spatiotemporal-Expression Block for accurate modeling of typhoon image sequences.
3 Methodology
In this section, the structure of the proposed Contextual Feature Correlation Enhancement Block and the Multi-Attention Mechanism Block,and the way that they operate in a CEMA-LSTM recurrent unit are discussed in detail.
3.1 The Contextual Feature Correlation Enhancement Block
Current proposed recurrent units,such as the ConvLSTM and ST-LSTM,have a gated structure consisting of a forget gate, an input gate, an input modulation gate, and an output gate.The forget gate enables the model to trade-off between the previous features and the newly captured features from new input data at current-time step,so the model can forget previous features and learn new captured features,and then the memory and hidden state are updated and transmitted to the next unit.
In general, the input data and previous hidden state are only interacted in form of doing convolution or addition operations in traditional models.When performing long-term prediction tasks, i.e., radar echo extrapolation in this paper, the model can receive bad input data so the parameters of the model are not efficiently optimized.They may determine the contextual feature correlation between the input and hidden state is weak.Then the forget gate may choose to forget the features that are more important for future prediction.This process is irreversible,which leads to inaccurate modeling of radar echo motion and wrong prediction of future motion trend.To address this problem,the Contextual Feature Correlation Enhancement Block(CEB)is proposed,as shown in Fig.1.
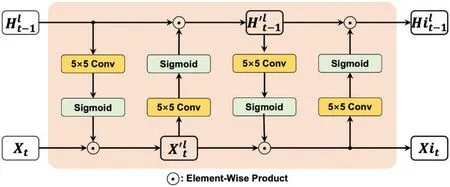
Figure 1:The structure of a Contextual Feature Correlation Enhancement Block
The CEB is embedded before the gated structure of recurrent unit.The block has two main operations, i.e., convolution and element-wise product.The new input state of current momentXtand previous hidden stateare transmitted into CEB.The block firstly uses a convolution filterWhx,whose size is 5×5,to capture the previous feature information from.The Sigmoid function followed the convolution layer is to ensure that the value of each element in the captured feature map is between(0,1).
Then,the block performs element-wise product onXtand the feature map that is captured fromtogether make the two states interact with each other.The interaction process makes the features from different moments fused, so that the contextual correlation between the hidden state and the input state gets preliminary enhancements.The output of this process is used to update the original inputXt,and the new input state is written as.Next,using another convolution filterWxh,whose size is also 5×5 to generate a feature map fromThe Sigmoid function normalizes the map,then the element-wise product makes the previous hidden state to interact with the new captured features.The obtained output becomesSimilarly, performing the operation above again onandthe obtainedXitandis the final output of the CEB,representing the interacted input and hidden state,respectively.The whole process can be formulated as Eqs.(1)–(4),where*means the convolution operator,×means the element-wise product operator,andσis the Sigmoid function.
The CEB block enhances the contextual feature correlation between the input state and the hidden state in original recurrent units,preventing the occurrence of errors during predicting the motion of echo objects caused by forgetting important features of the gated mechanism.
3.2 The Multi-Attention Mechanism Block
Most previous models use convolution to capture features in spatial domain and learn the dynamics of moving objects.However, limited by the size of convolution filters, these models have difficulty in capturing the global motion features of radar echo at a single-time step.
To address the problem,a Multi-Attention Mechanism Block(MAB)is proposed,which consists of two attention modules, i.e., a Position Attention Module and the Channel Attention Module.In the same way as the original dot-product attention mechanism, the PAM and CAM compute the similarity score of each pair of points in a feature map to obtain the corresponding weight matrix from the view of position and channel,respectively.This block enables the model to determine which features are important in a global view,in order to capture and remember the features when performing the gated mechanism.The important global features captured by the MAB are memorized in a hidden state,so that the gating operation can consider the features more comprehensively to accurately model the dynamics of radar echo.The structure of the MAB is shown in Fig.2.The input to of MAB is the memorytransmitted from the previous time step and the interacted hidden stateThe block performs element-wise addition on these two input terms.The operated result isZ, then it is transmitted into the PAM and CAM as the input of the two attention modules.

Figure 2:The structure of proposed Multi-Attention Mechanism Block
In a PAM,Zis operated by three different 1 × 1 convolution filters and then reshaped to get matrixes QueryQp,KeyKpand ValueVp.Their size isN×(H×W)×C,whereNis batch size,Cis the number of channels,His the height of a feature map,andWis the width of a feature map.In the original dot-product attention mechanism,QpandKpare applied matrix multiplication and a softmax function to obtain the weight matrix.This can be formulated as:

For thei-th row,it can be written as:


The Eq.(7)can be further formulated in a vectorized form as Eq.(8):

The calculation result is reshaped and performed element-wise addition withZ.Finally,the ReLU function is applied to the output of the element-wise addition.This can be expressed as:

In a CAM,Zis also operated by three different 1×1 convolution filters, respectively, and then reshaped to get matrixes QueryQc,KeyKcand ValueVc.All their size isN×C×(H×W),which is different to that in a PAM.The size ofQcKcTisN×C×C,where the value ofCis much smaller thanHorWfor radar echo maps.This indicates the lower computational and memory complexity of the subsequent dot-product attention operation.Therefore,the original dot-product attention mechanism is still used in the CAM.Similar to that in the PAM,the calculation result of the dot-product attention mechanism is added with the original input Z after getting reshaped, and then it is output after the ReLU function operation.The working process of the CAM is formulated as:

After obtaining the outputs of the CAM and PAM, respectively, the element-wise addition operation can be performed to fuse them to get the output of the MAB, which is transmitted to the gated mechanism as the new hidden statecontains global features.This process can be formulated as:

3.3 The CEMA-LSTM Unit
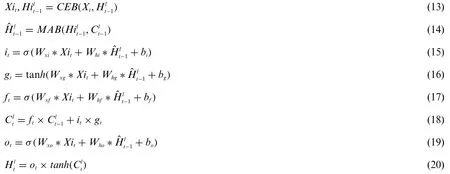
Embedding the CEB and MAB into the original ConvLSTM,and the CEMA-LSTM proposed in this paper is established.Generally,recurrent units are stacked to build the prediction network,which increases the recurrence depth of the model at one-time step,so that models can better capture refined features to model the short-term dynamics of objects.A single unit’s structure is shown is Fig.3,whereldenotes the unit in thel-th layer,tmeans thet-th time step,fis forget gate,iis input gate,gis input modulation gate,andois output gate.
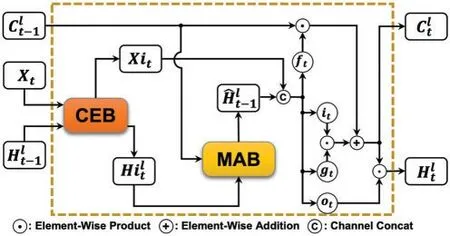
Figure 3:The structure of proposed CEMA-LSTM unit
The working process of a CEMA-LSTM unit can be clearly seen from the figure.The inputXtis at current moment.The hidden state of previous time stepand the previous memoryare the three input terms of the recurrent unit.Whenl=1,it means that the recurrent unit is at the bottom layer.Xtis the new input data at thet-th time step.Whenl >1,it means that this recurrent unit is not the bottom one.the hidden statefrom previous layer plays the role of input stateXt.andXtare firstly transmitted into a CEB to perform feature capturing and interaction.The interacted input stateXitand interacted hidden stateare then obtained, so that both two states have stronger contextual feature correlation.
Next,andare transmitted into MAB.The block captures global features from the view of position and channel.The two types of features are fused to generate the final global feature map,while the output is the new hidden state
After the operation of two blocks,Xithas strong contextual correlation with the hidden state at the previous moment.The new hidden state’s contextual correlation is also enhanced,andcontains rich global important features.The two terms are combined, and the subsequent operations follow the original gated mechanism in ConvLSTM unit.ftforgets those features that are not important for prediction considering the contextual feature correlation and global feature maps.itandgtlearn the new captured features,especially those that are relevant to the dynamics of objects.Element-wise addition is performed to update the memory,so new memoryis obtained.Finally,the new hidden stateof a current unit is generated.The whole processes of the CEMA-LSTM can be expressed as:
The Tsar rejoiced greatly to see them. To Tsarevitch Dimitri, since he had brought him the Fire Bird, he gave the half of his Tsardom, and he made a festival which lasted a whole month, at the end of which time Tsarevitch Vasilii was to wed44 the Tsarevna, Helen the Beautiful.
Compared to the mentioned traditional radar echo extrapolation methods,the proposed CEMALSTM model is versatile because it is suitable for various conditions without considering the shape,quantity,size,and other properties of radar echoes in input observed maps.Either based on existing RNNs or its variant structure,the CEMA-LSTM retains and captures features that play an important role in the dynamics of radar echoes by embedding the two newly proposed modules CEB and MAB,thereby achieving accurate radar echo extrapolation.
4 Experiments
This section will introduce the details of the experiments, including used datasets, quantitative evaluation metrics for performance evaluation, settings of experimental parameters, presentation of experiment results,as well as the analysis of them.
4.1 Datasets
In this paper, two practical radar echo datasets are used to demonstrate the outperformance of the proposed CEMA-LSTM over existing methods on radar echo extrapolation, as well as its generalization ability and robustness on different datasets.The first dataset is made by the authors using historical Doppler weather radar echo images of composite reflectivity,while the second one is a publicly available radar echo dataset.
4.1.1 The FREM Dataset
The FREM (Fine-grained Radar Echo Map) dataset contains/radar echo images of composite reflectivity obtained by a Doppler weather radar for three consecutive years.The dataset is divided into three parts for comparative experiment, i.e., a training set, a validation set and a test set.The training set has 2,715 radar echo map sequences.The validation has 550 sequences,whilst the test has 925.Each sequence has 15 radar echo maps.The interval between every two adjacent maps is 6 min,so each sequence represents 90-min observation.All models receive the first 5 radar echo maps to predict the next 10 maps;that is,past 30-min observed data are used to predict next 1 h.The size of each radar echo map is 128×128,meaning the spatial resolution is 1 km.The unite of each pixel value is dBZ,and ranges from 0 to 70.All data are masked fulfilling the laws and regulations of the meteorological department.
4.1.2 The CIKM 2017 Radar Echo Dataset
To verify the generalization ability and robustness of the proposed model, a publicly available radar echo dataset called CIKM 2017 were also manipulated.This dataset is provided by Shenzhen Meteorological Bureau,in which the sequence numbers of training set,validation set,and test set are 8,000,2,000,and 4,000,respectively.Each sequence has 15 echo maps,where the interval between two adjacent maps is also 6 min.All models in the experiment extrapolate the next 10 maps based on the 5 input maps.The original size of each map is 101×101.For the convenience of calculation,this paper fills the right and lower sides of each map in this dataset with 0,so make the new obtained echo map size 104×104.The pixel values in each echo map are converted into dBZ according to the following equation:

4.2 Evaluation Metrics
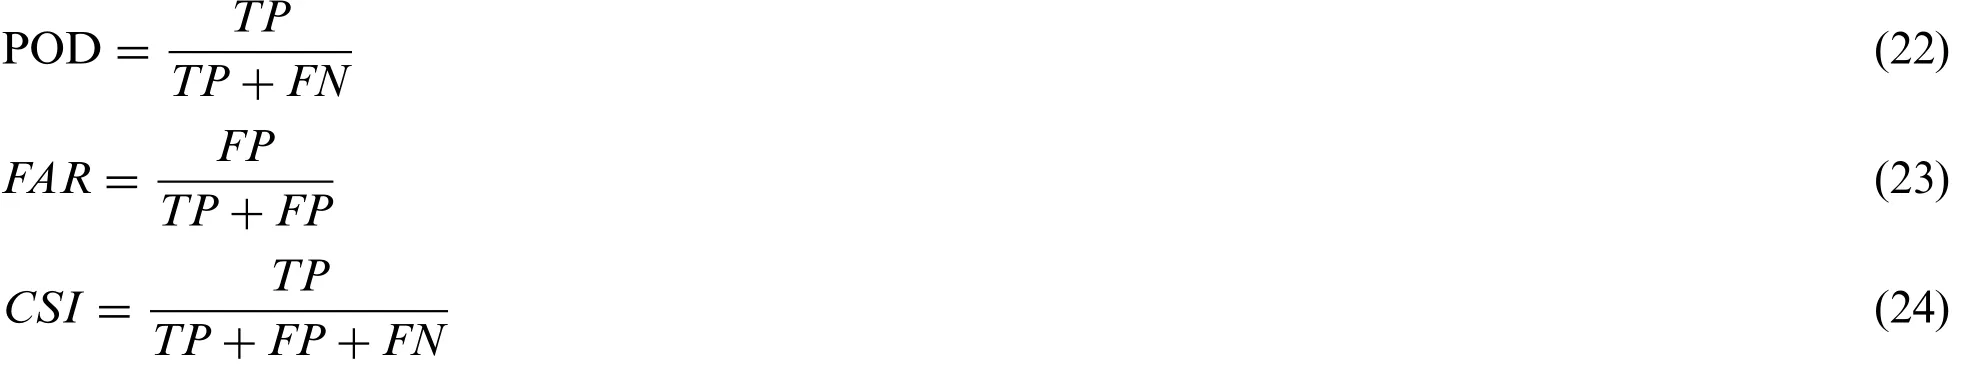
To evaluate the quality of predicted radar echo maps generated by each model, three meteorological evaluation metrics were chosen including Probability of Detection (POD), False Alarm Rate (FAR), and Critical Success Index (CSI).The POD score, ranging from 0 to 1, evaluates the ability of the model to correctly forecast the precipitation events.The higher value indicates the better performance of the model.The FAR score reflects whether the model has the possibility of false precipitation prediction events.A FAR value varies between 0 and 1.The closer to 0,the lower possibility of false precipitation prediction events a model has.The CSI score,also known as the Threat Score(TS),reflects the precipitation forecasting probability of a model;that is,the condition that the model successfully predicts a precipitation event.A CSI value ranges from 0 to 1.The more it is closer to 1 the better a model indicates its forecasting performance.
The values of above meteorological evaluation metrics are calculated as following steps.Given a dBZ thresholdτ, compare each pair of points at the same location in the predicted map with the corresponding observed map.If the values in the predicted and observed map are both higher thanτ,the number of points belonging to this category is recorded as TP.If only the value of one point in the predicted map is higher thanτ,whilst the corresponding value in the observed map is lower thanτ, the number of points belong to this category is recorded as FP.If the value in the predicted map is lower thanτ,whilst the corresponding value in the observed map is higher thanτ,the number of points belong to this category is recorded as FN.If the values in both the predicted map and observed map are lower thanτ, the number of points belong to this category is recorded as TN.Finally, the POD,FAR and CSI scores of each model can be obtained by calculation according to the following formula:
Structural Similarity(SSIM)were also used to evaluate the visual quality of the predicted maps.The higher SSIM score indicates that the predicted map is more similar to the observed map.
4.3 Implementation
ConvLSTM [26], PredRNN [27], PredRNN++ [28], Memory in Memory (MIM) [34] and PhyDNet [35] were chosen to compare.The five models are all representative deep learning-based methods in spatiotemporal sequence prediction tasks and/or radar echo extrapolation tasks.They are not easily affected by the data type or the size of radar echo maps.When received several maps from past observations,they are able to extrapolate a sequence of multiple maps for a period of time in the future,rather than generating only the radar echo map of a single future moment.
Following the settings in [25,26], all models were stacked to build a 4-layer prediction network.Each layer has 64 feature maps,the size of convolution filter is 5×5.Adam[51]was selected as the optimizer,where the batch size was set to 4,the initial learning rate was 0.001,and the loss function was set as L1+L2 Loss.Scheduled sampling[52],layer normalization[53]and early stopping strategy were also used for model training.All models were implemented by PyTorch and the experiments were conducted in a GPU server fitted by a NVIDIA RTX 3090.
4.4 Experiment Results
4.4.1 The Results of Comparative Experiment on the FREM Dataset
Table 1 shows POD and FAR scores of each model on the FREM dataset when the thresholdτis set to 20,30,and 40 dBZ,respectively.In terms of POD,the proposed CEMA-LSTM improves by 0.68%over PredRNN++whenτ=20.Whenτ=30 andτ=40,its POD score is higher than that of the second-ranked model,i.e.,MIM by 0.19%and 7.04%,respectively.In addition,its average POD score is improved by 3.87%,which indicates that it can better predict the precipitation events correctly under all thresholds.
In terms of FAR,a lower FAR score indicates the lower possibility of false precipitation prediction events.It can be seen from the results that the CEMA-LSTM has achieved the lowest FAR scores under all three thresholds.Compared with the second-ranked MIM,the FAR scores decrease by 1.97%(τ=20),1.44%(τ=30),and 1.65%(τ=40),respectively.The average FAR score of the proposed model has been improved by 1.65%.
Compared with the benchmark model, i.e., ConvLSTM, the proposed model shows significant improvement.The POD scores at three thresholds are increased by 5.91%, 0.27% and 24.60%,respectively,whereas the FAR scores are decreased by 17.01%,1.60%and 4.96%,respectively.
The CSI and SSIM scores of each model are shown in Table 2, it can be seen from the table that the CSI and SSIM scores of the proposed CEMA-LSTM are both improved compared with the previous models.Whenτ=20,the CSI score is improved by 1.48%compared with the MIM and 4.93%compared with the baseline model ConvLSTM.Whenτ=30,the improvement is 0.07%over MIM and 14.40%to ConvLSTM.Whenτ=40,it is improved by 6.02%and 20.72%compared with the MIM and the ConvLSTM,respectively.In terms of average CSI score,it creases by 1.79%over MIM.The above results show that the proposed CEMA-LSTM makes a significant improvement in successfully radar extrapolation compared with previous models.For SSIM,The CEMA-LSTM also obtained the highest score.it creases by 0.78% over the second-ranked MIM, indicating that its predicted radar echo map has better visual quality and higher similarity with the corresponding observed maps,which can better help meteorologists make effective precipitation forecast.
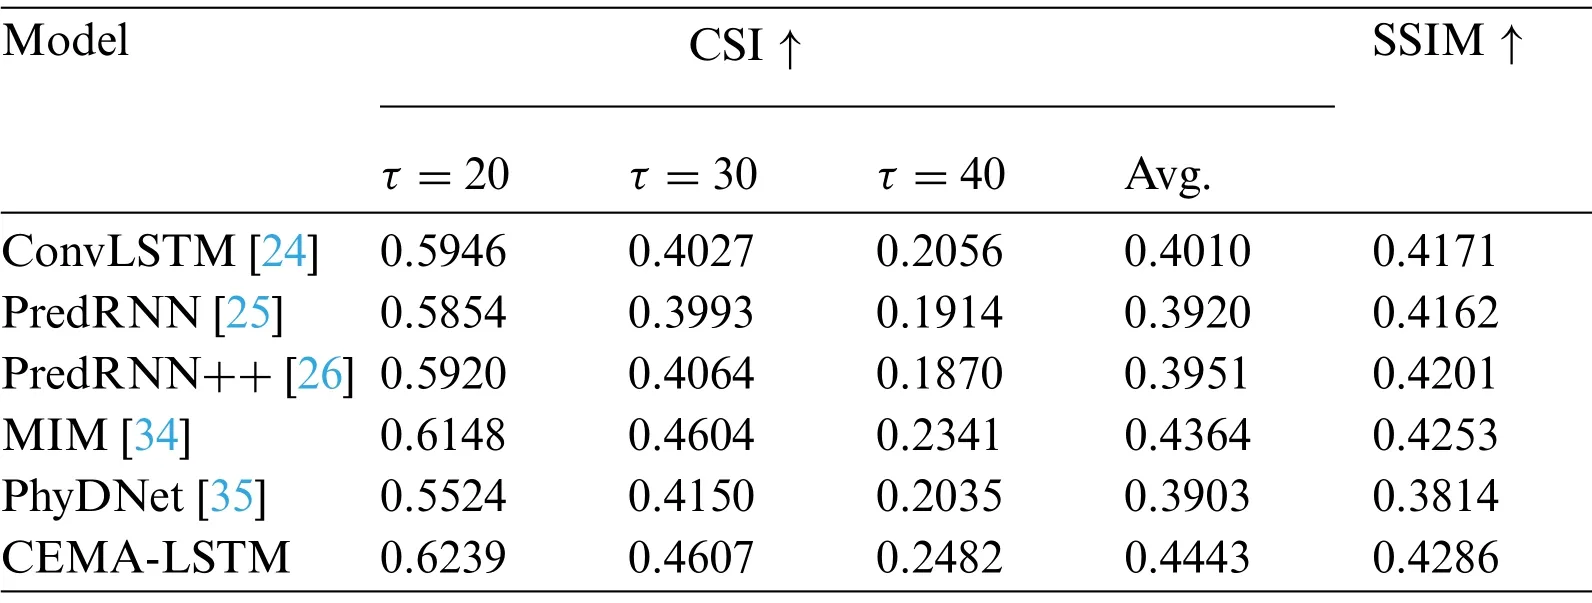
Table 2:The quantitative comparison of all models in terms of CSI and SSIM when threshold τ is set to 20,30 and 40 dBZ on FREM dataset
In addition, the extrapolation results of models are visualized to illustrate the performance of the proposed model.The series of instances on the dataset were carefully chosen representing typical movement and development of high-intention echoes, such as generation and dissipation.These variations are shown in maps as changes in positions, amounts, and pixel values.Noises have been filtered through multi-class processes from base data, so these echo pictures contain representative meteorological values.Fig.4 is one of the typical sequences so that it can better reflect the general variation characteristics of echoes,especially for high-intensity echoes in all sequences.The mapping relationship between the radar reflectivity value and the color is shown in the color bar at the top.The closer to purple depicts a higher intensity of radar echo, indicating the higher possibility of severe convective weather, such as heavy precipitation in this area.However, such trend only means the dynamics of precipitation-particles in Cumulonimbus clouds above 5000–20,000 meters(or possibly higher), whether actual precipitation events happen or not need to be further investigated with the situation of the overall weather system at the nowcasting stage.The first two rows of images are the observed maps in this sequence.All models predict the 10 echo images in the second row based on the 5 echo images in the first row.The next 6 rows of images are the predicted maps of each model.The label T at the bottom of each column is the lead time corresponding to the predicted map.
This sequence depicts the echoes variation process that relates to the development of possible severe convective weather events.As shown in the Input echoes, several orange and red areas were forming at the edge of the map, indicating potential wide influence and rapid expansion of highintensity echoes.Observed ground truth slides in the second row illustrate the high-intensity echoes finally aggregated in the center of map.The corresponded extrapolated maps can help to identify potential severe convective weather events within radar observation range such as heavy storms and strong wind.Compared with other models, the proposed CEMA-LSTM has shown accurate extrapolation on both edge and intensity,as highlighted in red boxes.
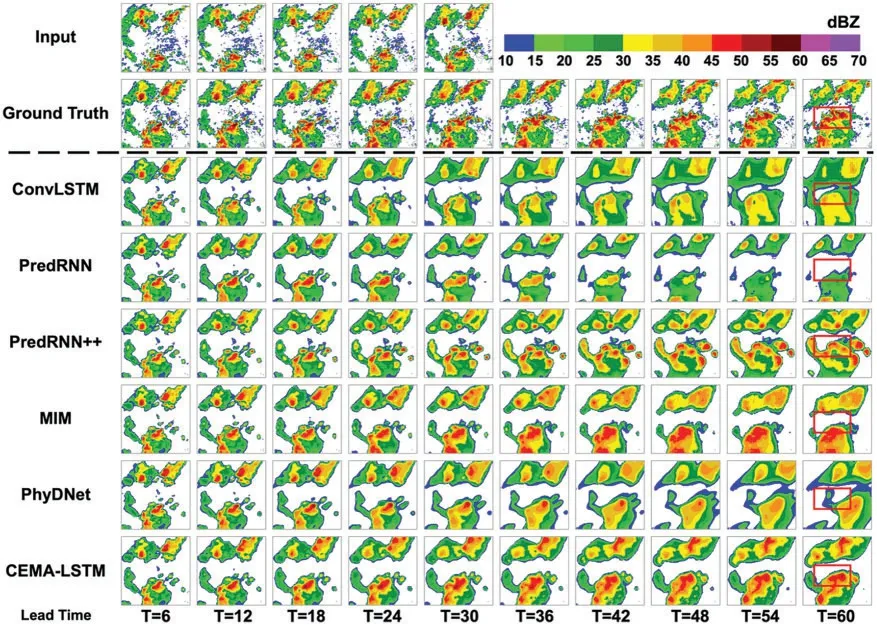
Figure 4:The visualized prediction results of all models on a sequence sampled from test set of FREM dataset
The ConvLSTM incorrectly predicts that the above and below echoes are both expanding, but it fails to successfully predict the high-intensity echo area marked in the red box.This is due to the lack of contextual information,and it is difficult for the model to capture global features to determine the dynamics of radar echoes.The first few maps extrapolated by the PredRNN are similar to the observed maps.But starting from T=30,the echo below gradually dissipates,so the echo area in the red box is obviously smaller than the ground truth.The extrapolated maps of the PredRNN++are significantly improved compared with those of the PredRNN.The model can predict the aggregation trend of the echo above and below, but the orange area in the prediction maps moves to the right,which is exactly opposite to the observed maps.The echo positions in the maps extrapolated by the MIM are roughly the same as those in the observed maps,but in the last few maps,it can be clearly seen that the orange echo region is large for both the upper and lower echo.The model also fails to predict the red echo area marked in the red box correctly.The extrapolation results of the PhyDNet also suffer from the above-mentioned problems.The positions of the two echoes deviate significantly compared to their actual positions,indicating that the model fails to capture the features of radar echo motion and its variations.In addition,its extrapolated maps are more blurred and visually distorted,making it difficult to discern the detailed texture of the radar echoes from the maps,which is the reason why its SSIM score is much lower than other models.The CEMA-LSTM proposed in this paper has successfully predicted the trend that the upper and the lower echo move to each other and aggregate at the center of map.The yellow and orange areas representing higher reflectivity do not dissipate or are severely overestimated.The red echo area marked in the red box where strong convective weather events may occur has also been successfully predicted.This is owing to the two embedded blocks.The CEB enhances the correlation between features and prevents the high-intensity echo generation features from being forgotten by the model,and the MAB can accurately model its dynamics by capturing the feature of radar echo motion.
4.4.2 The Results of Comparative Experiment on the CIKM 2017 Dataset
The extrapolation quality of all models on the CIKM 2017 dataset was evaluated by calculating quantitative values and visualization.Compared with the previous dataset,the map size is smaller,and the models obtain less information of radar echo motion,so the extrapolation task on this dataset is more challenging.Tables 3 and 4 show the quantitative scores of all models on the CIKM 2017 dataset.It can be seen that similar results to the previous dataset are obtained.
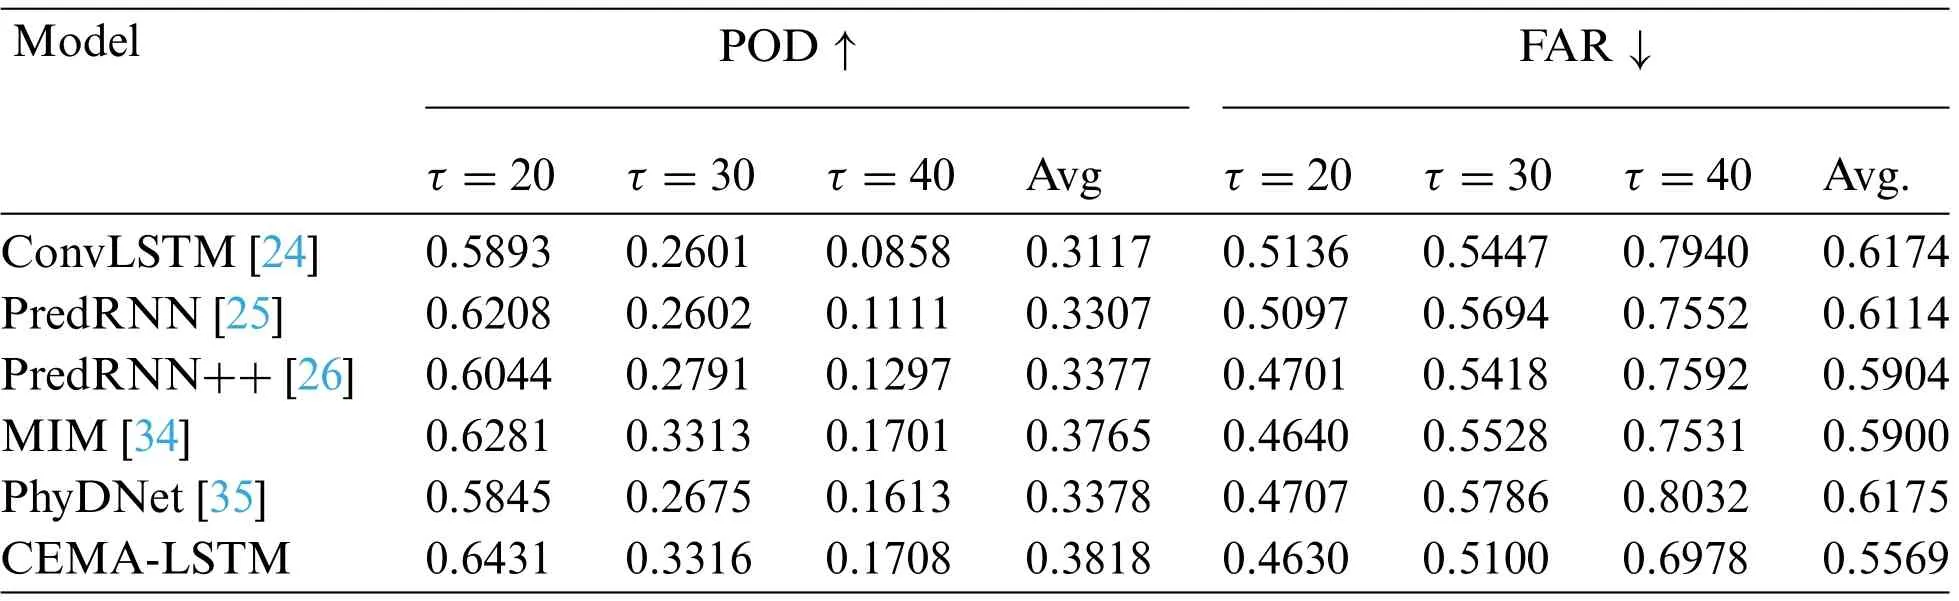
Table 3:The quantitative comparison of all models in terms of POD and FAR when threshold τ is set to 20,30 and 40 dBZ on CIKM 2017 dataset
As shown in Table 3,at three different thresholds,compared with the second-ranked MIM model,the POD scores of the proposed CEMA-LSTM are improved by 2.39%,0.09%and 0.41%,respectively,and the average POD score is improved by 0.14%.In terms of FAR,it is improved by 0.21%,7.74%and 7.34%,respectively,and the average FAR value is decreased by 5.60%.
Table 4 shows the CSI and SSIM scores of these models on the CIKM 2017 dataset.Compared with the ConvLSTM,the proposed CEMA-LSTM has a very significant improvement in all scores.Compared with the second-ranked MIM model, the CSI scores of the CEMA-LSTM are improved by 1.67%,4.63%,and 5.42%,respectively,when the threshold is set to 20,30,and 40 dBZ.The average CSI score is improved by 3.16%,while the SSIM score is improved by 0.83%,indicating that the maps extrapolated by the CEMA-LSTM are more similar to the observed maps.
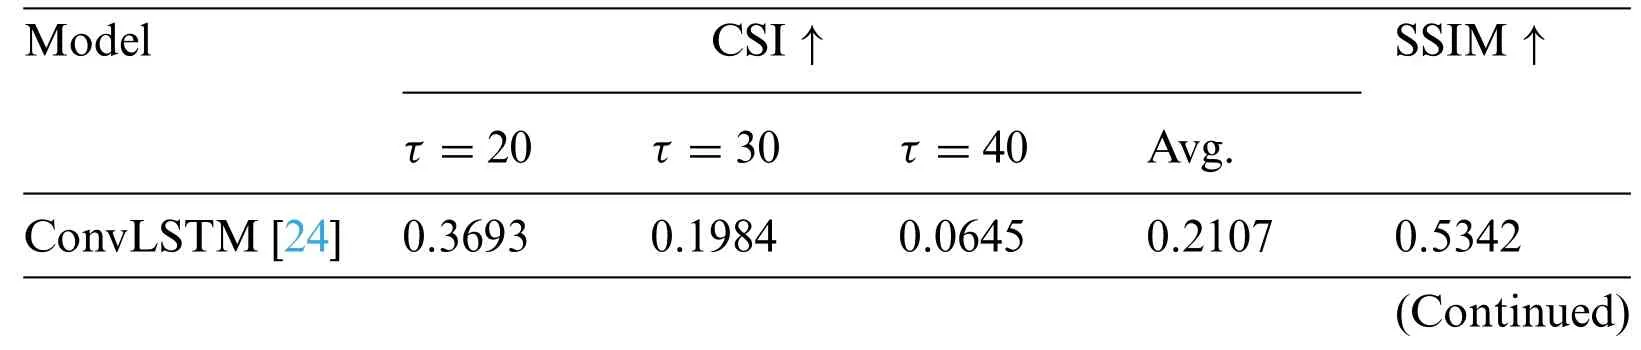
Table 4:The quantitative comparison of all models in terms of CSI and SSIM when threshold τ is set to 20,30 and 40 dBZ on CIKM 2017 dataset
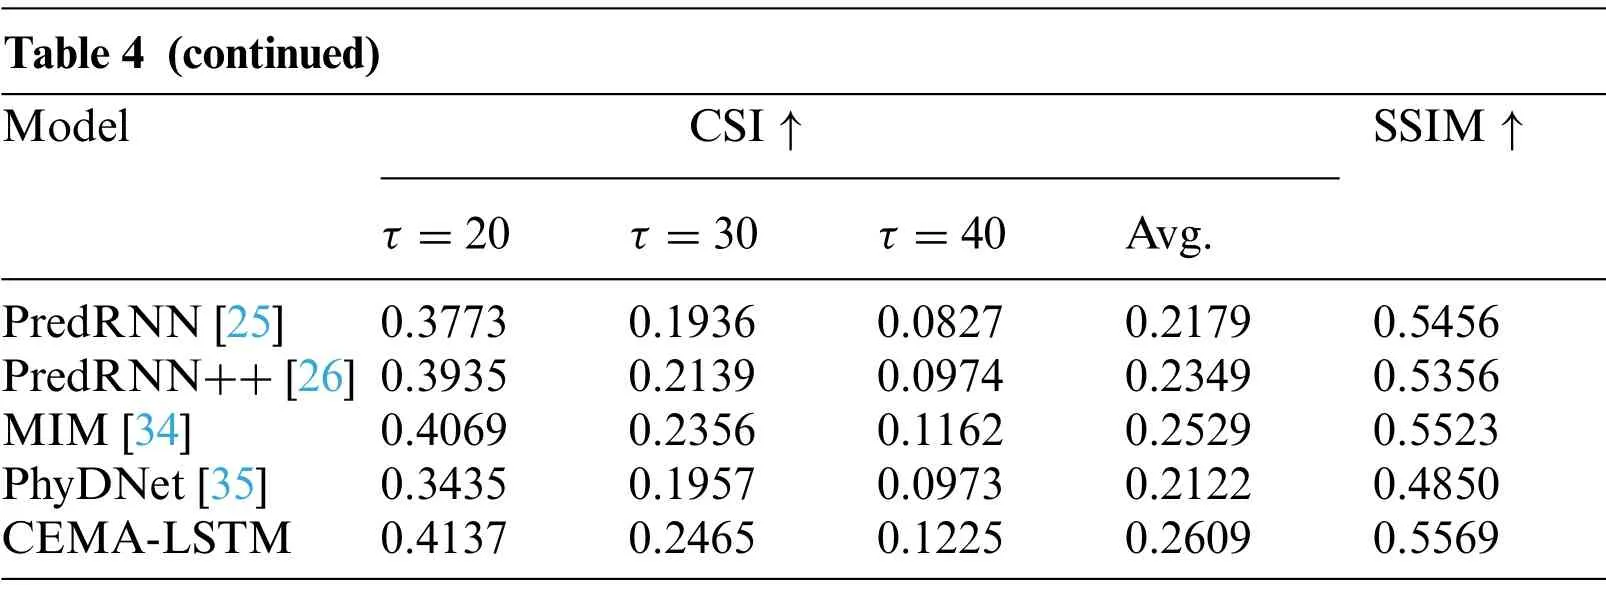
Table 4 (continued)Model CSI ↑ SSIM ↑τ =20 τ =30 τ =40 Avg.PredRNN[25] 0.3773 0.1936 0.0827 0.2179 0.5456 PredRNN++[26] 0.3935 0.2139 0.0974 0.2349 0.5356 MIM[34] 0.4069 0.2356 0.1162 0.2529 0.5523 PhyDNet[35] 0.3435 0.1957 0.0973 0.2122 0.4850 CEMA-LSTM 0.4137 0.2465 0.1225 0.2609 0.5569
Fig.5 shows the visualization of radar echo maps extrapolated by each model for one sampled sequence from the test set of the CIKM 2017 dataset.It can be seen that there was an orange strip area in the middle of the map,and gradually moved downward and increases in intensity at the same time.This area can be related to heavy precipitation or storm events.In order to better illustrate the extrapolation quality of models,the strip area is marked with the red box.
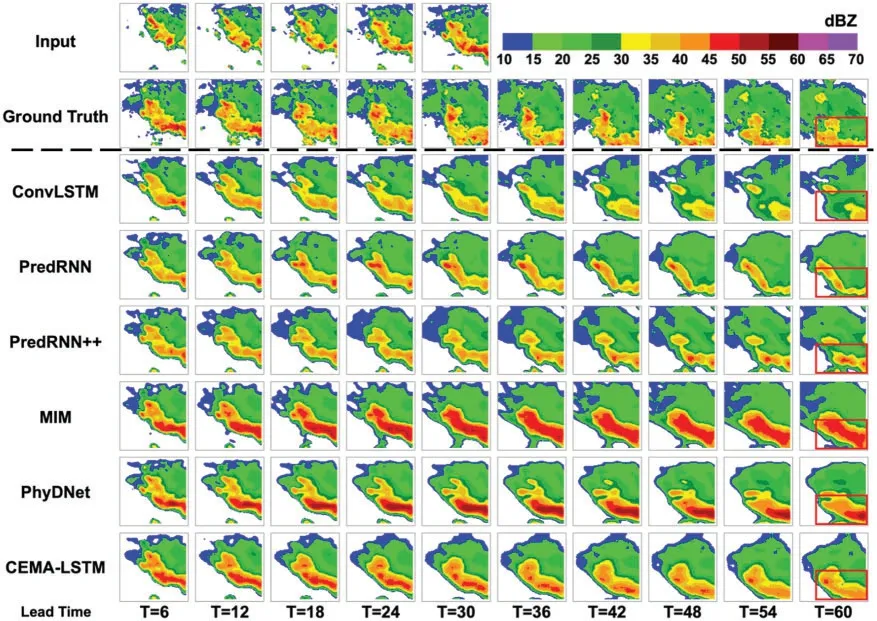
Figure 5:The visualized prediction results of all models on a sequence sampled from test set of CIKM 2017 dataset
All models successfully predicted the general motion trend of radar echoes in this sequence,but some details in extrapolated maps such as the boundaries,the intensity of echoes are quite different from each other.The baseline model ConvLSTM lacks the contextual feature correlations and global features of the radar echo motion, so its extrapolation results for this sequence are inaccurate.The yellow area in the red box almost dissipated.The PredRNN and PredRNN++ got similar extrapolation results,but as shown in the area marked by the red box,the location of the stripe echo area was wrong.The extrapolated echo map of MIM has obvious intensity overestimation problem.The red box in the last map is almost filled by the red echo area.The PhyDNet also suffers from the overestimation problem,and it is even more severe.The red area in the red box is almost 3 to 4 levels higher than that in the observed maps.This is fatal,as severe overestimation may lead to unnecessary responses,resulting in a waste of public resources.The last row shows the extrapolated echo maps of proposed the CEMA-LSTM,which accurately predicted the trend of the radar echo motion.For the high-intensity radar echo region marked in the red box,although the yellow and orange regions are slightly larger in area,the location and intensity of the stripe area are most similar to the corresponding observed maps compared with the other models’maps.
4.5 Discussion
The extrapolation results on two different radar echo datasets have shown that with the help of the CEB and MAB,the proposed CEMA-LSTM can well understand the contextual correlation between the new input data and the previous states.It can then learn the newly captured global features,whilst concerning the features transmitted from previous stages.Compared with the other five models,the proposed CEMA-LSTM can accurately recognize and learn the dynamics of radar echoes,but avoid the overestimation or dissipation of high-intensity echo areas at the same time, leading to its higher quantitative scores and more accurate extrapolation results.However,radar echo extrapolation is only the early stage of precipitation nowcasting.To provide the public with precipitation rate,rainfall area,duration of precipitation events and other information,it is necessary for meteorologists to implement the conversion from radar data to meteorological data with the help of some methods in meteorological area.Therefore,the echo maps by the accurate extrapolation methods can lay a solid foundation for more rational short-term precipitation nowcasting.
In addition,the authors also notice that the extrapolated echo maps of the proposed method still differ from the observed maps in terms of the boundary and fine-grained texture.This happens due to the inherent complexity of the atmospheric system,which is affected by various meteorological factors,such as temperature, wind direction, air pressure, etc.As detected echoes are constantly evolving,holistic modeling their dynamics via the echoes only becomes unilateral and uninterpretable.Instead,the CEMA-LSTM proposed in this paper attempts to discover the potential correlation between previous and future echo maps,regarding radar echoes as moving objects in images to illustrate their potential movement trends.In this way,better inference results can be achieved over existing methods with far less consumption of computational resources than traditional numerical weather prediction methods in the meteorological area.
5 Conclusion
In this paper,a CEMA-LSTM recurrent unit for radar echo extrapolation tasks is proposed,which takes the ConvLSTM as the backbone, fitted with a Contextual Feature Correlation Enhancement Block (CEB) and a Multi-Attention Mechanism Block (MAB).The CEB enables the current input state and previous hidden state to interact with each other, in order to enhance contextual feature correlation.The MAB uses a position attention mechanism and a channel attention mechanism to capture and amplify global important features.
Both quantitative comparisons and visualization results of the comparative experiments conducted on two radar echo datasets have shown the improved performance of the CEMA-LSTM proposed in this paper in radar echo extrapolation tasks, which can accurately predict the motion trend of radar echoes.Specifically, on the FREM dataset, compared with the second-ranked model MIM,the average POD score and average CSI score are improved by 3.87%and 1.79%,respectively,while its FAR value decreases by 1.65%and its SSIM score improves by 0.78%.On the FREM dataset,compared with the MIM, both the average POD and CSI score are improved by 1.42% and 3.16%,respectively, while its FAR decreases by 5.60% and its SSIM improves by 0.83%.In addition, the extrapolated boundaries and textures of the high-intensity echoes by the CEMA-LSTM are not quite consistent with the observed maps.In the future, the authors will attempt to integrate additional information such as the corresponding wind field conditions to the original input radar echo data to solve this problem.
Funding Statement:This work has received funding from the Key Laboratory Foundation of National Defence Technology under Grant 61424010208,National Natural Science Foundation of China(Nos.62002276, 41911530242 and 41975142), 5150 Spring Specialists (05492018012 and 05762018039),Major Program of the National Social Science Fund of China(Grant No.17ZDA092),333 High-Level Talent Cultivation Project of Jiangsu Province(BRA2018332),Royal Society of Edinburgh,UK and China Natural Science Foundation Council(RSE Reference:62967\_Liu\_2018\_2)under their Joint International Projects Funding Scheme and Basic Research Programs(Natural Science Foundation)of Jiangsu Province(BK20191398 and BK20180794).
Conflicts of Interest:The authors declare that they have no conflicts of interest to report regarding the present study.
 Computer Modeling In Engineering&Sciences2023年4期
- Computer Modeling In Engineering&Sciences的其它文章
- A Study of BERT-Based Classification Performance of Text-Based Health Counseling Data
- Overview of Earth-Moon Transfer Trajectory Modeling and Design
- The Class of Atomic Exponential Basis Functions EFupn(x,ω)-Development and Application
- Corpus of Carbonate Platforms with Lexical Annotations for Named Entity Recognition
- Unique Solution of Integral Equations via Intuitionistic Extended Fuzzy b-Metric-Like Spaces
- Numerical Assessment of Nanofluid Natural Convection Using Local RBF Method Coupled with an Artificial Compressibility Model