
Observation of the poloidally asymmetrical density perturbation of sawtooth collapse on J-TEXT
2023-03-15 00:54YinanZHOU周乙楠GeZHUANG庄革PengSHI石鹏LiGAO高丽ZhoujunYANG杨州军XiaoqingZHANG张晓卿andtheTEXTTeam
Plasma Science and Technology 2023年3期
关键词:高丽
Yinan ZHOU (周乙楠), Ge ZHUANG (庄革), Peng SHI (石鹏),Li GAO (高丽), Zhoujun YANG (杨州军), Xiaoqing ZHANG (张晓卿) and the J-TEXT Team,5
1International Joint Research Laboratory of Magnetic Confinement Fusion and Plasma Physics, State Key Laboratory of Advanced Electromagnetic Engineering and Technology,School of Electrical and Electronic Engineering, Huazhong University of Science and Technology, Wuhan 430074, People’s Republic of China
2 Department of Engineering and Applied Physics School of Physical Sciences, University of Science and Technology of China, Hefei 230026, People’s Republic of China
3 United Kingdom Atomic Energy Authority, Culham Centre for Fusion Energy, Culham Science Centre,Abingdon, Oxon OX14 3DB, United Kingdom
4 Southwestern Institute of Physics, Chengdu 610041, People’s Republic of China
Abstract The detailed density perturbations provided by the advanced polarimeter-interferometer system(Polaris) during sawtooth collapse on the Joint Texas Experimental Tokamak (J-TEXT) are reported in this article.During a sawtooth collapse and the crash of plasma pressure at the center,it is found that the increase in density in the region between the inversion radius and mixing radius is poloidally asymmetrical, while the increase in temperature is poloidally symmetrical.The poloidal location where the density increases is dependent on the phase of the precursory m/n=1/1 kink mode.It is always out of phase with the hot core of the m/n=1/1 mode.The behaviors of density perturbations during sawtooth collapse observed in J-TEXT are beyond the expectations of the standard model,and this can shed new light on the understanding of sawtooth collapse.
Keywords: tokamak, sawtooth collapse, polarimeter, density perturbation
1.Introduction
The so-called ‘sawtooth’ is a periodic instability that was originally reported in 1974 [1] and later observed in all tokamaks.It is recognized by the temperature slowly rising,and a fast collapse following inside the inversion radiusrs[2].This instability is expected to be beneficial to the expulsion of helium ash and other undesired impurities.On the other hand,it can also introduce harmful effects by coupling to deleterious instabilities such as neoclassical tearing modes (NTMs)and edge localized modes (ELMs) [3, 4].
The sawtooth collapse was first explained by Kadomtsev[5], in which the rise of the m/n=1/1 internal kink mode triggers a magnetic reconnection at theq= 1 surface.Then the magnetic reconnection process mixes the plasma inside the whole region within the so-called ‘mixing radius’rmix.At the same time, the temperature and density profiles would become flat withinrmix, which means the temperature and density decrease in the region within the initialrq=1and increase in the region betweenrq=1andrmix.Therefore, the inversion radius is thought to berq=1[2].The timescale of sawtooth collapse was estimated aswhich is based on the‘Sweet-Parker’reconnection model[6].Here,τAis the Alfvén time, and τris the resistive time.
However, the collapse time observed in JET in 1986 is far less than the prediction of the Kadomtsev model [7].To explain the fast collapse of sawtooth with experiments, several models have been developed.For example, the quasiinterchange mode model [8] and terms in generalized resistivity [9-11] have been proposed to explain the fast reconnection time in large tokamaks.In addition, based on the Kadomtsev model, q0should be ~1 after sawtooth collapse because the poloidal flux will completely mix within the mixing radius.The results of q0measurements in the 1980s showed that it is still below 1 after sawtooth collapse[12-14].The incomplete reconnection model [15] was proposed to explain this phenomenon.However, this model leads to another question:how is the heat in the hot core transported to the outer region without being involved in the reconnection process? The two-stage reconnection model [16] was proposed to explain this phenomenon as well as the ‘snake’behavior [17].However, none of them can generally explain the sawtooth collapse.
In experiments, the electron cyclotron emission imaging(ECEI) diagnostics system is the favorable diagnostic for sawtooth research,since it is a 2D localized measurement and can reach the center of plasma.The 2D temperature perturbations measured by ECEI in many tokamaks [18] show a closer resemblance to the reconnection model than the‘quasiinterchange mode model’.In addition, the increase of q0during sawtooth collapse is consistent with the expected small current diffusion of reconnection models [18].Nevertheless,there is still debate about whether q0is less than 1 after sawtooth collapse[19,20].However,the density evolution of sawtooth collapse lacks thorough study.
The J-TEXT tokamak was formerly the TEXT-U tokamak experiment based in Austin, Texas, which operated in the 1980s and was reassembled in 2004 in China [21].In 2014, an advanced diagnostic, the high resolution polarimeter-interferometer system (Polaris) was developed on J-TEXT, which could provide the density perturbations of a sawtooth [22].Based on the measurement of Polaris, we found that the density perturbations of a sawtooth collapse are poloidally asymmetric,because its characteristics in high field side (HFS) and low field side (LFS) channels are different.In the collapse phase, the density increase is poloidally localized in the region rs< r <rmix.The poloidal location of increasing density is always out of phase with the core region of the m/n=1/1 mode.Meanwhile, the data from the electron cyclotron emission system (ECE) and soft X-ray diagnostic system(SXR)show results similar to those of previous experiments in many tokamaks [23-27].This feature of the sawtooth collapse is common in all sawtoothing discharges on the J-TEXT tokamak.The poloidally asymmetrical density perturbations can be partly explained by the mechanism that the plasma will eject from the reconnection layer and transport to the opposite side of the X-point along the separatrix.
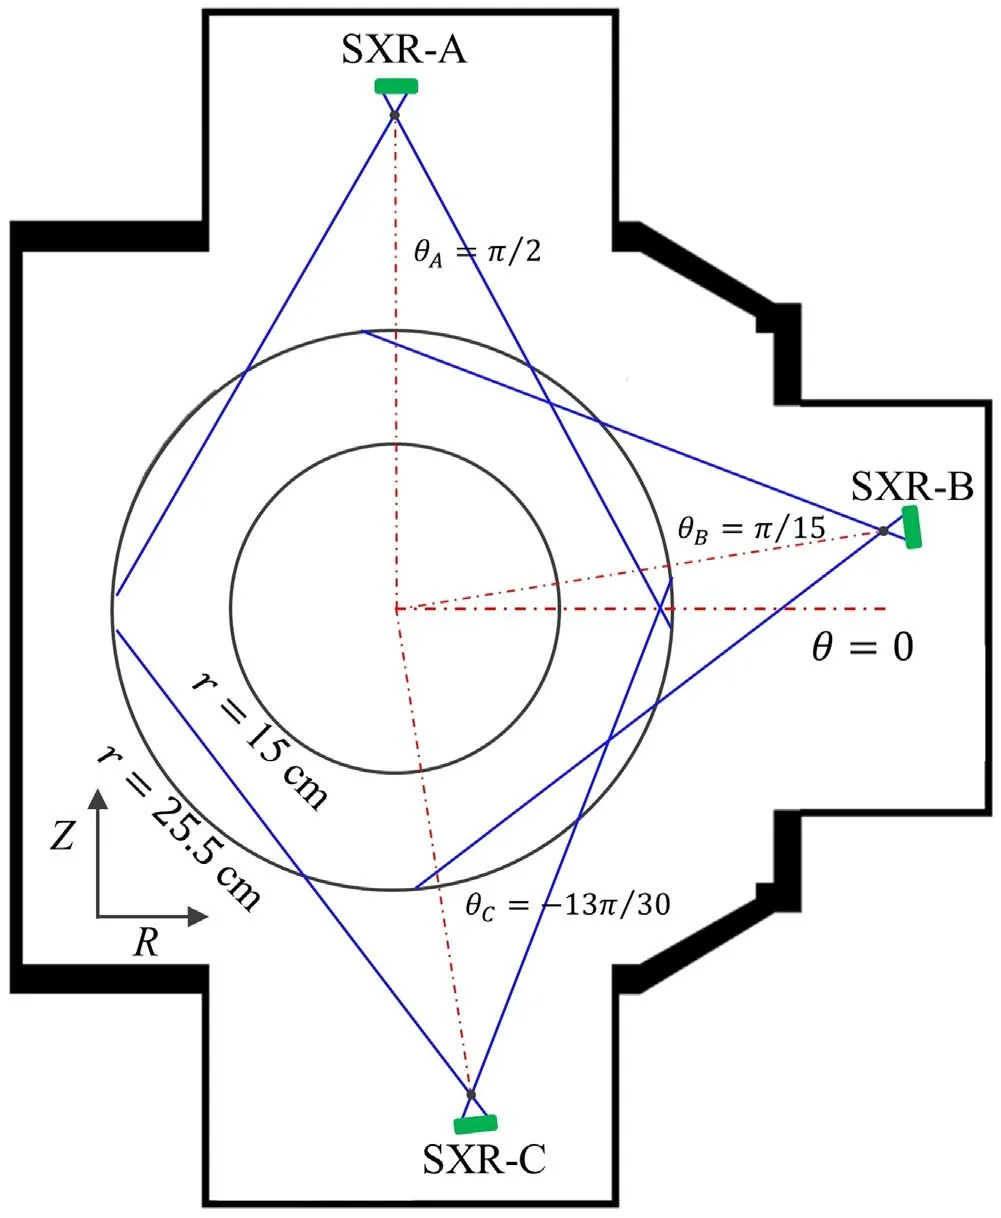
Figure 1.Layout of the three arrays which are marked as ‘SXR-A’,‘SXR-B’ and ‘SXR-C’.The poloidal angles of the three arrays are θA = π/2,θB = π/15andθC = -13π /30,respectively.
The paper is organized as follows.Section 2 introduces the experimental setup.The characteristics of the perturbations, including plasma density, SXR radiation and relative temperature perturbations during sawtooth collapse, are shown in section 3.From the perspective of statistical analysis,we discuss the physical picture in section 4.Finally,the conclusion is proposed in section 5.
2.Experimental setup
J-TEXT is a circular medium-sized tokamak with an aspect ratio of R0/ ra= 1.05 m /0.255 m [28].The Polaris system on J-TEXT could provide electron line-integral density measurements covering a whole plasma poloidal cross section with 17 vertical chords,with spatial and temporal resolutions of3 cm and10μ s, respectively.Its line-integral density resolution is 2 × 10¹⁶m-2[22].Therefore, Polaris can resolve the density dynamics associated with sawtooth collapse, which causes a central line-integrated density change Δne0·L ~ 3 × 10¹⁷m-2in J-TEXT.
The other two diagnostics used for sawtooth collapse observation are SXR and ECE.The SXR measures the lineintegrated soft X-ray radiation with 2μ s temporal resolution[29].The radiation with an energy below 300 eV is filtered by a 12 μs thick beryllium film.There are three SXR arrays applied on J-TEXT, and each array has 30 channels with 1.5 cm spatial resolution.The layout of the arrays is shown in figure 1.The ECE system provides the relative electron temperature perturbations with 1μ s temporal resolutions and~1.25 cm spatial resolution covering most of the plasma whenBT~2 T [30].The toroidal locations of the SXR,ECE and Polaris on J-TEXT are shown in figure 2.The SXR is located in port 3, ECE in port 9 and Polaris in port 11.The toroidal angle between the SXR and ECE varies by 7π/ 8,between the ECE and Polaris by π/4.
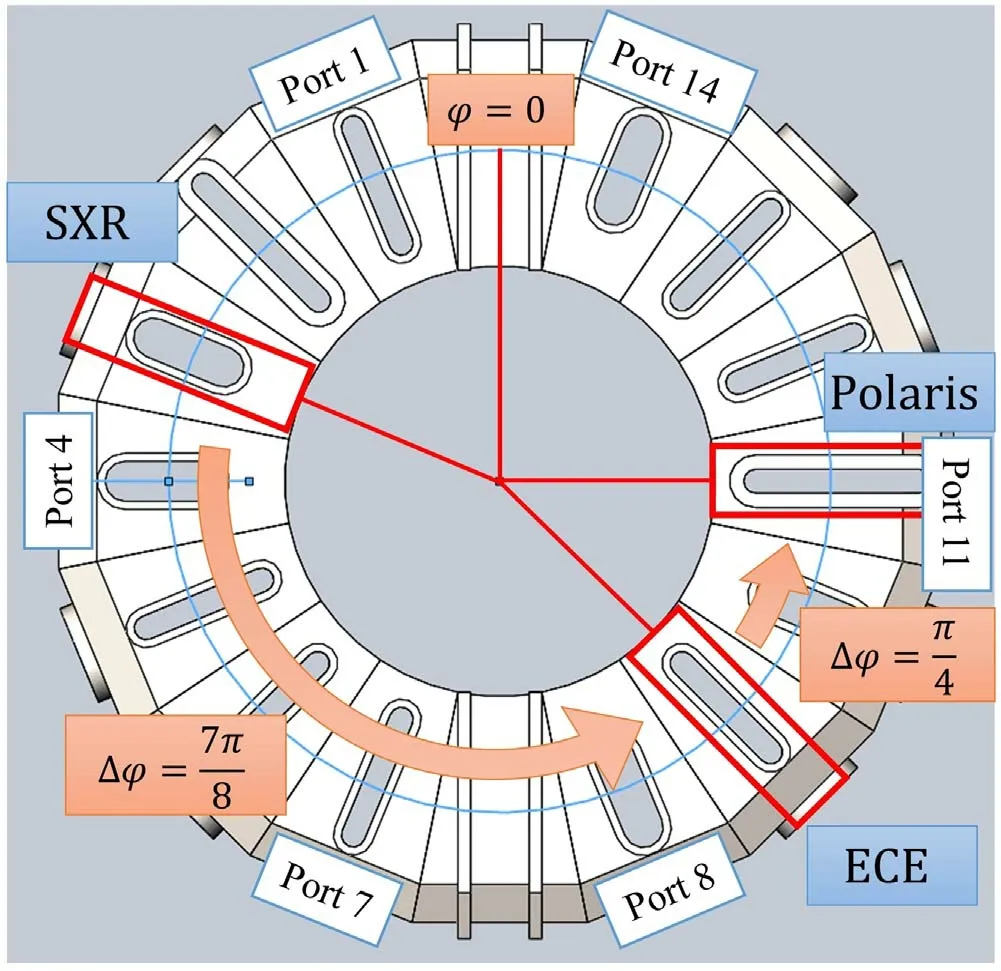
Figure 2.Top view of J-TEXT vacuum vessel and related diagnostics, which shows the toroidal positions of the SXR, ECE and Polaris systems.
3.Experimental observations
The plasma conditions during the current flat-top of the typical ohmic discharge (shot 1069673) are plasma current Ip=180 kA,toroidal feildBT=2 T,edge safety factor qa~3.44 and central line-integral densityne0·L ~1.5 × 10¹⁹m-2,line-averaged density~ 3 × 10¹⁹m-3.In this shot,/nG~0.34,wherenGis the Greenwald density limit nG(× 1020m-3) ~Ip(M A) /πa2( m)[31].This shot is a low beta discharge since it is a pure ohmic heating discharge.
Sawtooth oscillations in the line-integral density as well as the central SXR radiation and central relative temperature perturbations of a typical, sawtoothing shot are shown in figure 3.The relative temperature perturbations are calculated asΔTe/Te= (IECE- 〈 IECE〉)/〈 IECE〉,where IECEis the intensity of ECE signals and〈IECE〉is the intensity of ECE signals averaged in a sawtooth period.The sawtooth perturbations can be clearly observed in the three diagnostics.The q profile at t= 0.393 s can be estimated by an equilibrium reconstruction method[32](shown in figure 4),in which,the inversion radius can be estimated more precisely as rs~8.2 cm.It should be noted in figure 3(c) that the density perturbations in region r> rsalways show distinct characteristics in the HFS with respect to the LFS in each sawtooth event.The density always increases sharply on one side and slowly on the other side(red circle in figure 3).A similar phenomenon was observed in early experiments in TEXT[33] and TEXTOR [34].
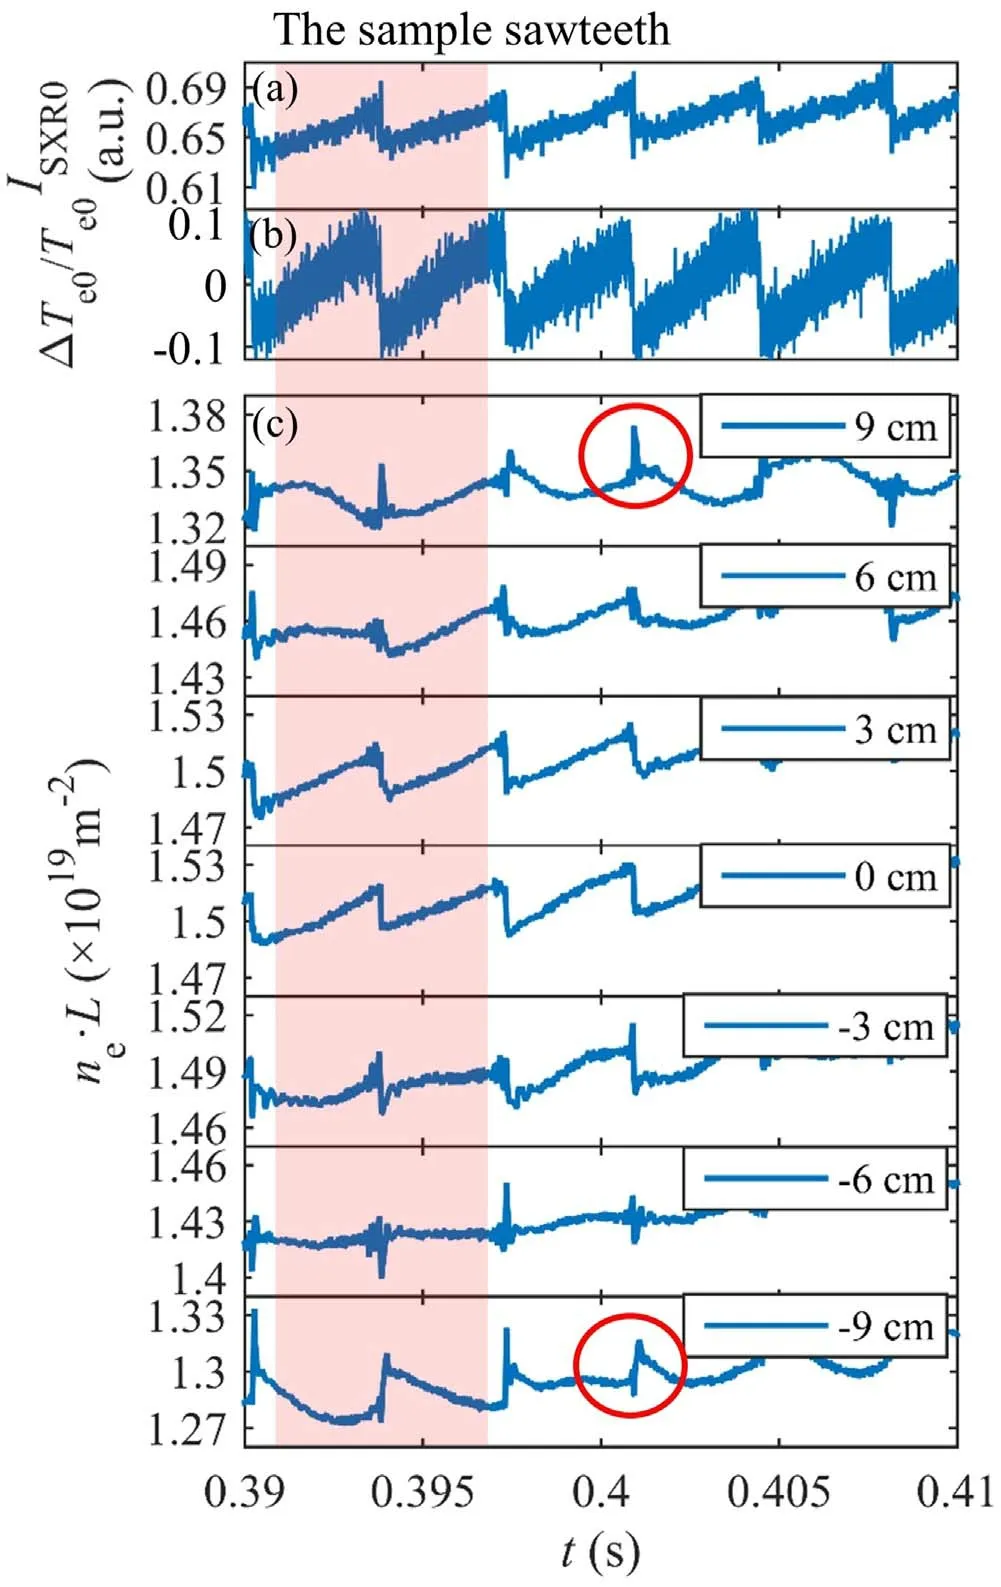
Figure 3.The sawtooth signals of the central SXR signals(a),central relative temperature perturbations (b) and line-integral electron density of the core region (c).

Figure 4.The q profile of shot 1069763 at t= 0.393 s, the red dots represent the position of q= 1 surface.
The detailed line-averaged density perturbations of the typical sawtooth collapse (red shadow region in figure 3) are shown in figure 5.The collapse started at393.80 ms (marked as dashed line 1),and ended at393.84 ms (marked as dashed line 2).The density decreased sharply in the channels at- 6 cm <r<3 cm and only increased in the channels at 9 cm <r<12 cm during the collapse.Following sawtooth collapse, the density decreased in the channels at 9 cm <r<12 cm and increased in the channels at- 1 2 cm <r<-9 cm slowly until393.98 ms (marked as dashed line 3).
The line-averaged density profiles and the inversed density profiles at the three slices marked by dashed lines in figure 5 are shown in figures 6(a) and (b).The inversed density profile is calculated by an Abel inversion method with an extra cos θ term to express the asymmetry in the poloidal direction (the method has been introduced in[35]).It is evident that the density profile leans toward the LFS at 393.84 ms and then recovers the symmetry at 393.98 ms.This density profile change during sawtooth collapse is similar to the density profiles measured by the Thomson scattering system on MAST[36].Considering that the inversion of the density profile is based on some ideal models and that remainder of this article focuses on the perturbations of density,the analysis in the following will still use the raw data of the line-averaged density.
The perturbations of density,SXR and temperature in the typical sawtooth collapse are shown in figure 7.In figures 7(b)-(d), the baseline for the three diagnostics is the average value in each channel over the whole sawtooth period.The radial continuity is realized by linear interpolation.The long dashed lines labelled ‘1’ and ‘2’ correspond to the initial and end times of the collapse (393.80 ms and 393.84 ms, respectively).The black dot-dashed lines are the fitting lines of the core-region of the m/n=1/1 precursor with a sine function.
Some illustrations of figure 7 can be given below:
(1) The collapse starts simultaneously in the three diagnostics.It is thought to be the consequence that the time difference of the collapse at different toroidal positions is indistinguishable because the parallel transport characteristic time is far less than the temporal resolution of diagnostics.Thus, the profiles obtained during sawtooth collapse in the SXR, ECE and Polaris can be thought to be simultaneous.
(2) In the precursor phase (before dashed line 1 in figure 7),the precursor perturbations can be observed in density,temperature and SXR.The SXR signal seems to be out of phase with respect to density and temperature.This is reasonable given the diagnostic toroidal positions (blue dashed line in figure 8) and the structure of the core region of the m/n=1/1 kink mode (red region in figure 8).

Figure 6.(a) The line-averaged density profiles at 393.80 ms (blue line with square), 393.84 ms (red line with circular) and 393.98 ms(green line with diamond).They correspond to time points 1,2 and 3 in figure 5.(b) The density profiles of the Abel inversion at 393.80 ms (blue line), 393.84 ms (red dashed line) and 393.98 ms(green dot dashed line).
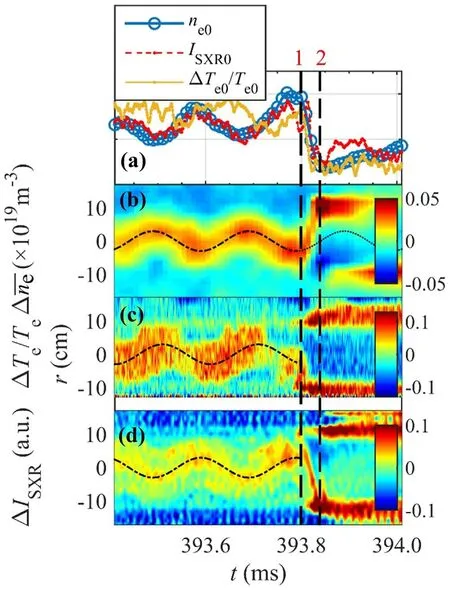
Figure 7.The perturbations of density, temperature and SXR.(a)The perturbations of the central density,SXR and temperature of the sawtooth collapse; (b) the structure of line-averaged density perturbations; (c) the structure of relative temperature perturbations;(d) the structure of SXR perturbations.The long dashed lines labelled 1 and 2 represent the time when collapse started and ended.The black dot-dashed lines are the fitting lines of the core-region of the m/n=1/1 precursor with a sine function.The extension of this fitting line in (b) shows that the phase change of the m=1 perturbations during collapse is faster than that in the precursor.
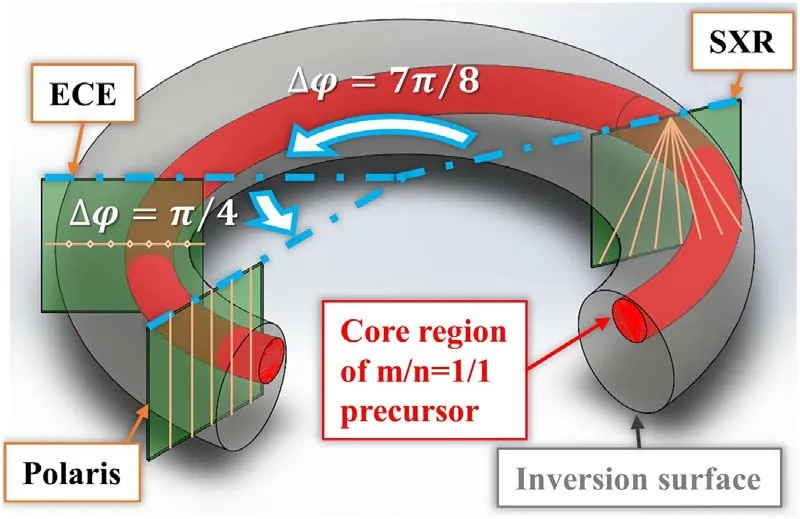
Figure 8.Toroidal positions of ECE,SXR,and Polaris and sketch of the core region of the m/n=1/1 mode.
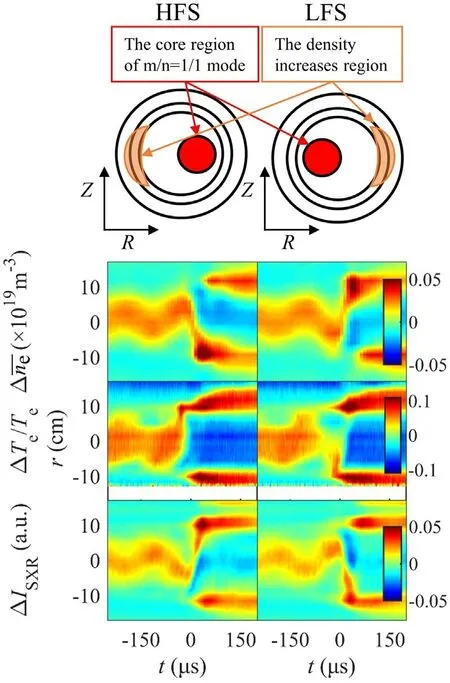
Figure 9.The sketch of the core region of the m/n=1/1 mode and the region where density increases during collapse at the measurement cross section of Polaris.The title ‘HFS (LFS)’ represents the result from all the sawteeth in which the density would increase in HFS(LFS)during collapse in a typical shot.The statistical results of the line-averaged density, relative temperature perturbations and SXR perturbations.
(3) In the collapse phase (between dashed lines 1 and 2 in figure 7),the density increases only in the LFS of the region between the inversion radius and the mixing radius.The core region of the m/n=1/1 precursor is located on the HFS at the initial time of collapse.A trajectory which connects the core region of the precursor and the region where density increasing can be clearly observed.It seems that the density perturbation maintains an m=1 symmetry,but its poloidal phase flips by π during the collapse duration(~40μs),a time that is far less than half the period of the m/n=1/1 precursor (~120μs).Meanwhile, the temperature and SXR signals increase on both sides of the regionrs<r<rmixsimultaneously.The characteristics of the ECE signal and SXR signal show no difference from previous research in many tokamaks [23-27].
To ensure that the phenomenon we observed did not happen by chance under a special condition in plasma, we perform a statistical analysis for all sawteeth in shot 1069673.We classify all sawteeth (total number 71) into two groups by dividing them according to the side(HFS or LFS)where density is first observed to increase beyondr.sThe origin of the time axis of each sawtooth is set as the moment when the collapse started.The perturbations are averaged over all the sawtooth cycles in each group, as shown in figure 9.This statistical analysis result shows the same characteristics of density, relative temperature perturbations and SXR perturbations of figure 7.The density perturbations are polodially asymmetrical.During sawtooth collapse, the density only increases in the opposite poloidal location relative to the core-region of the m/n=1/1 precursor right before the collapse happen.
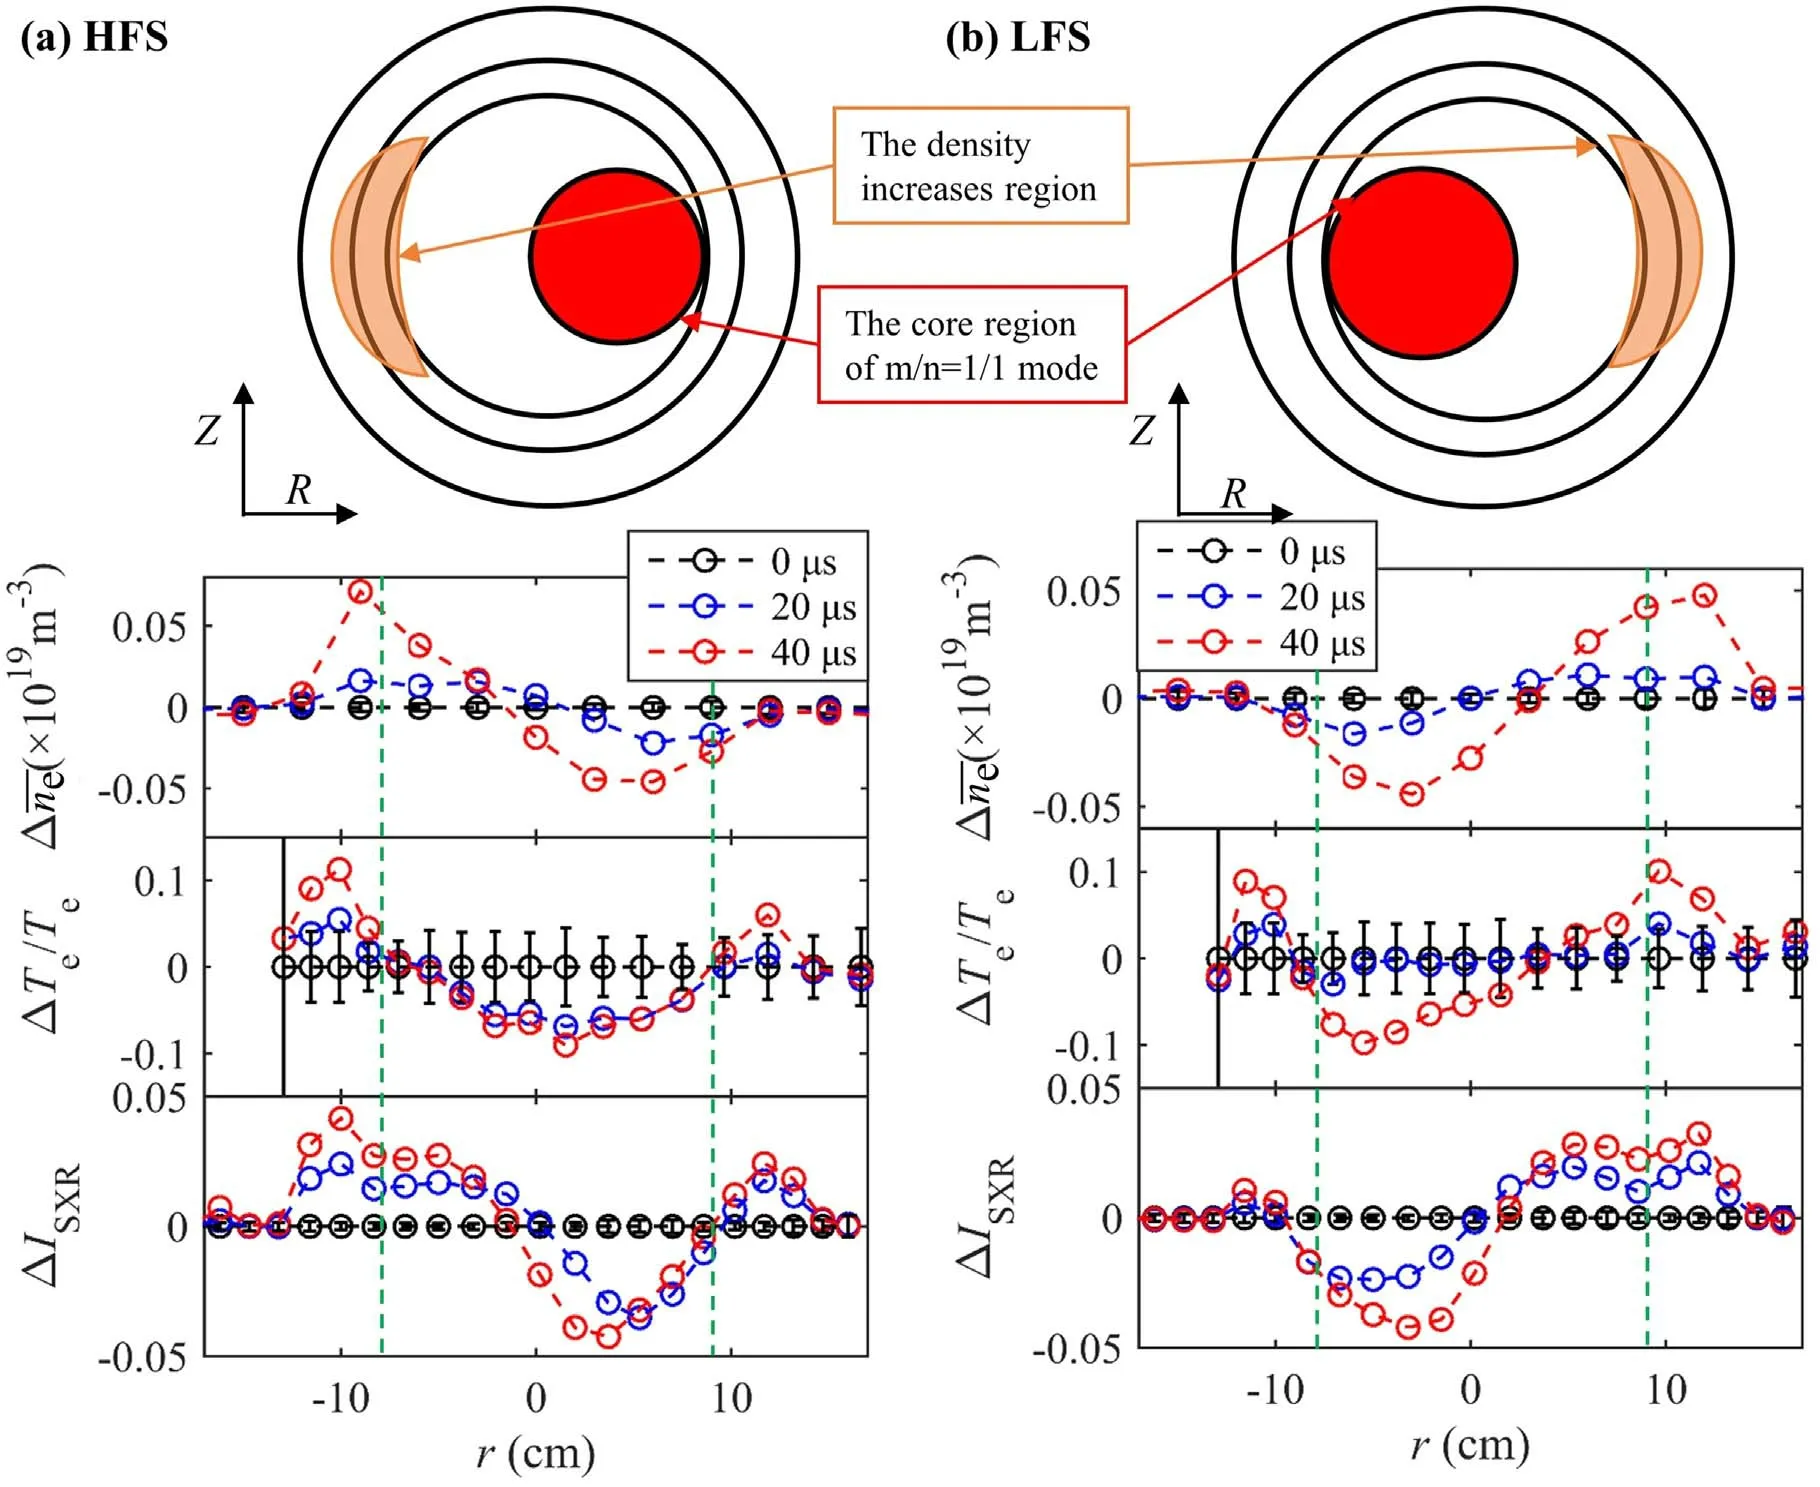
Figure 10.Sketch of the core region of the m/n=1/1 mode and the region where density increases during collapse at the measurement cross section of Polaris.The statistical perturbation profile for the sawtooth in which the density increases in HFS(a)or LFS(b).The SXR signals reversed the HFS channels and LFS channels.The black dashed line is the perturbation profile at collapse started and set as the baseline.The green dashed lines represent the rq= 1 according to figure 4.
4.Analysis and discussion
Since the perturbations of sawtooth in the three diagnostics can be considered to occur simultaneously,the characteristics of perturbations depend only on the m/n=1/1 precursor phase at the diagnostic toroidal position, which is a remarkable simplification due to the circular cross section of J-TEXT.Thus,we can swap the SXR signals in HFS and LFS to compare the characteristics of density, temperature and SXR perturbations.The values of density, temperature and SXR at collapse start are set as the baseline.The perturbation profiles of the collapse phase are shown in figure 10,in which the profile at20μs after collapse starts is added.
If we follow the description of the reconnection model,the X-point is located at the intersection of the core region of the m/n=1/1 kink-tearing mode and the inversion surface.The heat flows along the separatrix through the X-point beyond the inversion surface to the whole region inside the mixing radius when collapse happens [37-39].The relative temperature perturbations during sawtooth collapse matched this physical picture.Since the poloidal flux is mixed in the region within the mixing radius in both the HFS and LFS,the density perturbations should have symmetric behavior similar to that of the temperature and SXR.However, the density perturbations of sawtooth collapse do not follow this ratiocination.Considering that sawtooth collapse is not an adiabatic process, meanwhile, the particle is conservative in the core of the plasma.We think the density perturbations are more representative of the transport process in sawtooth collapse.
The mechanism in the two-stage reconnection model provided by Biskmap[16]is able to account for the poloidally asymmetrical density perturbations observed on J-TEXT.Here, the sketch is presented as shown in figure 11.This mechanism is described as follows.A Kadomtsev-type reconnection would happen first at the intersection of the core region of the m/n=1/1 kink-tearing mode and the inversion surface.The plasma in the core region would keep inward into the X-point, which can be assumed to be the Sweet-Parker type reconnection layer (the blue region in figure 11)[6].During the reconnection,the poloidal flux with plasma of hot core would flow into the reconnection layer and eject along the separatrix (red arrow in figure 11) with Alfvén velocityVA.Since the dissipative processes are weak in the high temperature plasma, this poloidal flow would maintain its kinetic energy and transport particles to the region on the opposite side of the X-point (the yellow region in figure 11).
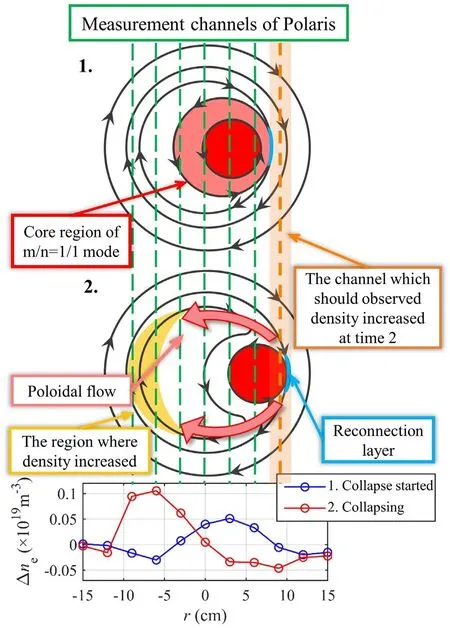
Figure 11.Sketches of the magnetic surfaces as well as the parallel flows of plasma at time 1 (the start of collapse) and time 2 (in the process of collapse).In the bottom diagram, the blue line is the density perturbations at the start of collapse and the red line is the density perturbations during collapse happening.The baseline is set to be the average value of the whole period of a sawtooth.
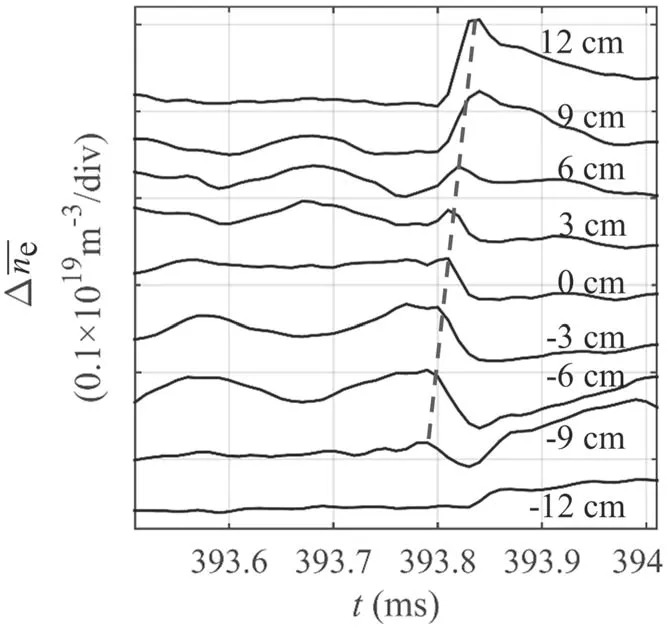
Figure 12.Trajectory (dashed line) of density perturbations during sawtooth collapse.
This mechanics could explain the density increases in the opposite side of the X-point.Furthermore, the ‘trajectory’ of density perturbations from the hot-core region to the opposite side during the collapse(dashed line in figure 12)matches the structure of the poloidal flow.However,some puzzling details still need to be clarified for a more reliable explanation,which is left for future study.For example, the kinetic energy of poloidal flow comes from the magnetic reconnection process.If the poloidal flow transported a large number of particles to the opposite side,the hot core should move outward from the previous q=1 surface and make the density slightly increase in the regionr>rsand close to the X-point (orange channel in figure 11) with the reconnection process, which cannot be observed on J-TEXT (bottom diagram in figure 11).
5.Conclusion
We report detailed measurements of density perturbations during a sawtooth collapse in the J-TEXT tokamak,using an advanced multi-channel polarimeter-interferometer system(Polaris).It is shown that the density perturbations in the region between the inversion and the mixing radii always increase only on the opposite side with respect to the m/n=1/1 mode X-point during sawtooth collapse.At the same time, the local measurement of relative temperature perturbations and the line-integrated SXR signal increase symmetrically in the region ofr>r.sThe temperature perturbations are consistent with the previous experimental observations and the description of the standard physical picture.However, some additional mechanism is needed to explain the poloidally asymmetrical density perturbations during sawtooth collapse.Here, we think the poloidal flow mechanism can explain the density perturbations in principle.
Acknowledgments
This work is supported by the National MCF Energy R&D Program of China (No.2018YFE0310300) and National Natural Science Foundation of China (No.51821005).
猜你喜欢
小作家报·教研博览(2022年14期)2022-05-23
小作家报·教研博览(2022年14期)2022-05-23
ViVi美眉(2020年1期)2020-04-26
小学生必读(低年级版)(2018年10期)2019-01-04
黄钟-武汉音乐学院学报(2018年3期)2018-11-06
小学生必读(低年级版)(2018年4期)2018-08-01
小学生必读(低年级版)(2017年10期)2018-01-27
百家讲坛(蓝版)(2017年9期)2017-11-09
辽金历史与考古(2017年0期)2017-02-06
作文大王·低年级(2016年3期)2016-03-11
 Plasma Science and Technology2023年3期
- Plasma Science and Technology的其它文章
- Relativistic toroidal light solitons in plasma
- Valley-dependent topological edge states in plasma photonic crystals
- Bulk moduli of two-dimensional Yukawa solids and liquids obtained from periodic compressions
- Modeling of magnetized collisional plasma sheath with nonextensive electron distribution and ionization source
- Alfvén continuum in the presence of a magnetic island in a cylinder configuration
- Fluid simulation of the effect of a dielectric window with high temperature on plasma parameters in inductively coupled plasma