
Numerical Simulation of Trace Water Icing Characteristics on Airfoil Under Cryogenic Conditions
2023-05-21 02:37,*,,,
,*,,,
1.School of Energy and Power Engineering,Xi’an Jiaotong University,Xi’an 710049,P.R.China;
2.Facility Design and Instrumentation Institute,China Aerodynamics Research and Development Center,Mianyang,621000,P.R.China
Abstract: Compared with conventional wind tunnels,cryogenic wind tunnels can supply testing airflow with higher Reynolds numbers.However,the residual trace water vapor in the cryogenic wind tunnel may affect the accuracy of aerodynamic data at low temperatures.Due to the difficulty of experimental methods,the characteristics of trace water icing still need to be revealed.Based on the Eulerian method,a multiphase flow model of wet air,subcooled droplets and ice crystals is established in this paper.The icing process caused by subcooled droplets and ice crystals condensed from water vapor on the airfoil under the condition of cryogenic wind tunnels is simulated.The results show good consistency with experimental data.The effects of the total water content,melt ratio,airflow temperature,pressure,Mach number and other parameters on icing process are analyzed,and the effects of the airfoil icing on aerodynamic characteristics are also quantified,which may provide a theoretical reference for the actual operation of cryogenic wind tunnels.
Key words:cryogenic wind tunnel;trace water;airfoil icing;numerical simulation
0 Introduction
The wind tunnel is an indispensable equipment to study the aerodynamic characteristics of complex viscous flow field around the test article.In the thriving aerospace industry,the research and development of aircraft and space vehicles put forward urgent requirements for the capability of wind tunnels to operate at high Reynolds numbers.It is difficult for conventional wind tunnels to realize a further increase of the Reynolds number.Problems such as power consumption and structural strength may be caused by increasing the tunnel size or operation power.At present,it is considered that the most effective way is to cool down the gas medium,reduce the viscosity and increase the density,thus to achieve much a higher Reynolds number and a lower power consumption.Liquid nitrogen is sprayed into the tunnel to cool down the gas,and the internal temperature ranges from 110 to 320 K[1].The water content of 1×10⁻⁶corresponds to the dew point of 197 K.When the wind tunnel is running at the lowest operating temperature of 110 K,the remaining water in the airflow will still exist in the form of ice crystals or supercooled droplets,which may result in frost on the test article or equipment.In order to achieve an ultra-low dew point and prevent water vapor from condensation or desublimation into droplets or ice crystals,the water content in the airflow should be reduced to less than 1×10⁻⁶before experiments,leading to much more stringent operating conditions of the wind tunnel.Therefore,mastering the icing mechanism of water vapor in the cryogenic wind tunnels and quantifying the frost formation could provide a technical support for optimizing the operating process of cryogenic wind tunnels,ensuring the accuracy of aerodynamic data and preventing damage from instruments.
The mechanism of airfoil icing has been studied through the ground test or the numerical simulation.The ground test requires the support of icing wind tunnel system and has the disadvantages of difficulties in simulating the meteorology conditions in the atmosphere,high cost,etc.Recently,the numerical simulation has become an important method for its low cost in manpower,material resources and time.
In experimental studies,experiments on icing under mixed-phase or glaciated conditions have been carried out with the help of wind tunnels.In order to study the effect of icing conditions on the performance of thermal ice protection systems and ice crystals’ behavior on the airfoil,Al-Khalil et al.[2]conducted experiments of mixed-phase and glaciated icing at different temperatures and water contents.They divided the icing conditions into glaze condition and rime condition according to geometric features and texture of ice accretion.They also found that ice crystal erosion could significantly weaken the ice accretion process.Mason et al.[3]experimentally simulated the warm air or cold ice conditions of glaciated icing in jet engines.The results obtained from operations under different airflow temperatures illustrated that ice was only formed on the airfoil when liquid water existed,i.e.under mixed-phase conditions.Currie et al.[4]experimentally quantified the mixed-phase sticking efficiency for ice crystal accretion.The results showed that the sticking efficiency was highly correlated with the ratio of liquid water content(LWC)to total water content(TWC)in the airflow,reaching a maximum value when the melt ratio fell in a specific range.The reason was that sufficient ice crystals were needed to cool down the airfoil surface below the freezing point,and liquid water should be present on the airfoil for ice crystals to effectively adhere to the surface.In addition,the erosion effects of ice crystals will narrow down the range.Baumert et al.[5]carried out experimental investigations into mixed-phase icing at the Icing Wind Tunnel Braunschweig.According to the data,the ambient temperature influenced the icing process to a great extent,and the sticking efficiency of ice particles was dependent on the melt ratio,which agreed with the previous literature[4].
For the numerical simulation,several models have been proposed to predict the physical behaviors in the icing process.Villedieu et al.[6]testified the capabilities of IGLOO2D to simulate the glaciated and mixed-phase ice accretion.The software considers some phenomena ignored before,such as heat transfer between air and particles,evaporation and melting,particles’ behavior when impinging dry and wet surfaces,etc.The authors simplified the movement and melting process of ice crystals into three stages and created governing equations based on the thermodynamic characteristics of the stages.They defined the particle sphericity to represent the irregularity of the particle shape,and improved the drag coefficient model and the heat transfer model.Considering the effect of erosion caused by ice crystals,Trontin et al.[7]improved the ice crystal sticking efficiency model,and corrected the empirical parameters according to the experimental findings of Currie et al.[4]Then,the numerical simulations of supercooled large droplets,ice crystals and mixing conditions were carried out.The proposed model could well predict the ice shape under a wide range of icing conditions,and could reproduce the distinctive feature of icing plateau phenomenon.Bu et al.[8]extended the Messinger’s model[9]to the mixed-phase icing applications by analyzing the heat and mass transfer on the airfoil under mixed-phase conditions.A sticking efficiency correlation of ice particles was also added to the classical model to take into account the sticking effects of ice particles.As for numerical analyses into the mechanism,Qi et al.[10]studied the influence of temperature and content of water vapor on the desublimation process under constant Mach and Reynolds number conditions.The results showed that the maximum nucleation rate and maximum ice mass fraction increase with the temperature and water vapor content in the freestream,and the water vapor content had a more significant effect on it.The authors also categorized the desublimation process of water vapor into two patterns.The difference was whether the water vapor desublimated or not in the upstream of the airfoil.
Previous studies have been focused on airfoil icing in the atmosphere.In order to solve the “moisture contamination” problem in cryogenic wind tunnels,it is also necessary to investigate the icing process of trace water under cryogenic conditions.In this study,the icing characteristics of trace water on airfoil in cryogenic wind tunnels are discussed by means of numerical simulation.The validated model is used to explore the icing process considering the effects of total water content,melt ratio,airflow temperature and pressure,Mach number,surface roughness and icing duration.
1 Numerical Method
1.1 Ice accretion model
On the airfoil surface,a liquid film may be formed due to impinging droplets.The droplet may freeze immediately after impingement,or part of them may freeze,the other part of the water gradually freezes while flowing to nearby surfaces.The film may run back,forced by the airflow shear stress,centrifugal force,or gravity.Based on the classical Messinger model,the liquid film icing process is modeled[11].Fig.1 shows the heat and mass transfer phenomena modeled when solving for ice accretion and runback.
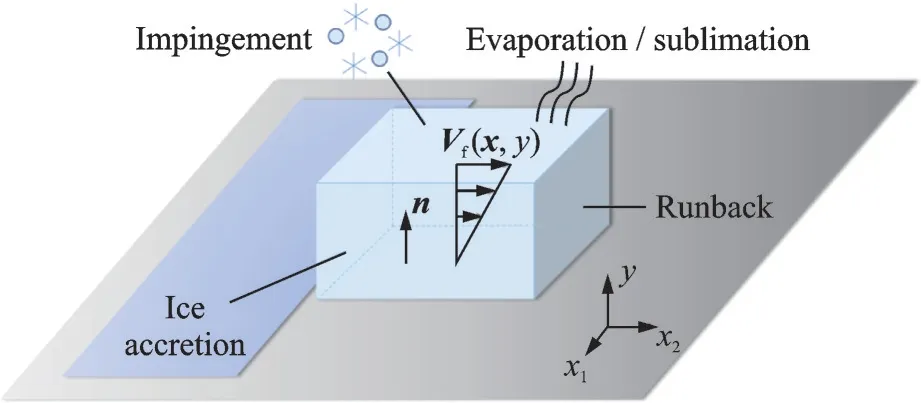
Fig.1 Water film icing model on a solid surface
Based on the operating parameters and surface conditions,part of the film may freeze,evaporate or sublimate.The height of the liquid film can be determined at all grid points on the solid surface,and the velocity is a function of the coordinatesx=(x1,x2) on the surface andynormal to the surface.The problem is simplified by introducing a linear profile for the film velocityVf(x,y) normal to the wall,with zero velocity imposed at the wall
whereτa,wall(x) is the air shear stress,which is the main driving force for the film;andμfthe film dynamic viscosity.By averaging the film velocity across the film thickness,a mean velocity can be derived as
wherehfis the film height.
Two PDEs are solved on all solid surfaces.
The first one is the mass conservation equation
whereρf,,represent the film density,evaporative mass flux and instantaneous mass accumulation of ice in the control volume,respectively.The three terms on the right-hand side correspond to the mass transfer by water droplet impingement,evaporation and ice accretion.The second partial differential equation(PDE)is the energy conservation equation
wherecfandcscorrespond to the specific heat capacity of water film and ice,respectively;are the equilibrium temperature and the recovery temperature,respectively;LevapandLfusionthe latent heat of evaporation and fusion,respectively;Qanti-icingis the anti-icing heat flux.The first three terms on the right-hand side correspond to the heat transfer generated by the impinging supercooled water droplets,evaporation and ice accretion,respectively.The last three terms are the radiative,convective and conductive heat fluxes.
Compatibility relations are needed to solve the equations set
Eq.(5)ensures that there is no liquid film when the equilibrium temperature is below the freezing point,and that no ice is formed if the film is above the freezing point.
1.2 Ice roughness model
Ice roughness will affect the flow pattern and heat transfer on the surface,which may change the morphology of the ice accretion layer[12].Experimental evidence shows that there are ice beads existing on the solid surface[13].They will keep stationary temporarily to grow or coalesce into larger beads.
The roughness distribution is calculated by a beading model[14].It is assumed that approximately 85% of the local grid facet is covered by the ice beads,and the equivalent sand-grain roughness height is equal to the bead height.The local critical bead height is calculated using the shear stress and pressure gradient data from the airflow solution.When the bead height reaches the critical value,in wet zones,the bead will stop growing and run back through the grid cells.In dry zones,the bead will completely freeze and stop growing.
The critical bead height is computed from the force analysis.Neglecting the internal pressure,a bead is under the action of the gravitational force component parallel to the surfaceFg,the component of surface tension along the moving axisFσ,the pressure drag forceFp,and the friction drag forceFτ.The balance of the forces is given by
Once the balance is disturbed,the bead starts moving,and the bead height at this time is defined as the critical height.Every term in Eq.(6)is expressed as the polynomial function of the bead heighthb,and the smallest positive root of the equation is the local critical bead heighthb,cr.
The total wetted areaAweton the grid facet is expressed as
whereAbandNbrepresent the wetted area of a single bead and the number of beads,respectively.Nbis calculated by
whereMbeadlayer,Vb,ρbare the total mass of bead layer,the volume and density of a bead,respectively.The initial value ofAwetis zero,and it will grow larger with time.WhenAwetreaches the maximum ratio 85%,hbwill increase due to the continuously impinging droplets and the coalescence of small beads,andNbwill decrease.Nbwill be recalculated by Eq.(8).Ifhb≥hb,cr,the beads in that grid are assumed to stop growing.Ifhb<hb,cr,the bead height is calculated withMbeadlayer,Nbandρb.
1.3 Calculation flow and algorithm
The governing equations above are discretized by the finite element method and solved in the software Ansys Fluent Icing.The turbulence model is Spalart-Allmaras,which is designed specifically for aeronautics and aerospace applications involving wall-bounded flows.It is shown to generate good results for boundary layers subjected to adverse pressure gradients.An approach based on unidirectional coupling Eulerian two-phase method is developed to compute the airflow and the movement of droplets and ice crystals.The temperature and velocity of droplets and crystals are assumed to be equal to that of the airflow.Due to the minuteness and sparsity of the particles,it is considered that they do not affect the macroscopic flow field.
The icing process is calculated with a multiple quasi-steady approach,i.e.multi-shot,as shown in Fig.2.A multi-shot run executes four solvers in sequence.First,the impingement of droplets and ice crystals is computed in the module DROP3D.Second,the results obtained such as droplet collection coefficient and crystal sticking fraction will be imported to the next module ICE3D to perform ice accretion calculation.Thrid,the ice thickness and surface roughness data are used for mesh update and flow calculation in the ensuing shot.The entire process is repeated until the icing duration reaches the preset value.This approach is designed to simulate the evolving flow field as accurately as possible.Therefore,the number of shots depends on the influence of ice on the flow field.
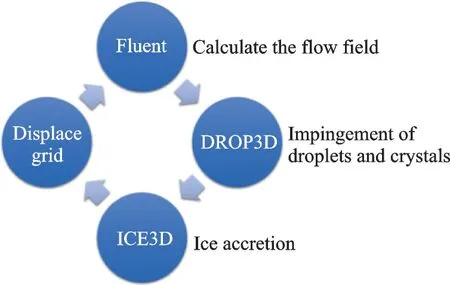
Fig.2 Process of multi-shot
1.4 Computational domain and grid generation
According to the profile data of NASA SC(2)-0610 airfoil,a two-dimensional computational domain with a pressure-far-field boundary condition is established,as shown in Fig.3.C-shaped structured mesh is chosen in the meshing.The chord length of the airfoil is 0.1 m.The mesh is refined near the airfoil,as shown in Fig.4.Non-slip boundary condition is adopted on the airfoil surface.
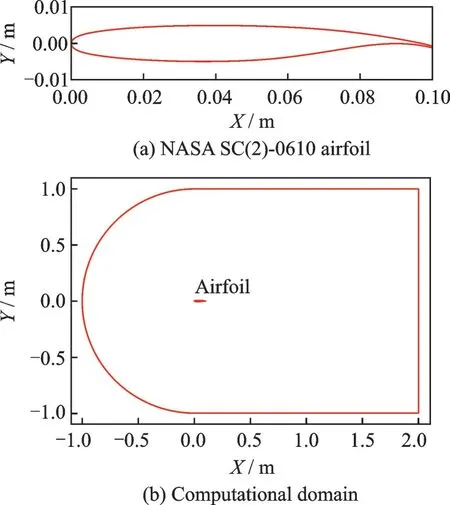
Fig.3 Profile of airfoil and computational domain

Fig.4 Mesh details
1.5 Parameter setup
Due to the extremely low temperature in the cryogenic tunnel,the water content is proved to be supersaturated for most working conditions in this study.The fractional pressure of water vapor is assumed to be equal to the saturated vapor pressure.Since the airflow velocity is high,the stagnation process is assumed to be adiabatic.After analyzing the thermodynamic process which vapor and ice crystals undergo,it is assumed that the vapor would not condense or desublimate and ice crystals would not melt in all working conditions in this paper.Hereby,only the icing process of droplets and ice crystals is carried out in the simulation.
It is generally considered that ice crystals will not frost on dry and cold surfaces without liquid water[3].However,frost on the airfoil observed during the operation of the cryogenic wind tunnel at about 200 K indicates the possible existence of liquid water in the airflow under such extreme conditions.Manka et al.[15]found that a small fraction of the nanosized droplets remained unfrozen far below 200 K in an experimental determination of quenched droplets.Sellberg et al.[16]examined the structure factors of water in micron-scale droplets cooled to about 227 K.Even under such conditions,a few droplets(100—3 600)remained liquid over a time span of a few milliseconds.In addition,most of the temperature range of cryogenic wind tunnels falls in the region of “Supercooled liquid water”,“No man’s land” or “Ultra-viscous liquid” in the phase diagram of non-crystalline water[17],as shown in Fig.5.Therefore,it can be inferred that deep supercooled liquid water may still exist in the cryogenic wind tunnel.As a preliminary attempt,the simulation method of mixed-phase icing can be adopted to study the icing process in the cryogenic wind tunnel,assuming that LWC≈0.03(TWC-VWC)and ice crystal content(ICC)=TWC-VWC-LWC in this paper,where VWC represents the vapor water content.The ratio 0.03 is derived from Sellberg’s experimental data.
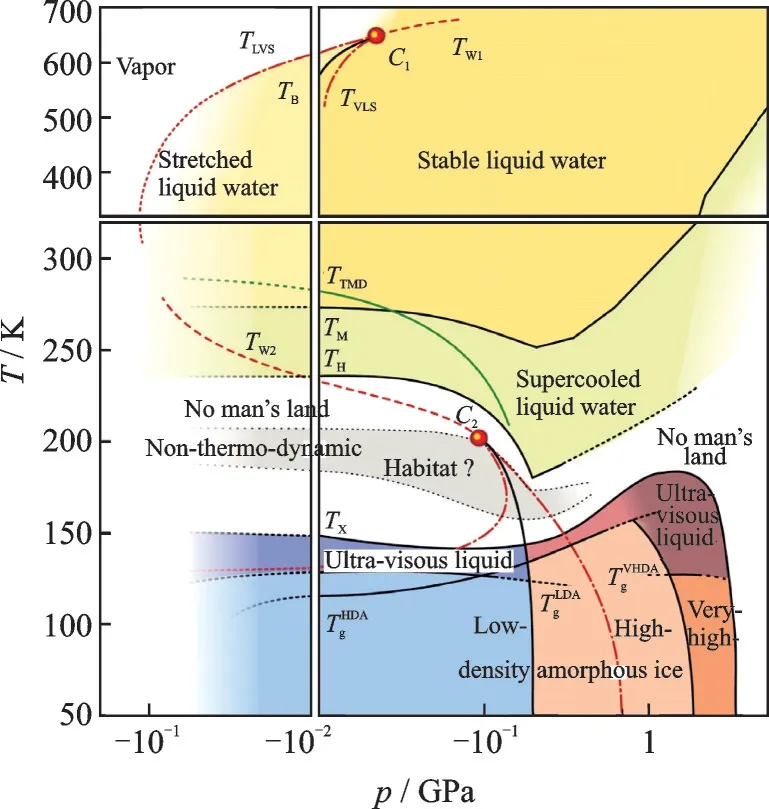
Fig.5 Phase diagram of non-crystalline water[17]
Parameters of the reference condition are shown in Table 1,where the unit of TWC “1×10⁻⁶”represents the mass fraction of water in air.In each experiment,only one parameter is variable,while other parameters remain unchanged.
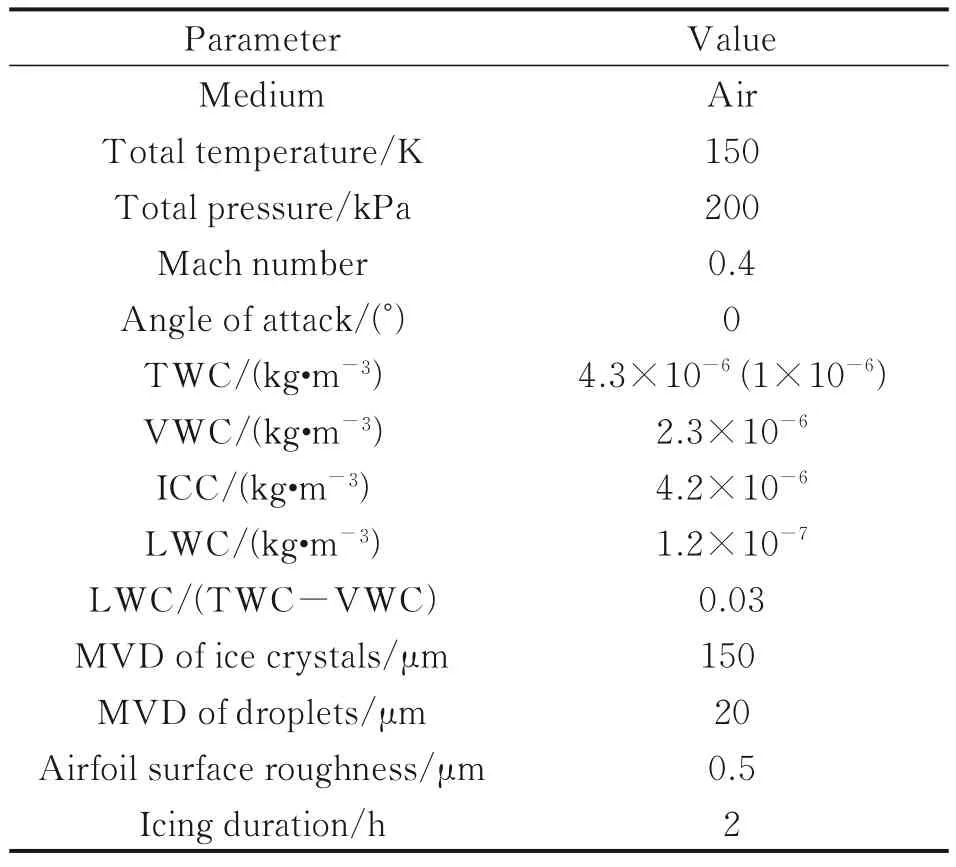
Table 1 Parameters of the reference condition
2 Results and Discussion
2.1 Grid independence validation
Meshes of different grid density are used to calculate the aerodynamic data of the original NACA0012 airfoil.As can be seen from Fig.6,the mesh with 370 000 grids is suitable for calculation with drag coefficient variation less than 1%.
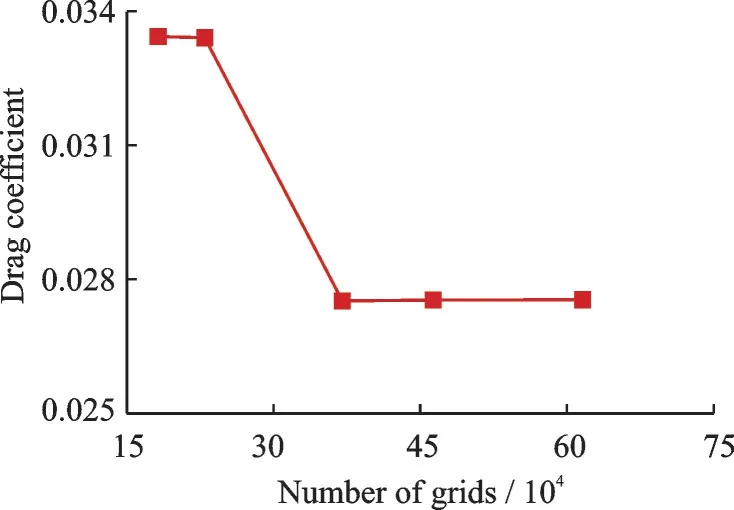
Fig.6 Grid independence validation
In the icing calculation,different numbers of shots are carried out to ensure that it has little effect on the results.As shown in Fig.7,Run 19 is taken as an example,the ice shape of 2 shots is approximate to that of 3 shots,and the mass deviation of the accumulated ice is about 1%.Therefore,it can be considered that the calculation of 2 shots is appropriate.
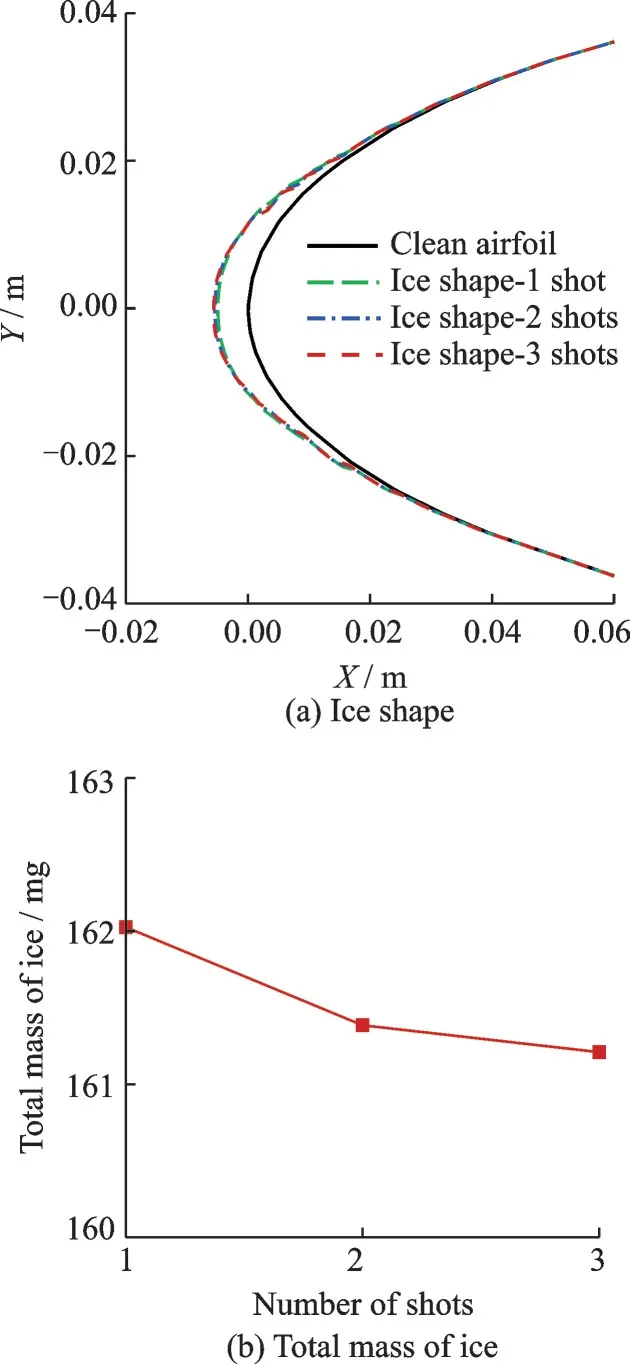
Fig.7 Results of different number of shots (Run 19)
2.2 Model validation
An icing experiment is conducted on NACA0012 airfoil with chord length of 91.44 cm in the Cox &Co.Icing Tunnel in Ref.[2].According to two groups of parameters in Ref.[2],i.e.Run 10 and Run 19,as shown in Table 2,the same parame-ters are used in the software to simulate the icing process.
As for Run 10 and Run 19,numerical results of 3 shots and 2 shots are used to compare with the experimental data respectively.In Fig.8,it is shown that the calculated results are in good agreement with the experimental data,with average deviations of 22% and 15%,respectively,indicating that the numerical model has a relative high accuracy.
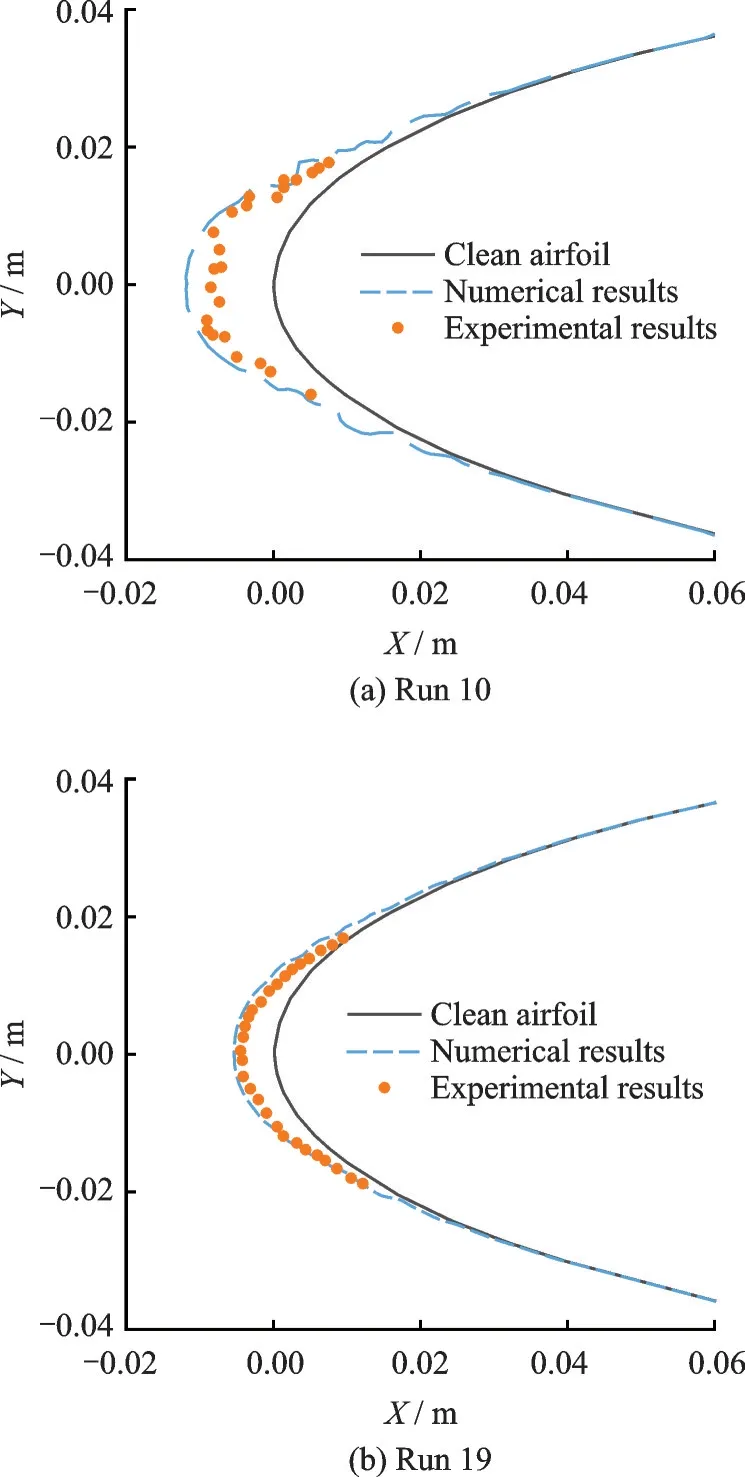
Fig.8 Comparison of ice shape
2.3 Effects of TWC
Figs.9(a,b)show the profiles of ice accretion layers under different TWC.For TWC between 0.1×10⁻⁶to 10×10-6,the type of the ice accreted is rime ice.This is characterized by regular ice shape and ice accumulation at the leading edge,which has little disturbance on the aerodynamic characteristics of the airfoil.When TWC≥50×10-6,the ice shape becomes irregular,the type changes from rime ice to mixed ice with obvious concave and protruding geometric features,and the boundary of the ice extends to the middle part of the airfoil.The characteristic of mixed ice is that,due to insufficient heat transfer near the leading edge,glaze ice with a higher density will occur.It is not easy to be eroded,so the profile is smooth.In the middle of the airfoil where heat transfer is more sufficient,the loose-textured and low-density rime ice will occur,which is easy to be eroded by ice crystals.Therefore,the local profile is not smooth on microscopic level.In addition,there is ice near the trailing edge in each working condition.The local ice thickness under 200×10-6condition is about 0.2 mm.
In case of TWC=200×10-6,there is an untypical ice accretion in a mushroom shape with a sharp edge in the middle of the accretion.This accretion can be regarded as the cone-shaped product of continuous condensation of droplets on the basis of hemispherical ice accretion with TWC=50×10-6—100×10-6.According to the erosion model established by Trontin et al.[7],it is assumed that the erosion mainly depends on the tangential velocity of the impinging ice crystals.Therefore,more serious the erosion appears when the ice accretion is further away from the center line,so the final ice accretion is in the shape of a cone.Currie et al.[18]conducted an ice crystal icing experiment on a hemisphere,observing the ice accretion of a similar shape.It is considered that less liquid water remains in the accretion layer under lower temperatures.The harder the ice accretion is,the more likely the sharp edge is to resist erosion caused by ice crystals.Thus,the mushroom-shaped base can be formed.Because of gravity,the ice accretion layer slightly droops.
Fig.9(c)shows a linear dependency between the total mass of ice and TWC.Apparently,the reason lies in the increasing quantity of impinging droplets and crystals.
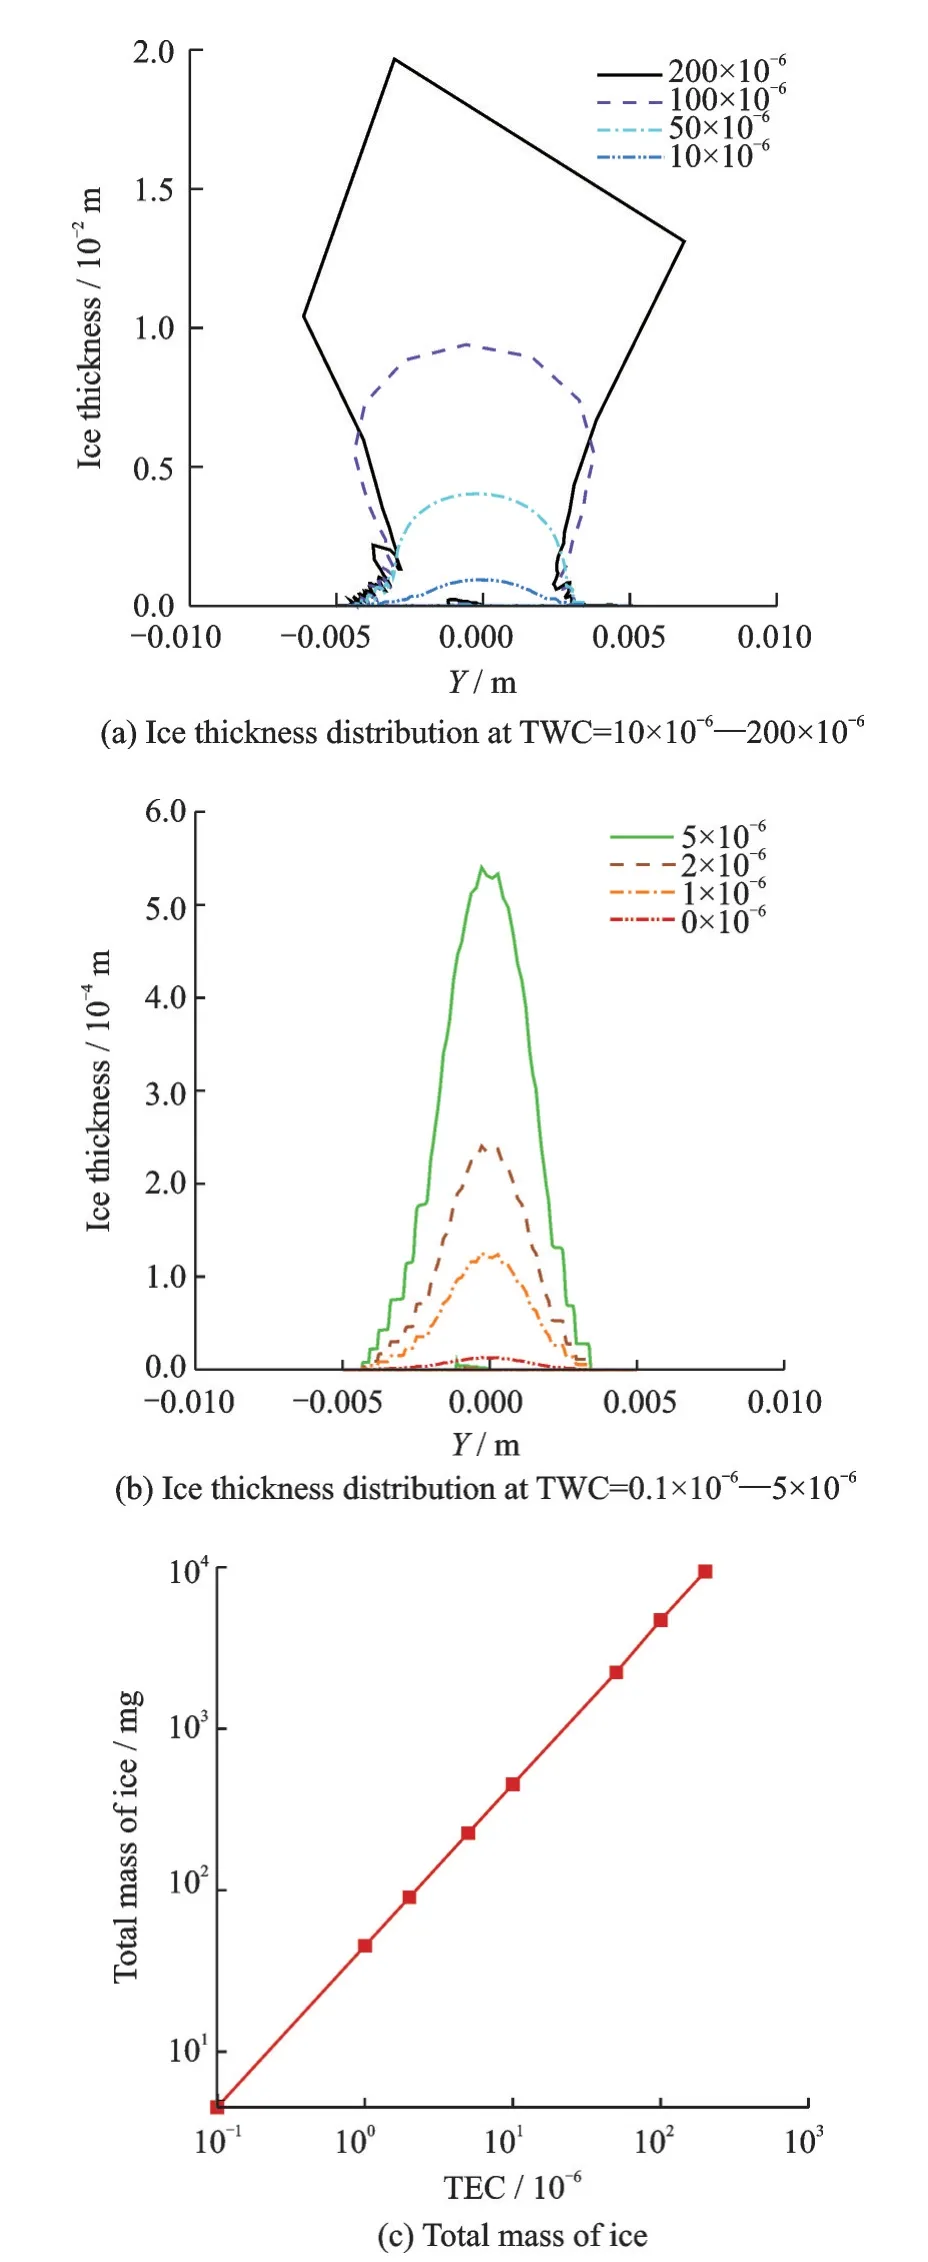
Fig.9 Ice thickness distribution and total mass of ice at different TWC
As shown in Fig.10,with the increase of TWC,the drag coefficient of the icing airfoil increases monotonically.The lift coefficient increases first and then decreases.The lift coefficient reaches the maximum at TWC=50×10-6.When TWC=0.1×10⁻⁶—10×10-6,the lift and drag coefficients are not much different from the clean airfoil because the rime ice on the leading edge remains streamlined.On the one hand,for TWC≥50×10-6,due to the formation of hemispherical glaze ice at the leading edge,the bluff and irregularly shaped body enlarges the area of flow separation.Plus,the roughness of ice increases with TWC.As a result,there is a steep rise in the drag coefficient due to the two factors mentioned earlier.The lift coefficient at TWC≥50×10-6is significantly higher than other working conditions,for there is a large low-pressure area above the upper surface of the airfoil.The airfoil can obtain greater lift force under the effect of the pressure difference between the upper and lower surfaces of the airfoil.
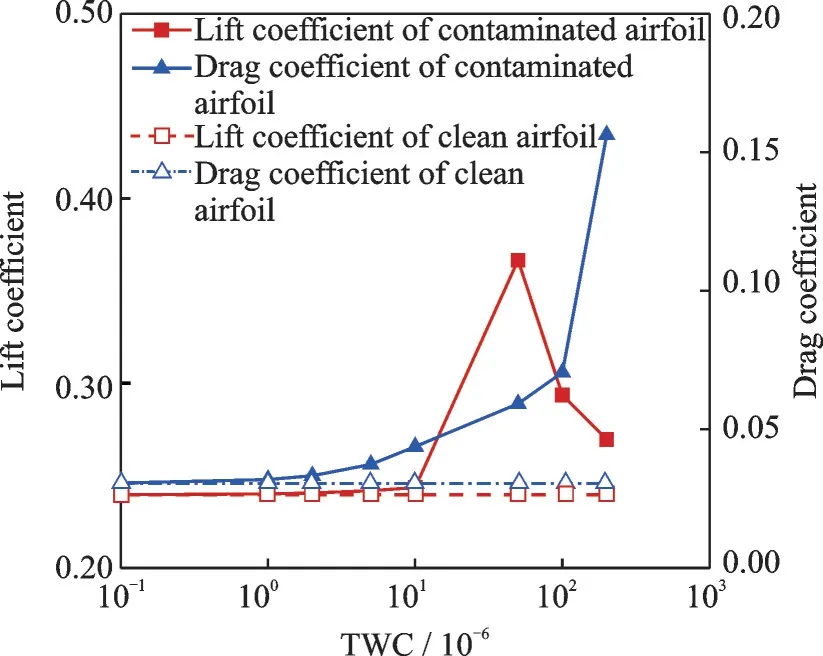
Fig.10 Lift and drag coefficients at different TWCs
According to Fig.11 and Fig.12,there is an area where the gauge pressure is less than 0.The static pressure here is lower than the far-field pressure,while the static temperature is higher.This indicates that the eddies convert the kinetic energy and the pressure energy into the internal energy,reducing both the local velocity and static pressure.
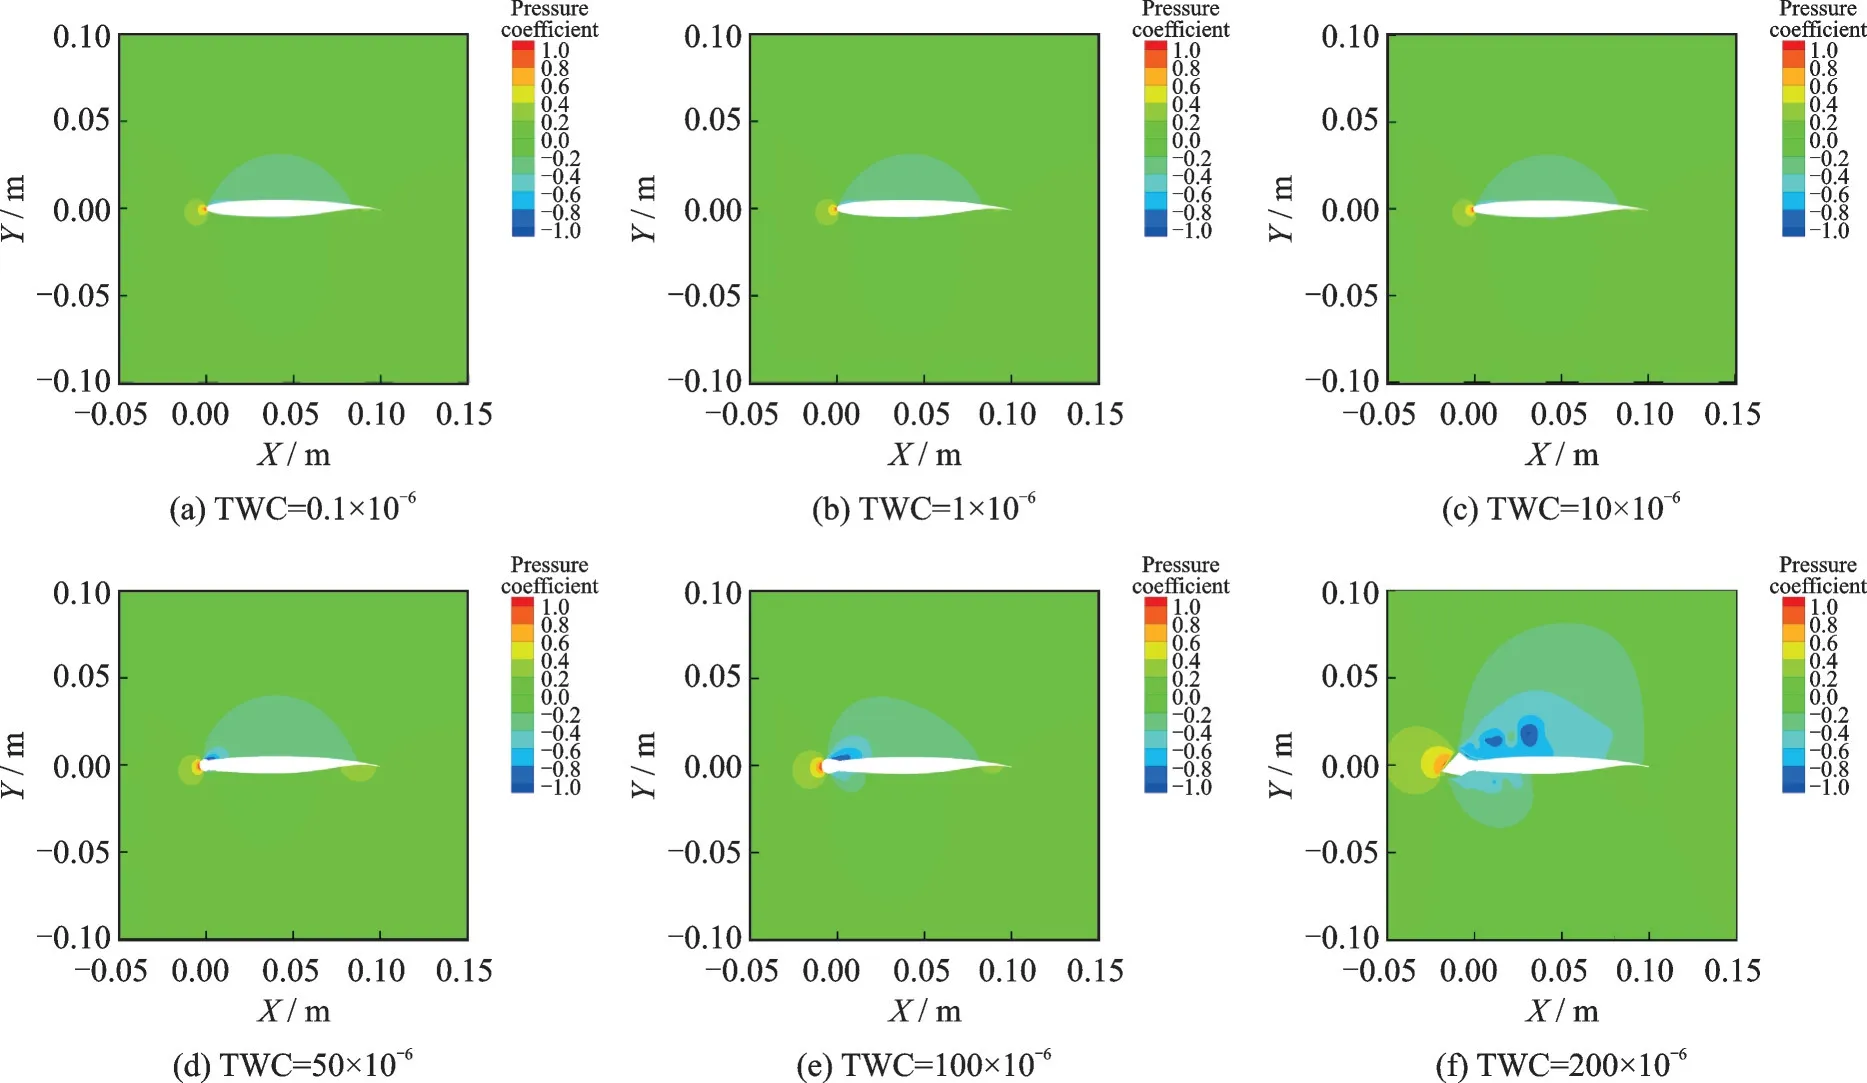
Fig.11 Pressure coefficient contour at different TWCs
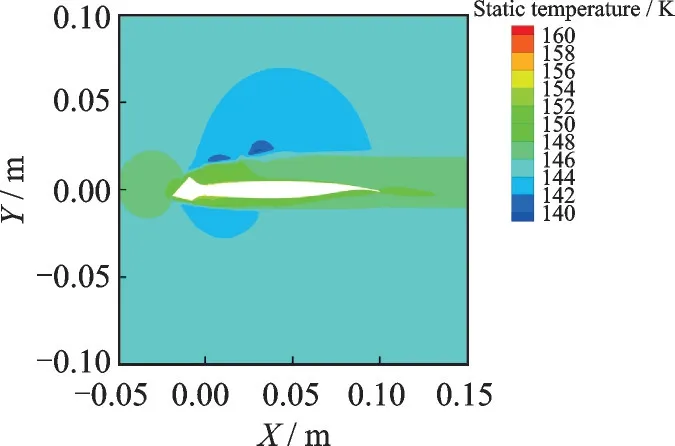
Fig.12 Static temperature contour (TWC=200×10-6)
2.4 Effects of melt ratio LWC/TWC
Different from the mixed-phase icing at relatively high temperatures,where an icing plateau exists,with the increase of melt ratio,the mass of ice increases linearly and monotonically,as shown in Fig.13.As the surface temperature of airfoil is extremely low,about 149 K,the droplets quickly freeze after impingement,and the ice crystals are sparsely dispersed in air,resulting in no ice crystal adhesion on the airfoil.The ice crystals almost contribute nothing to ice accretion.All the ice on the airfoil is generated by the solidification of subcooled droplets,so the icing severity is monotonically correlated with LWC.
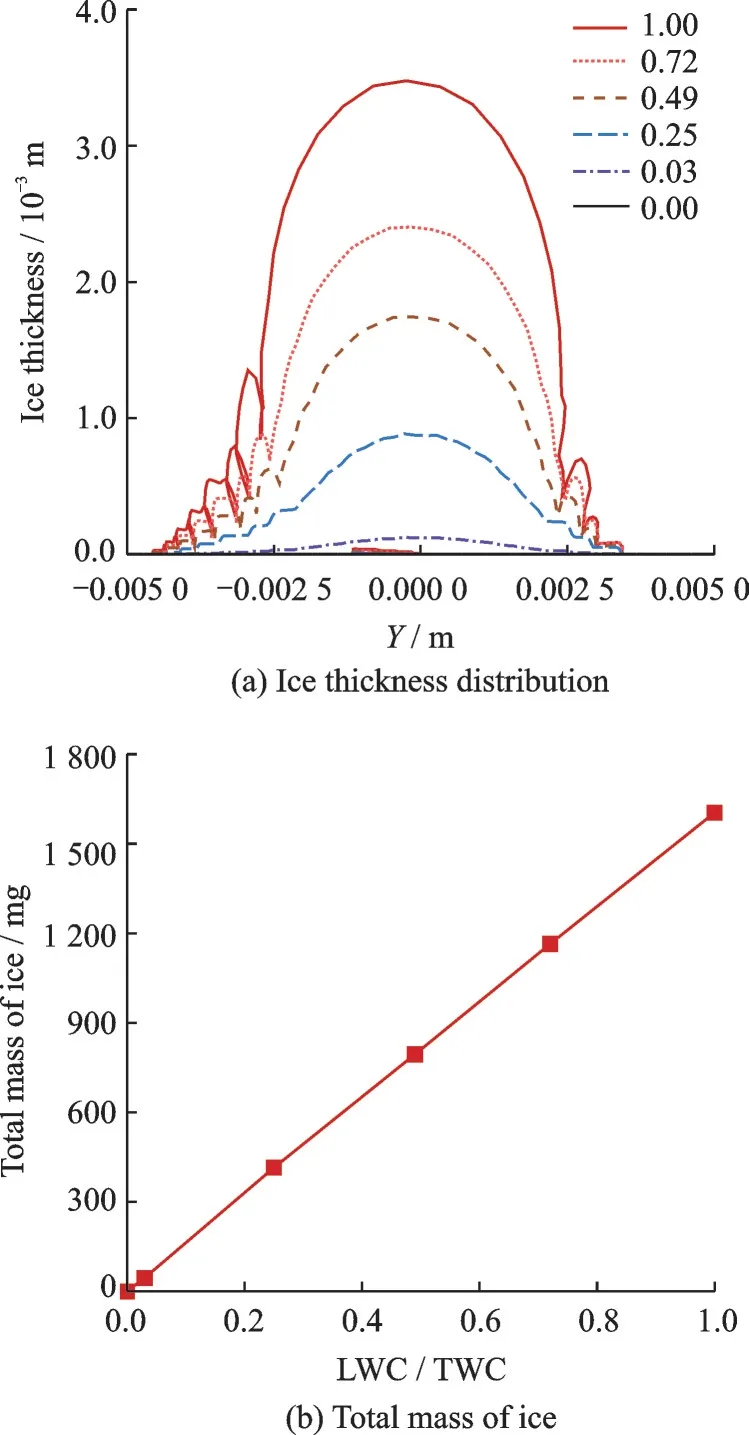
Fig.13 Ice thickness distribution and total mass of ice at different LWC/TWC
In Fig.14,only in cases of LWC/TWC≤0.25,the lift coefficient of the icing airfoil is close to that of the clean airfoil,and in other cases,the lift and drag coefficients show significant deviations.
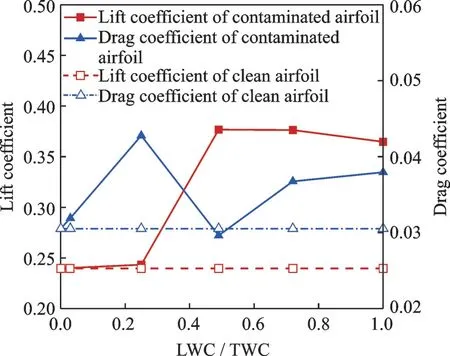
Fig.14 Lift and drag coefficients at different LWC/TWC
2.5 Effects of airflow total temperature T0
For TWC of 1×10⁻⁶and airflow pressure of 200 kPa,the dew point is approximately 204 K.In order to explore the influence of temperature near the dew point on icing,four test conditions between 200—206 K are additionally investigated.
As the ambient temperature decreases,the runback phenomenon attenuates.Within the temperature range of cryogenic wind tunnels,there is scarcely any runback water after droplets impact the airfoil.In addition,the LWC is too low to form a liquid film.Therefore,the type of ice is rime ice,as shown in Fig.15(a).As TWC is kept unchanged and the total temperature of airflowT0rises,the content of saturated water vapor increases accordingly.The content of droplets and ice crystals decreases.Nevertheless,water vapor does not sublimate under all working conditions in this experiment,so the amount of accumulated ice is reduced,as shown in Fig.15(b).Near the dew point,LWC decreases sharply with the increasing temperature,and the total mass of ice shares the same trend.AtT0=260 K,all water exists in the form of vapor,so the total mass of ice is 0.
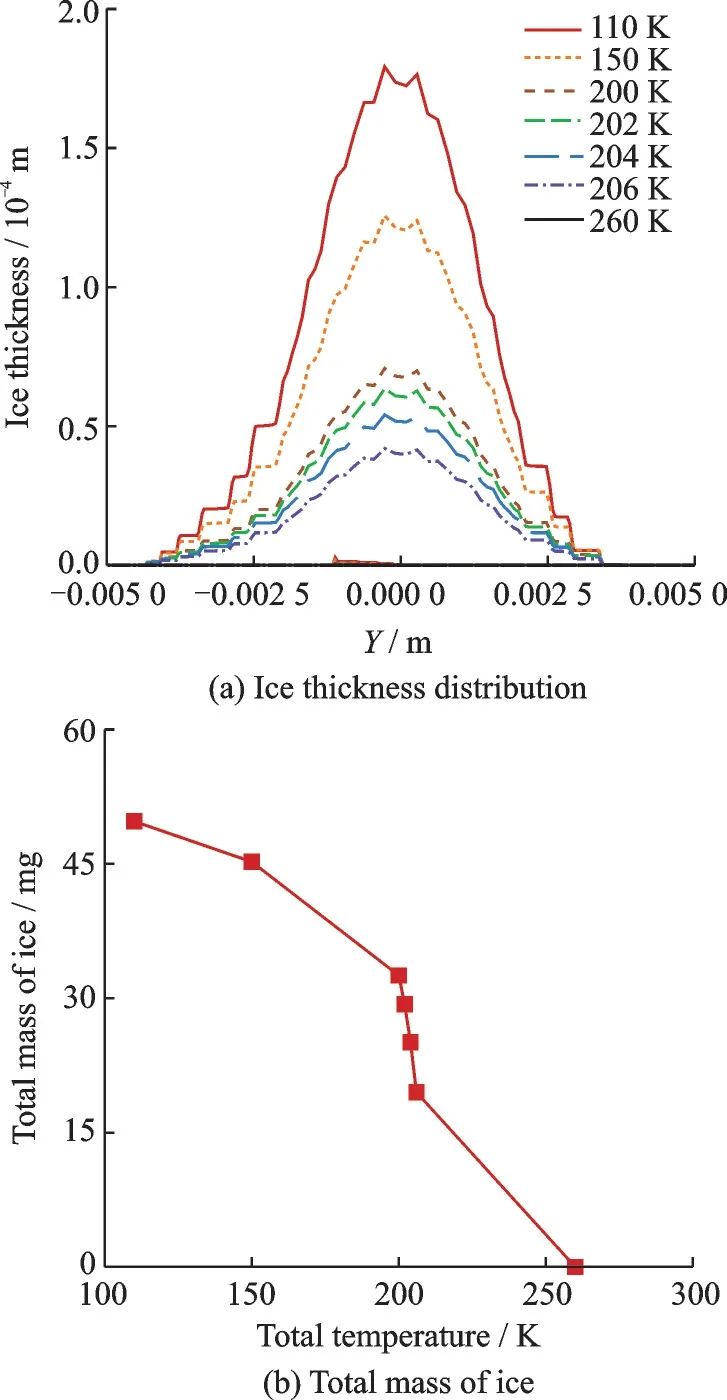
Fig.15 Ice thickness distribution and total mass of ice at different airflow total temperatures
As depicted in Fig.16,owing to the small thickness and streamlined shape of the accretion layer,the aerodynamic data of the contaminated airfoil is similar to that of the clean airfoil on the whole.In cases ofT0=200 K andT0=204 K,the lift and drag coefficients of the airfoil are significantly reduced.
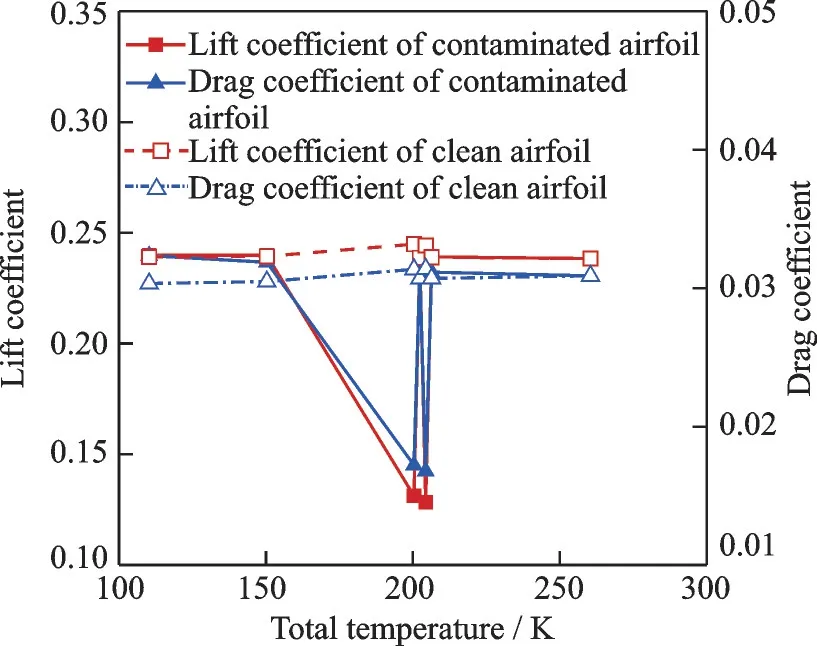
Fig.16 Lift and drag coefficients at different airflow total temperatures
2.6 Effects of airflow total pressure p0
As can be seen from Fig.17,a rime type ice accretion layer occurs on the leading edge.TWC increases with ascending ofp0,thus the thickness and total mass of ice are positively correlated withp0.The lift and drag coefficients of the contaminated airfoils are lower than those of the clean airfoil.Asp0increases,the deviations also increase gradually,as shown in Fig.18.

Fig.17 Ice thickness distribution and total mass of ice at different airflow total pressures

Fig.18 Lift and drag coefficients at different airflow total pressures
2.7 Effects of Mach number
With the increase of Mach number,the mass and thickness of ice increase,and the increment attenuates gradually,as shown in Fig.19.
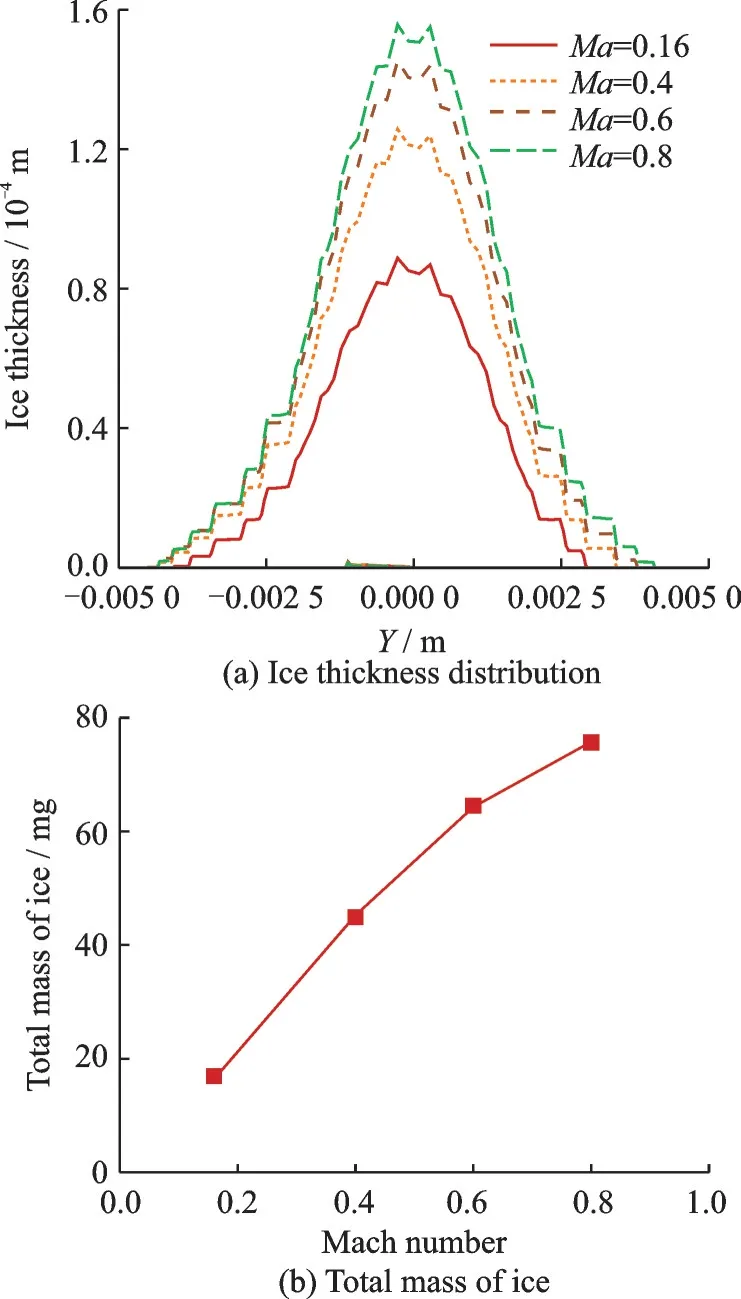
Fig.19 Ice thickness distribution and total mass of ice at different Mach numbers
The increase of Mach number results in two opposite effects on icing.In higher speed range,more liquid water will be accumulated on the airfoil in the same time span.This leads to more ice accretion.At the same time,the kinetic energy of ice crystals will increase,deepening the extent of erosion.The kinetic energy dissipation caused by impingement will also melt part of the accumulated ice.Under the shear stress of airflow,the droplets are more likely to flow towards the rear part of the airfoil,resulting in the expansion of the wetting area inYdirection.According to Fig.20,the differences of lift and drag coefficients between contaminated and clean airfoils decrease from positive to negative values with the growing Mach number.In cases ofMa=0.16 and 0.8,the two coefficients deviate evidently from those of the clean airfoil.
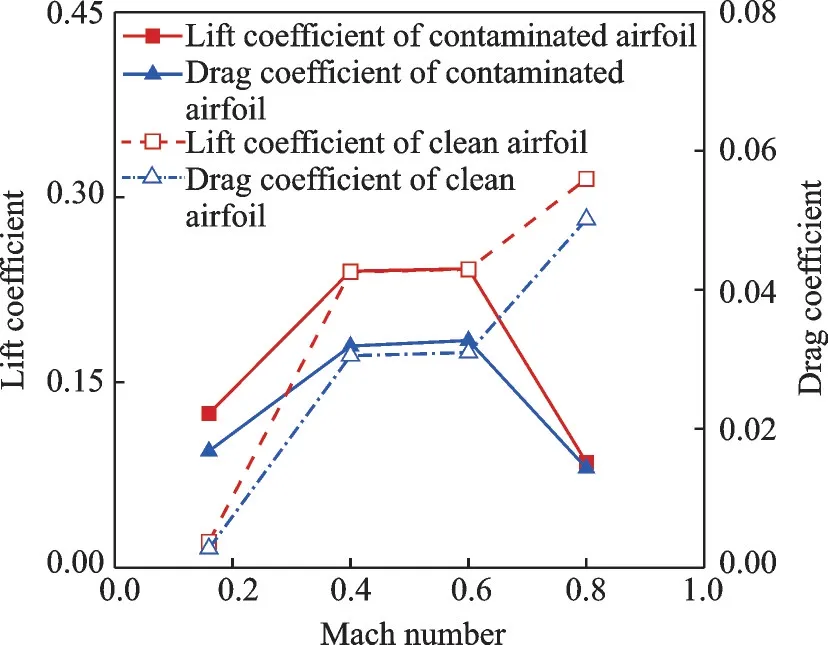
Fig.20 Lift and drag coefficients at different Mach numbers
2.8 Effects of airfoil surface roughness
It is recognized that the surface roughness has a significant effect on the frost thickness caused by water vapor desublimation[19].Within the present range of the airfoil surface roughness,it can hardly affect the amount of ice on the airfoil,as shown in Fig.21.Comparing the results,it can be speculated that the water vapor in the air really does not desublimate under such airflow condition.As illustrated in Fig.22,under different working conditions,the surface roughness distributions of ice accretion layer are generally the same and higher than that of the clean airfoil.Hence,the differences of the aerodynamic parameters between icing and clean airfoils are basically unchanged.
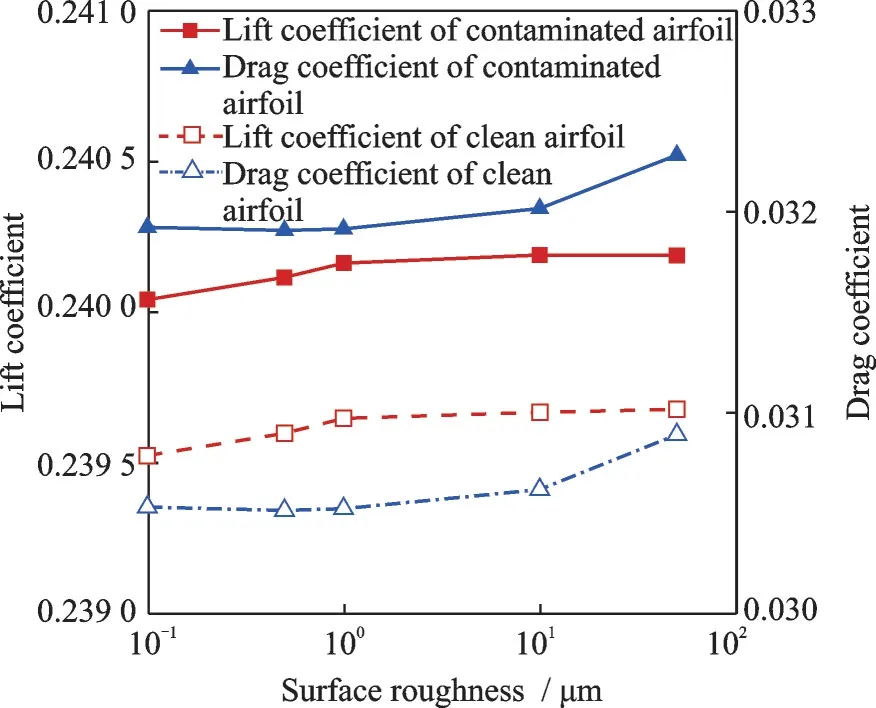
Fig.22 Lift and drag coefficients at different surface roughnesses
2.9 Effects of icing duration
With time elapses,there will be more ice accumulation on the surface,as shown in Fig.23.The thickness and mass of ice at the leading edge generally increase linearly with the icing duration extended from 1 h to 5 h.As displayed in Fig.24,the lift and drag coefficients increase accordingly as well.
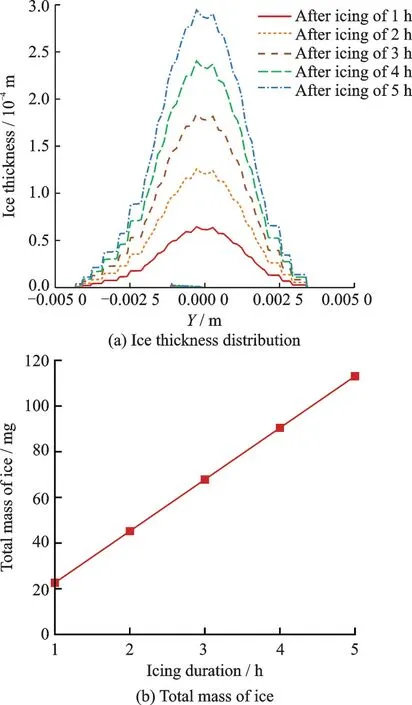
Fig.23 Ice thickness distribution and total mass of ice at different icing durations (1×10⁻⁶)
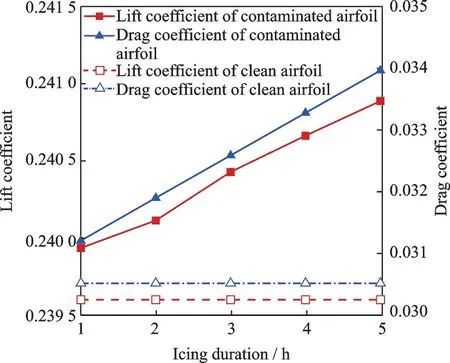
Fig.24 Lift and drag coefficients at different icing durations
3 Conclusions
The trace water icing process on the airfoil in cryogenic wind tunnels is simulated based on Messinger’s thermodynamic model.Based on this,the effects of water content parameters,airflow parameters,airfoil surface characteristics,icing duration on ice accretion are investigated.Main conclusions can be drawn as follows:
(1)Based on the Eulerian method,a multiphase flow model is established to predict the ice formation of trace water on the airfoil under cryogenic conditions.Comparing with the experimental results in the literature,the validated numerical model is suitable to calculate the ice accretion layer.
(2)TWC and LWC/TWC are the predominant factors affecting the amount of ice on the airfoil.With the increase of TWC,the amount of ice increases linearly.Under high TWC conditions,ice accretion layer at the leading edge will seriously affect the aerodynamic performance of the airfoil.The amount of ice increases monotonically with LWC/TWC.Under corresponding conditions,ice crystals contribute little to the ice accretion process.
(3)When the airflow total temperature increases,the mass of ice decreases,and the mass changes sharply around the dew point.With the increase of airflow total pressure,the amount of ice generally increases linearly.With the ascending of Mach number,the amount of ice increases,but the increment gets smaller.
(4)The surface roughness of the airfoil has little effect on the total amount of ice.The amount of ice increases linearly with icing duration.
 Transactions of Nanjing University of Aeronautics and Astronautics2023年2期
- Transactions of Nanjing University of Aeronautics and Astronautics的其它文章
- Anti-icing Skin with Micro-nano Structure Inspired byFargesia Qinlingensis
- Evaluation of Different Cloud Microphysics Schemes on the Meteorological Condition Prediction of Aircraft Icing
- Photothermal Anti/De-icing Performances of Superhydrophobic Surfaces with Various Micropatterns
- Mesh Impact Analysis of Eulerian Method for Droplet Impingement Characteristics Under Aircraft Icing Conditions
- Design Principle of Mixed-Wettability Surfaces for Inducing Droplet Directional Rebound
- Analysis of Ice-Shaped Surface Roughness Based on Fractal Theory