
Pyrrole and Pyrimidine Derivatives as Possible Electron Donors for Colored Charge-Transfer Complexes with a Weakly Electrophilic Energetic Material, FOX-7: A Theoretical Study
2023-06-13 10:17SergeyBondarchuk
火炸药学报 2023年5期
Sergey V.Bondarchuk
(Department of Chemistry and Nanomaterials Science, Bogdan Khmelnitsky Cherkasy National University, blvd.Shevchenko 81, 18031 Cherkasy, Ukraine)
Abstract:A number of electron-rich heterocycles are studied as potential reagents for visual colorimetric detection of FOX-7 due to colored charge-transfer complexes formation.The obtained results suggest that pyrrole and pyrimidine derivatives can form such complexes playing the role of electron donors despite a low electrophilicity of FOX-7.Density functional theory calculations, as well as quantum theory of atoms in molecules analysis, suggest stacking binding mode as the most preferable one with the binding energy of about 21—36 kJ/mol.All the complexes demonstrate a clear single charge-transfer absorption band in the visible region and the expected colors of the complexes are varying from violet and blue to red and orange.The calculations of the crystalline state of the studied complexes indicate high lattice energies, which are higher than that of pure FOX-7 and are close to the recently reported hydrogen-bonded complex of FOX-7 with 1,10-phenanthroline.Additional analysis of the studied charge-transfer complexes using properties based on density difference grids clearly suggests the acceptor role of FOX-7 in the complexes.This analysis can be effectively applied to identify the nature of other possible complexes of FOX-7, in which its role is unclear because of the specific reactivity, namely, both weak electrophilic and nucleophilic properties at the same time.
Keywords:FOX-7;charge-transfer; colorimetric analysis; detection of explosives; quantum-chemical calculation
Introduction

Scheme 1 Some resonance and tautomeric forms of FOX-7
Due to such unusual chemical reactivity, the analytical detection of FOX-7 is another challenge.To the best our knowledge, there are no reagents for visual colorimetric on-site detection of FOX-7, unlike nitroaromatics[13-15].Some efforts are done in the area of photoluminescent detection.Thus, a distinct color change of the lanthanide coordination polymer nanosheets in the presence of FOX-7 from red(bis-terpyridine·Eu)and green(bis-terpyridine·Tb)to colorless was witnessed upon UV light irradiation[16].Also,abinitiocalculations of FOX-7 adsorbed on theg-C3N4surface were done to exploit the potential applicability of the latter as explosive sensor[17].A similar charge-transfer adsorption system was calculated for FOX-7-graphene oxide composite[18].
Indeed, charge-transfer complexes of alkenes are known long ago.For example, tetracyanoethylene(TCE)can form such complexes with aromatics[19], cycloalkanes, alkenes, and alkynes[20]as well as heterocyclic thioamides[21].Such a variety of possible electron donors is due to a high electrophilicity of TCE.At the same time, FOX-7 is much less electrophilic and is expected to form charge-transfer complexes only with strong electron donors, like retinol(vitamin A)[22].In this case, the calculations predict two absorption bands in the visible region withλmaxabout 590 and 460 nm[22].Remarkably, in the presence of weak electron donors, like 1,10-phenantroline, FOX-7 behaves as a hydrogen bond donor itself, forming complexes with absorption in the UV region(λmax=323, 262 and 230 nm, EtOH solution)[23].
Recent trends in the development of methods for analytical detection of energetic materials, including improvised explosives, indicate a great importance of such investigation in this area[24-29].Consequently, quantum-chemical calculations can be applied as an effective tool for molecular modelling of possible reagents for visual colorimetric detection of FOX-7 that was done in the present work.
1 Computational details
The calculations without periodic boundary conditions were performed in terms of Density Functional Theory(DFT)within Generalized Gradient Approximation(GGA)using the Gaussian09 program package[30].Geometry optimizations were done using the hybrid functional B3LYP[31-32]together with a split valence quasi double-ζin the valence shell basis set(6-31 G).The latter was supplemented with both polarization(d, p)and diffuse(+)functions[33-34].Long-range effects were taken into account using dispersion corrections to the total energies obtained in terms of the D3 version of Grimme dispersion with Becke-Johnson damping scheme[35].Solvent effects were simulated using the polarizable continuum model(PCM)within the conductor-like polarizable continuum model(CPCM)formalism[36].Absorption spectra were calculated using Time-Dependent DFT(TD-DFT)with a hybrid functional HSE06[37].Earlier, the HSE06 functional was found to be very successful in prediction of the UV-vis spectra of molecular[38]and ionic[39]solids.The number of TD states was specified to be 4 for all the calculations as a compromise between computational cost and guarantee of including all possible visible-region electron transitions.
The calculations with periodic boundary conditions were performed using the Materials Studio 2017 program suite[40].Molecular dynamics(MD)simulations were carried out with a novelabinitioforcefield COMPASSII(Condensed-phase Optimized Molecular Potentials for Atomistic Simulation Studies)[41]using the Forcite module as implemented in the Materials Studio 2017 program suite[40].The simulation was done with the NVT ensemble at 300 K for 50 ps.A mild timestep of 1 fs was specified as it was suggested for MD simulations[42].Modeling of the condensed(crystalline)phase was performed for theP1 space group according to scheme, described in our recent papers[43-44].
All post-SCF calculations were performed using the Multiwfn 3.8 program package[45].Characterization of the charge-transfer states was done according to the following criteria:
(1)Charge-transfer length Δr[46]:
(1)

(2)TheDCTindex, which is the distance between the two barycenters of positive and negative parts of Δρ(R+andR-)[47]:
DCT=|R+-R-|
(2)
(3)ThetCTindex, which measures separation degree of positive and negative parts of the electron density(ρ+andρ-)[47].
(4)The transferred chargeqCTcorresponding to the total amount of charge whose distribution is perturbed during electron excitation[47].
(5)The dipole moment variation caused by electron excitation ΔμCT[47]:
ΔμCT=

(3)
whereX+,Y+,Z+andX-,Y-,Z-are the Cartesian component coordinates ofR+andR-, respectively.
(6)Interfragment charge transferQR,S[48]:
QR,S=ΘR,holeΘs,ele
(4)
whereΘR,holeandΘS,elestand for contribution of fragmentRto hole and contribution of fragmentSto electron, respectively.
(7)TheS+-index, which is a measure of separation degree betweenC+andC-[48]:
(5)
whereC+andC-are the Gaussian-type functions defined for visualization of the positive and negative parts of the electron density.
2 Results and discussion
2.1 Structure and bonding in the charge-transfer complexes
In order to find potential electron donors for charge-transfer(CT)complexes with FOX-7, we have selected a number of different electron-rich heterocycles, as well as fused carbo-and heterocycles, and acyclic systems.Additionally, we have selected a few acceptor molecules for comparison, which include compounds with known behavior in the CT complex formation.The corresponding chemical structures and labeling is presented in Fig.S1 in the Supporting Information.As the molecular properties for comparison, we have selected general chemical reactivity indexes(in eV)obtained in terms of conceptual DFT[49].These are the following: ionization energy(I), electron affinity(A), electronegativity(χ), chemical hardness(η)and electrophilicity index(ω).
The calculated indexes for the acceptor(A)and donor(D)molecules are listed in Tables 1 and 2, respectively.

Table 1 The conceptual DFT indexes calculated for the acceptor molecules
As it follows from Table 1, FOX-7 is a poorer electron acceptor compared to the typical nitroaromatics and, especially, tetracyanoethylene.Thus, to form CT complexes as an acceptor, FOX-7 needs an effective electron donor, which is stronger than 1,10-phenantroline[23].The latter compound has the highest electronegativity and one on the highest ionization energy and electrophilicity(Table 2).Diagram of the absolute difference in electronegativities between acceptor and donor molecules is presented in Fig.S2 in the Supporting Information.It is clearly seen that significant differences between theχvalues of FOX-7 is observed for various pyrrole and pyrimidine derivatives(D1—D10).
Thus, we have modeled the CT complexes of FOX-7 with the latter ten compounds.First of all, we have tried to obtain stationary geometries of such complexes.This is not a trivial task, which faces with the problem of the description of spatial orientation of the donor and acceptor, since these are bound only by weak intermolecular bonds.As a result, the global minimum on the potential energy surface of such complexes demonstrates a number of shallower close-lying minima near the global minimum.These correspond to transient configurations of the complex caused by some vibrational displacements at finite temperatures and can be reversibly occupied at ambient temperatures.Therefore, a simple geometry optimization in vacuum at 0 K cannot guarantee that the optimized structure will correspond to the global minimum.
Similar to our recent paper on the complex of 2,4,6-TNT with 2-(dimethylamino)ethyl methacrylate[50], we have performed molecular dynamics simulations in order to find out the average distance between centroids and the most probable binding mode.For this purpose, we have chosenD1as a donor molecule.Thus, a cubic supercell(a=22.837 Å)containing 50 molecules ofA1andD1was relaxed followed by the MD simulation.The corresponding snapshot of the final geometry, as well as the plot of radial distribution function of the distance between centroids, is illustrated in Fig.S3 in the Supporting Information.As one can see in Fig.S3 B, the value of theg(r)function reaches its maximum at about 4 Å.Moreover, two possible binding modes were detected.The first is stacking interactions and the other one is hydrogen bonding between the NH2…O2N moieties of theD1andA1molecules, respectively.
Thus, we have performed a series of geometry optimizations starting from the possible intermolecular orientations of the afore-mentioned two types.The obtained results suggest that stacking interaction is predominant binding mode in this case, since the binding energies of such complexes are higher than ones with the hydrogen bonding.The corresponding optimized geometries are illustrated in Fig.1 and S4 in the Supporting Information.As one can see in Fig.1, the distance between centroids inCT1(blue numbers)is very close to one obtained with MD simulations, which indicates the convergence of the results.For the other complexes, this value varies in the range from about 3.3 to 4.0 Å.On the other hand, the closest intermolecular contacts(black numbers)also vary in the range of about 2.2—3.0 Å(Fig.1).These two parameters are the most statistically stable intermolecular degrees of freedom and, knowing them, one can easily optimize any similar complex using a simple freezing of the latter two lengths.Thus, the global search strategy for such CT complexes is the following: determination of the appropriate donor(via theχvalues)→determination of the average distance between centroids and the closest intermolecular contact(using MD simulation)→geometry optimization of the CT model in polar solvent(at the CPCM-DFT(B3LYP-D3)/6-31+g(d,p)level of theory).

Fig.1 The optimized structures of the charge-transfer complexes with indication on their energies and structural parameters(left); the intermolecular bond critical points and paths with the corresponding labeling(right)
To find out the nature of intermolecular bonding, we have performed the QTAIM analysis of the electron density distribution.All the found intermolecular bonds and the corresponding critical point(CP)labeling are illustrated in Fig.1.The calculated numerical values of the QTAIM parameters, namely, the electron densityρ(r), its Laplacian2ρ(r), negative of Hamiltonian kinetic energy densityhe(r)and potential energy densityν(r), are listed in Tables 3 and S1 in the Supporting Information.
The type of intermolecular bonding was distinguished according to the signs of2ρ(r)andhe(r)[51].Both positive values of the latter two parameters indicate the ionic and Van der Waals bonds.This type of bonding is typical for similar CT complexes, for example for the complex between naphthalene andA7, which is known long ago[19].In this case, all the intermolecular interactions demonstrate2ρ(r)>0 andhe(r)>0, as it follows from our present calculations.On the other hand, the complexes illustrated in Fig.S4, as well as the complex betweenA1andD11[23], demonstrate2ρ(r)>0 andhe(r)<0, which indeed corresponds to hydrogen bonds[51].The corresponding calculation results are presented in Fig.S5 and Table S2 in the Supporting Information.Using the Espinosa equationE=1/2ν(r)[52], the intermolecular bond energies(in a.u.)can be estimated using theν(r)value at the corresponding bond CPs.Thus, taking into account the values in Table 3, one can estimate the strongest intermolecular bond energies as ones lying within the range of 5—13 kJ/mol.
Table 3 The numerical values(in a.u.)of the selected QTAIM properties in the highest electron density CPs among the formed intermolecular bonds
Also, we have modeled complexesCT1-CT10in the crystalline state to calculate the corresponding lattice energies(Elatt)and the binding modes.The calculations were performed only for theP1 space group, since the possible difference inElattare expected to be small, whereas the search of the most appropriate space group is a very complex and computationally expensive task.The obtained molecular arrangement for theCT8crystal is illustrated in Fig.2 and packing of all the rest crystals is presented in Fig.S6 in the Supporting Information.As one can see, the same two types of binding, stacking and hydrogen bonds, appear in the crystalline state, which should significantly stabilize the latter.Indeed, theElattvalues for the CT complexes lying in the range of 228—316 kJ/mol, which is even higher than that for pure FOX-7 crystal(Table 4).The calculation ofElattfor experimentally observed space group of FOX-7(P21/n)demonstrates only slightly higher value(176.2 kJ/mol).A relatively close result was recently obtained via the calculation of molar heat of vaporization of FOX-7, yielding cohesive energy density 2.667 kJ/cm3[53].Taking into account the change of FOX-7 molar volume in the range 360-80 K[54]and extrapolating the curve to 0 K, theElattvalue can be estimated as 201.0 kJ/mol.Thus, one can conclude thatCT1-CT10are expected to be robust solids close to the recently obtained complex with 1,10-phenanthroline(CT11)[23].
Fig.2 The two possible bonding modes in the crystalline state of CT8
Table 4 The numerical values(in a.u.)of the selected QTAIM properties in the highest electron density CPs among the formed intermolecular bonds
2.2 Absorption spectra and color prediction
An important property of the studies CT complexes is their color, since these are modeled as possible reagents for visual colorimetric detection of FOX-7.Therefore, the method for absorption spectrum prediction must be well checked for the studied molecular system.Experimental spectrum of FOX-7 in EtOH demonstrates three bands withλmaxat 391, 312 and 280 nm[55].Remarkably, the calculated spectrum provides a relatively close spectral pattern withλmaxat 349, 309 and 272 nm, respectively.These two spectra as well as one for the FOX-7 dimer are overlaid as inset in Fig.3.Thus, one can conclude that the calculation method is applicable for spectra prediction of the FOX-7 charge-transfer complexes.

Fig.3 Plots of the calculated absorption spectra of the complexes CT1-CT10; inset illustrate the UV-vis spectrum of FOX-7
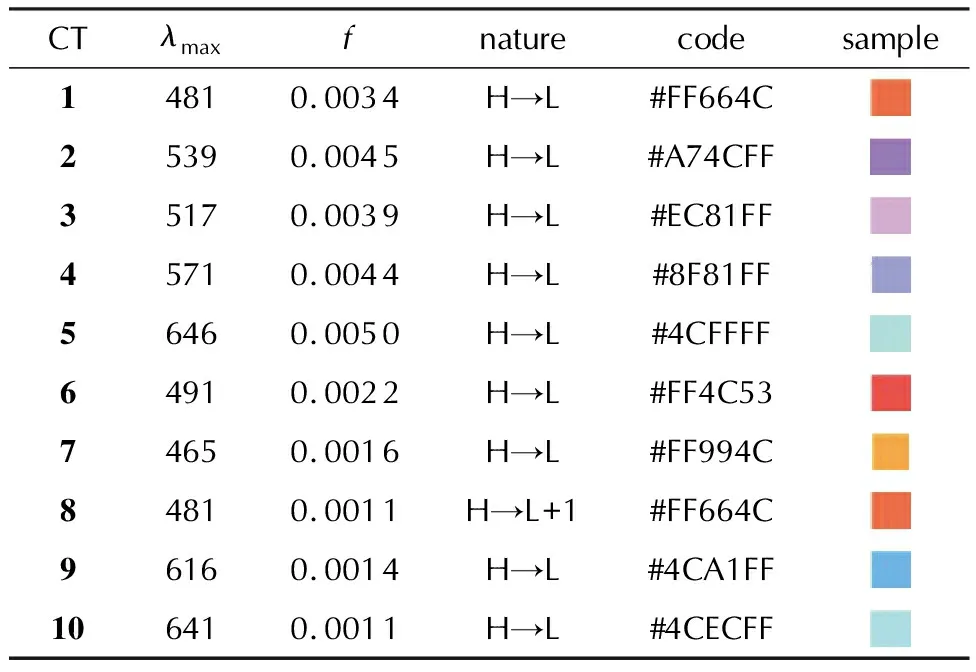
Table 5 The calculated wavelengths(in nm)and oscillator strengths(f)of the charge-transfer bands in absorption spectra of the complexes CT1-CT10 and the predicted colors
The calculated UV-vis spectra ofCT1-CT10are illustrated in Fig.3 and the corresponding numerical data on the CT band along with the orbital assignment are listed in Table 5.As one can see, all CT complexes demonstrate one clear band in the visible region.Orbital assignment revealed a complete charge transfer from the donor to acceptor molecule, on which the highest occupied(H)and the lowest unoccupied(L)molecular orbitals are completely located.The only exception is the spectrum ofCT8, for which the lowest-energy H→L transition is outside the visible region(793 nm).The nature of H and L is the same for all the CT spectra.The corresponding isosurfaces forCT1are illustrated in Fig.4.Thus, the CT band can be assigned as a π-π*electron transition.The complete orbital assignment of the absorption spectra ofCT1-CT10as well asCT1a-CT10ais presented in Tables S3 and S4 in the Supporting Information.
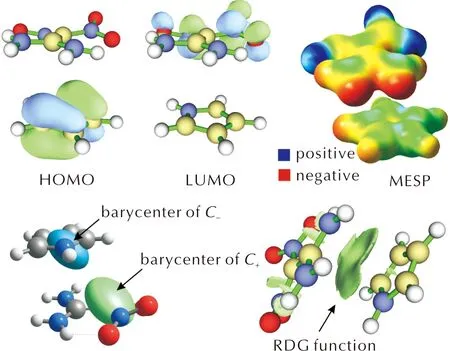
Fig.4 Some calculated isosurfaces visualizing frontier orbitals, MESP, charge transfer and non-covalent interactions for CT1
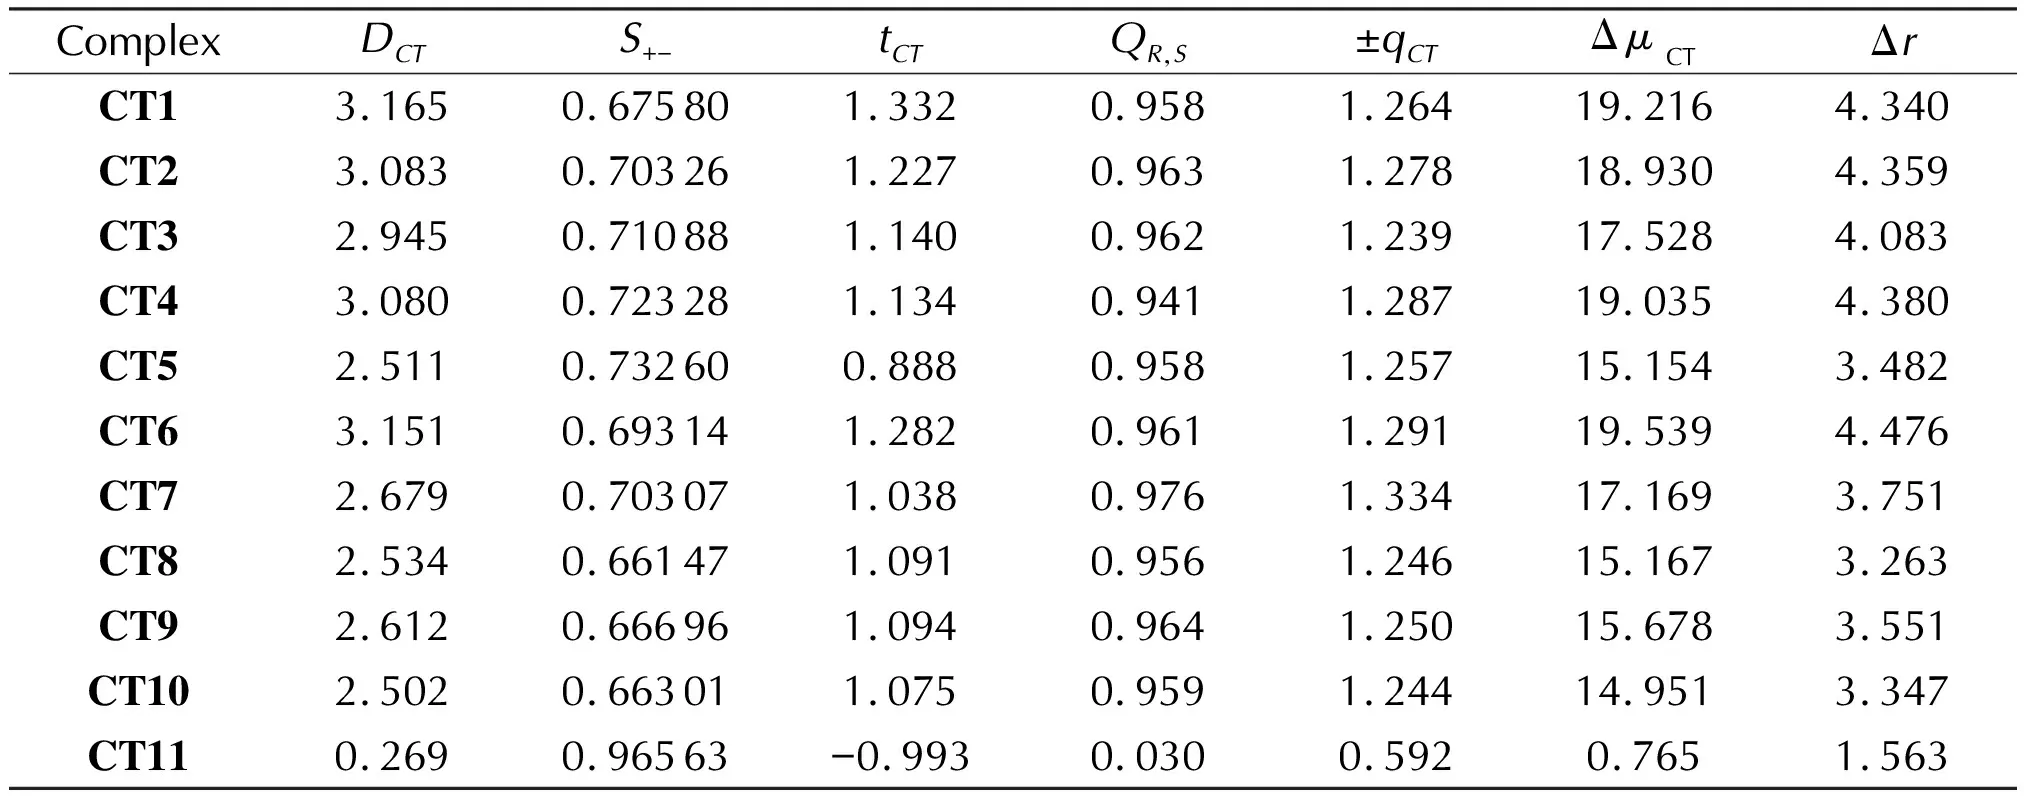
Table 6 The numerical values of the CT properties based on density difference grid data for the complexes CT1-CT11
Remarkably, each spectrum has its specific color, which varies from violet and blue to red and orange(Table 5).The color reproduction was performed using the following procedure.The obtained wavelengths, which correspond toλmaxwere converted into the absorbed color with a subsequent digitalization and assignment of a hexadecimal color code[56].Thereafter, the absorbed color was transformed into the corresponding complementary color by using the online resource[57].Of course, the calculation errors may be the reason of noticeable color varying, but, nevertheless, the conclusion about the wide variety of theCT1-CT10complexes colors may be considered as reliable.
2.3 Characteristics of the charge-transfer based on density difference grid data
In order to perform a deeper analysis of the studied systems,we have carried out a series of post-SCF calculations to build isosurfaces and obtain numerical characteristics of the studied CT complexes based on the density difference grid data.The 3D plots of molecular electrostatic potential(MEP), barycenters of positive and negative charges as well as reduced density gradient function(RDG)[58]forCT1as an example are illustrated in Fig.4.As one can see, RDG function clearly shows that intermolecular bonding does observed and is almost coplanar to the donor and acceptor molecules approving a stacking mode of binding figured out on the basis of the QTAIM analysis(Fig.1).Also, while the barycenter ofC-is located close to the center of mass, theC+is directed towards the donor molecule(Fig.4).Therefore, the totalDCTindex is lower that the corresponding distance between centroids.The corresponding numerical data are gathered in Table 6.
The separation of theC-andC+functions is significant that is indicated by the corresponding values ofS+-.A similar evidences come from the values of thetCT, which are all positive andQR,Sindexes, which are close to 1 forCT1-CT10(Table 6).Using the calculated CT characteristics, one can easily distinguish true CT states from those formed due to, say, hydrogen bonding, like in the complex ofA1withD11(CT11).This is also followed from the ±qCT, ΔμCTand Δrvalues(Table 6).The parameters obtained of the basis of the density difference grid data are especially useful for identification of the role of FOX-7 in similar complexes with other reagents, in which its role is ambiguous.Indeed, due to simultaneous weak electrophilic and nucleophilic properties and different possible bonding types, FOX-7 can demonstrate both donor and acceptor properties, which is hard to identify only on the basis of conceptual DFT indexes(χ,ω, etc.).
3 Conclusions
Summing up, we presented in this paper a theoretical study of the possibility of the charge-transfer complexes formation, in which FOX-7 plays the role of an electron acceptor.The calculations show that FOX-7 is less electrophilic and electronegative than the typical nitroaromatic energetic materials and requires much stronger electron donors to form the complexes of such type.Therefore, as potential donor molecules, ten experimentally available methyl and amino derivatives of pyrrole and pyrimidine are proposed.Formation of the CT complexes was confirmed by the MD simulations, QTAIM analysis and indexes, based on the density difference grid data.
All these complexes demonstrate a clear single band in the visible region, which correspond to the π-π*electron transition from HOMO(on the donor molecule)to the LUMO(on FOX-7).The expected colors of the CT complexes in EtOH solution vary from violet and blue to red and orange.Though the accurate color of the complex may be questionable due to a possible under/overestimation of theλmax, the conclusion about the wide variety of theCT1-CT10complexes colors may be considered as reliable.Modeling of the studied complexes in crystalline state revealed its good cohesive energies, which allows concluding that these can be stable in the crystalline form.At the same time, absorption spectra of the crystalline state are still unknown and can be different from those in solution.
Acknowledgments
This work was supported by the Ministry of Education and Science of Ukraine, Research Fund(Grant No.0122U000760).
AppendixA.Supplementarydata
Chemical structures, MD simulation results, QTAIM data, crystal packing, complete assignment of absorption spectra.
Fordetails,seetheAppendixAintheonlineversion.
