
HIL testing of wheel slide protection systems: criteria for continuous updating and validation
2023-06-14 00:16PugiPaolieriGiorgettiBerziVivianiCabrucciBocciolini
Railway Engineering Science 2023年2期
L.Pugi• G.Paolieri • M.Giorgetti • L.Berzi • R.Viviani • L.Cabrucci •L.Bocciolini
Abstract Assessment of railway wheel slide protection(WSP) systems involves the execution of complex experimental activities that are quite expensive and time-consuming,since they involve the physical reproduction of degraded adhesion conditions on a real railway line.WSP is devoted to regulating applied braking forces to avoid excessive wheel sliding in case of degraded adhesion conditions between wheel and rail.WSP must be also compliant to safety specifications related to assured braking performances and consumed air.Hardware in the loop(HIL) testing offers an affordable and sustainable way to accelerate these activities optimizing cost,duration and safety of experimental activities performed online.HIL test rigs are subjected to continuous updates,customization and natural ageing of their components.This work investigates the criteria that can be adopted to assure a continuous monitoring and validation of a real WSP test rig,the Italian test rig of Firenze Osmannoro.
Keywords Hardware in the loop (HIL) ∙Wheel slide protection (WSP) ∙Degraded adhesion conditions ∙Train brake
1 Introduction
A wheel slide protection (WSP) system is devoted to the protection of rolling surfaces during the braking of a railway vehicle.As shown in Fig.1a,a WSP system is composed by an electron control unit (ECU) that avoids excessive wheel sliding by regulating applied braking torque on wheels.An ECU controls refill and dump valves(EVR-EVS valves) that modulate clamping pressures inside braking cylinders.Sliding state of wheels is estimated by the WSP from wheel speed measurements performed by tachometers.Testing of a railway WSP system involves complex experimental activities.Tested WSP system is installed on an instrumented railway vehicle;different braking manoeuvres with nominal and degraded adhesion are performed.In Fig.1b it is shown an instrumented coach used by Italcertifer for experimental activities on WSP systems: the coach is equipped with a plant that can introduce contaminants/lubricants within the wheel–rail interface.
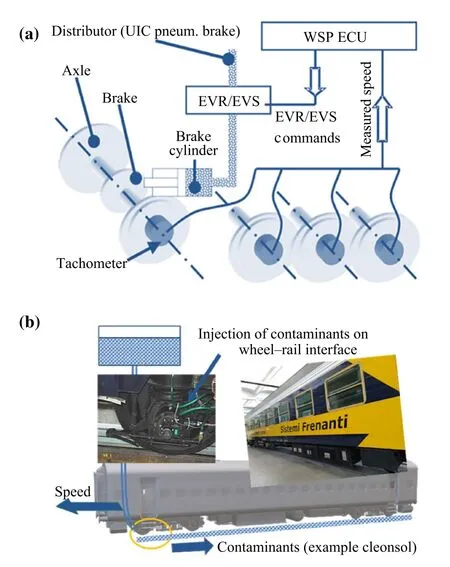
Fig.1 a Simplified scheme of WSP system and b testing procedure with an instrumented coach
WSP testing is regulated by international standards[1,2].Prescribed testing activities are summarized by the flowchart of Fig.2:
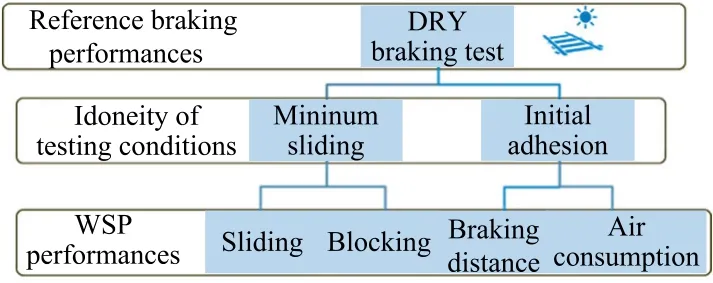
Fig.2 Simplified flowchart regarding WSP testing
• Reference braking performance: WSP must preserve braking in case of degraded adhesion,so a comparison with a reference braking performance of the vehicle is made.Braking tests with nominal adhesion conditions are performed to evaluate reference braking distances.In these conditions,WSP must stay inactive without any intervention on braking forces.Robustness against undesired WSP interventions is also tested.Air consumptions of the pneumatic brake are recorded.
• Identification and assessment of repeatable degraded adhesion conditions: WSP performances must be verified with artificially degraded conditions that are obtained by introducing contaminants in wheel-rail interface.To assess WSP performances,degraded adhesion conditions must be known and repeatable.There is no methodology or sensor to measure the way in which adhesion is really degraded.So,the concentration of contaminants injected in wheel–rail interface is iteratively changed to reproduce a desired degraded adhesion.Obtained adhesion is verified through an array of indirect checks related to recorded sliding and measured accelerations of wheels during the initial application of braking forces.As a consequence,testing conditions are evaluated through an iterative procedure increasing the number of performed test runs.This iterative procedure contributes to increase costs and time needed for testing activities.
• WSP performance evaluation:the aim of WSP systems is to avoid excessive sliding to preserve the integrity of rolling surfaces from localized damages such as wheel flat.Wheel blocking over a known speed (30 km/h)must be avoided;also recorded sliding of wheels must be limited.WSP protects rolling surfaces by optimizing applied braking torques respect to an estimated level of available wheel-rail adhesion.Performed modulation of braking forces should preserve performances in terms of stopping distances.The increment of air consumed by the brake plant during degraded adhesion tests must be measured to verify brake inexhaustibility [3].
To reduce duration and costs of experimental activities on WSP,regulations in force such as in fiche UIC 541-05[1]admit hardware in the loop(HIL)simulations,including limitations for what concern its applicability.
Rigs are classified in four different levels of complexity(levels 1,2a,2b,and 3).The same standards [1,2] also prescribe some criteria for HIL testing.Design criteria for test rigs have been proposed for the first time by BR-AEA tech in the late 1990s [4] and then in early 2000 by Trenitalia SPA [5].There is still a continuous interest in literature regarding hardware in the loop simulation [6–9],WSP testing,and the development of wheel-rail degraded adhesion models that have been proposed also for a new generation of roller rigs [10–12].
The scheme of a level 1 test rig is shown in Fig.3:this is the most complete layout to perform testing activities according to regulations in force;currently,there are only two level 1 test rigs in the world that are homologated by UIC: the DB WSPER and the Italcertifer one of Firenze CDSO (Centro Dinamica Sperimentale Osmannoro).
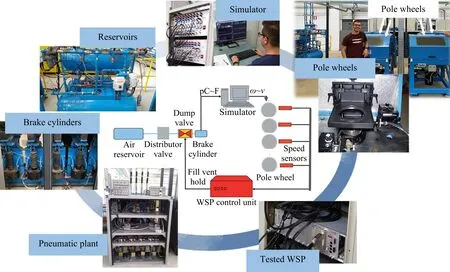
Fig.3 Scheme of a level 1 hardware in the loop,according to UIC 541-05 and the corresponding implementation on Italcertifer test rig
Homologation of a level 1 test rig is a long procedure involving prolonged testing activities,in which results of the HIL rig are compared with experimental data from tests on real vehicles.
For this reason,the operational life of these rigs must be long.As example,the Italian test rig of Italcertifer has a service history of about 20 years,which is an exceptional long operational life for a hardware in the loop application.A continuous update of the rig is mandatory to follow the evolution of tested WSP systems and to assure the maintenance of rig components that are more affected by technological ageing (installed software,computers,electronic boards,etc.).Continuous update and maintenance are critical aspects for the life of these systems since stability and repeatability of tests are a key requisite for their assessment.
In this work authors investigate how some key features of the Italcertifer rig have contributed to improve its performances and the length of its operational life.
The most innovative contribution is represented by criteria adopted to monitor repeatability and stability of performed tests,since specific literature on this topic is quite poor limiting a larger diffusion of HIL testing.In doing this,authors propose some criteria that should be useful to assess not only the stability of performed tests but also to understand the robustness of the tested WSP respect to the wide variability of real operational conditions.
2 Modular simulator structure
As shown in Fig.3,the core of the HIL system is represented by the real-time model of vehicle dynamics.
The model interacts with physical components of the rig such as pneumatic brake plant and the tested WSP system.The real-time model is completely developed using MATLAB SimulinkTM.The proposed model is designed to be used not only for HIL activities on the rig:the real-time model can be also used for software in the loop (SIL)simulations of WSP or odometry systems and more generally as an open development tool for different applications.
As shown in Fig.4,the model is composed by a limited number of sub-models that can be used for different testing and simulation activities:

Fig.4 Modular structure of the model and layout of different testing configurations
• Offline simulation: this is a complete model which reproduces the whole vehicle including traction and braking systems and consequently the WSP one.In this way it is possible to perform a complete simulation on a standard workstation.This configuration is also useful to perform SIL tests of WSP devices.Finally,this configuration is useful for the preliminary testing and development of new sub-models that should be verified and validated on a separated platform before their usage on the WSP test rig.
• WSP simulation: in a level 1 test rig the whole pneumatic brake plant is physically reproduced to test the WSP.Thus,WSP and brake plant sub-models are removed and substituted by electrical interfaces needed to connect the model with the other physical components of the rig.It is also possible to test innovative WSP algorithm directly on the rig without having still developed the final embodiment of the WSP board.
• Odometry module:the same test rig has been used also for the development of the Italian SCMT odometry systems [13];there is a specific module fully dedicated to SIL and HIL testing of odometry systems.
Different implementations/variants are defined for each sub-model described in Fig.4.As example for the mechanical model of the vehicle,different wheelsets can be simulated(max eight axles or independent wheels).The adopted real-time target is a multiprocessor system(DSPACETMmodular hardware);for each sub-model(running with frequencies between 100 and 1000 Hz) is assigned the core,in which it is implemented and the specifications for data exchange between different processors.Distribution of computational loads between different cores is optimized exploiting diagnostic tools that are interfaced with the real-time scheduler of the DSPACE target.
3 Validation criteria for continuous updating and validation of the installed software
In Fig.5,there is an example of results regarding the HIL testing of a WSP: starting from an assigned speed of 120 km/h the vehicle starts a full braking manoeuvre with degraded wheel–rail adhesion.The WSP system must protect wheels from blocking also optimizing braking performances respect to available wheel–rail friction factor.WSP corrections are performed by regulating the internal pressure of braking cylinders through the activation of two electro valves,called,respectively,EVR(recharge the brake cylinder)and EVS(discharge the brake cylinder).If both valves are closed,pressure in the brake cylinder is stable.

Fig.5 Example of results of a HIL braking test of a WSP with degraded adhesion: measured speed profiles (top) corresponding corrections in terms of pressures on brake cylinders and state of EVR/EVS valves (down)
WSP detects an incoming loss of adhesion by comparing the current peripheral speed of wheels with the estimated velocity of the vehicle.WSP logic can anticipate its intervention evaluating wheel accelerations:during braking manoeuvre,high axle decelerations are associated with a loss of adhesion.A sudden acceleration is used to identify an adhesion recovery.
As shown in Fig.5,there is a first phase corresponding to the initial application of braking forces.In this phase braking torques are gradually applied.Increasing sliding is recorded without any detection by the WSP system.Since the speed of every wheel is quite similar,also the vehicle velocity estimated by the WSP,the so-calledVref,is affected by big approximations.Accordingly,errors between the estimated speedVrefand the real oneVtrainare appreciable.
The activation of the WSP is typically associated with the detection of high deceleration of wheels due to an incoming loss of adhesion.The value of deceleration measured before the first intervention of the WSP is used by regulations in force as an indirect method to identify the real value of simulated adhesion.As WSP starts to modulate braking forces,speed profiles of wheels exhibit a diverging behaviour.This behaviour is a key factor for an efficient action of the WSP system: thank to differences between observed wheel velocities,WSP can better identify the state of each wheel,improving the estimation ofVrefand the applied corrections of braking forces respect to current adhesion.In this way the system converges to a more stable behaviour with smoother interventions of the WSP valves.The real-time model of the HIL Rig must be able to simulate several physical phenomena that concur to cause this typical behaviour of the WSP during a degraded adhesion test:
• Vertical load transfer,
• Friction properties of brake friction elements (brake pads or shoes),
• Wheel–rail adhesion model including energy–related cleaning effects,
• Dynamical behaviour of the pneumatic brake plant.
3.1 Vertical load transfer
The model adopted for the calculation of vertical load transfer between vehicle axles is taken from the literature[14–17].It is modelled a coach with two bogies,and each bogie is equipped with two independent wheelsets shown in Fig.6.A quasi-static formulation (neglecting the dynamical behaviour of suspension system)is described by
whereNaa,Nap,Npa,andNppdenote the vertical contact force of the corresponding axle of the bogie (p=rear,a=front);NaandNpare the vertical contact force of the front and rear bogies,respectively;mbandmcdenote the lumped masses of bogie and carbody;hgc,hgb,ht,andhbare geometrical dimensions that describe the bogie model;iis the distance between bogies;pis the distance between axles of the same bogies.
For every new vehicle model,relationship (Eq.(1)) is preliminary implemented to verify the correctness of geometrical dimensionshgb,hgc,hb,andpthat determine the steady-state response in terms of static and quasi-static load transfers between axles.Forces exchanged with the rest of the train are calculated considering an equivalent lumped system as shown in Fig.7;this is an optional feature that can be used to evaluate how the interaction between tested vehicle and the rest of the composition influences the behaviour of the WSP.
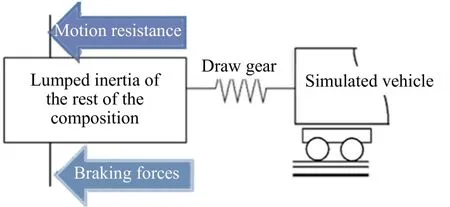
Fig.7 Calculation of longitudinal effort transmitted along vehicle draw gear
3.2 Brake pad friction models
Friction of railway brake pads μbis about 0.35(this value is mainly referred to ‘‘organic’’ pads according UIC541-3).However,real brake pads exhibit a certain variability of friction respect to several factors,especially to speed.For homologated pads this variability is limited but not negligible.In the rig,braking performances are simulated considering the specific behaviour of a known brake pad model.Friction coefficient of the brake pad is modelled introducing a tabulated relationship between the brake friction factor μb,the vehicle speed,and applied braking/clamping forces.
3.3 Wheel–rail adhesion models
As shown in Fig.8,wheel–rail adhesion μwis modelled as a tabulated function of wheel–rail relative sliding εr.According to the value of εr,different behaviours can be identified:
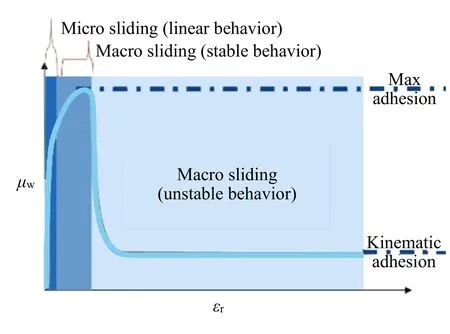
Fig.8 Behaviour of adhesion (redrawn from Ref.[18])
• Micro-sliding: in this region sliding is limited to very low values(as example 10–4–10–3);according to Kalker model,friction is almost proportional to wheel-rail sliding.
• Macro-sliding,stable region: in this region the behaviour is still stable since an increase of wheel sliding is associated with an improvement of wheel-rail adhesion.However,recorded sliding is quite high(10–2–10–1).As sliding increases,friction factor saturates to a maximum value.
• Macro-sliding,unstable region: in this region there is a sudden decrease of the friction factor respect to relative sliding.This region corresponds to the transition from a static to a kinematic friction factor.
When good adhesion conditions are recorded,wheel sliding is negligible (micro-sliding).Otherwise,with degraded adhesion conditions WSP must avoid excessive wheel sliding.Ideally the maximum level of available adhesion is exploited maintaining the wheel in the stable reason.Respect to this widely accepted approach the rig model adopted some further correction of the adhesion law.
In Fig.9a it is shown the recorded behaviour of a WSP system during a real degraded adhesion test performed on a coach with a starting speed of 120 km/h;wheel–rail adhesion is degraded by injecting some contaminants in front of the incoming vehicle.Wheel of the first axle encounters the highest quantity of contaminants.As wheels slide over contaminated surfaces of the rail,dissipated energies and high contact pressures tend to remove contaminants from rolling surfaces increasing the level of available adhesion.As consequence,as shown in Fig.9a,recorded wheel sliding decreases from the first axle (corresponding to wheel speed profilevaa) to the following ones.
This cleaning effect has been studied during past research activities[19]in terms of statistical distribution of degraded adhesion from the first vehicle to the following ones.This statistical distribution is referred to experimental data recorded by railway administrations and shared with UICs working groups.
Data shown in Fig.9b are referred to available adhesion recorded on each vehicle,so to obtain an equivalent distribution in terms of relative adhesion on each axle the following procedure is followed:
• Experimental data are interpolated using a cubic polynomial curve;then the interpolating curve is linearized around the value corresponding to the first coach.
• Respect to the mean adhesion considered for the vehicle,adhesion on wheels of the first vehicle is linearly interpolated.
• Limitations of braking forces applied on the rest of the composition are performed considering a weighted mean value of wheel–rail adhesion calculated according to the distribution shown in Fig.9b.
According to results of Fig.9a,another phenomenon is also recognizable: recorded vehicle speed profile is a bit convex,and overall vehicle deceleration increases at lower speed.This increased braking performance at low speed is associated with a reduced modulation of WSP braking forces and to a light increase of available wheel–rail adhesion.Reduced modulation of WSP is not only caused by the increase of available adhesion but also by its internal calibration:
• As shown in the example of Fig.5,many WSP systems after a finite number of brake modulation cycles can converge to the application of a mean stable braking force which is substantially optimal respect to available adhesion.A reduced modulation of braking forces involves higher mean tangential forces and consequently higher decelerations.
• Many WSPs are calibrated to tolerate higher sliding at low speed,when the risk of wheel flat is lower.For this reason,performed modulation of braking forces under 30–40 km/h is gradually reduced leading to a slight increase of the braking performance.
• Many brake pads exhibit an increase of friction coefficient behaviour at low speeds,which contributes to improve braking performances.
There are some experimental tests on real vehicles,such as the one shown in Fig.10a,in which the increase of vehicle deceleration at low speed is numerically important and it can be explained by an increase of available wheel–rail adhesion.
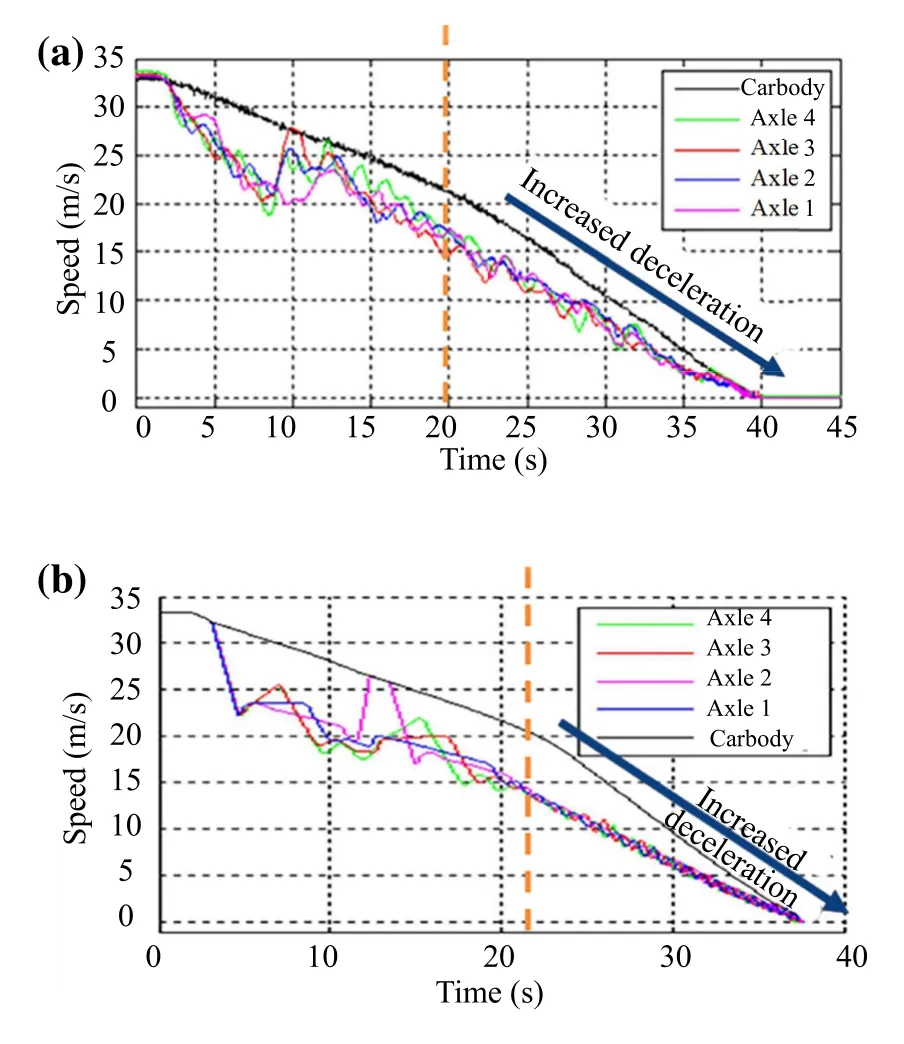
Fig.10 a Example of degraded adhesion test performed on a real vehicle on a railway line with degraded adhesion conditions;b results of HIL testing/simulation on the WSP test rig of the same test
The increase of wheel–rail adhesion can be modelled as the effect of a local cleaning acting on rolling surfaces:power dissipated in wheel-rail contact patchWdis defined,according to Eq.(2),as the product between exchanged tangential effortsTwand absolute sliding (the difference between vehicle speed and wheel peripheral one).
wherevis longitudinal speed,ωwis rotational speed of the wheel,andrwis rolling radius of the wheel.
PowerWdis dissipated over an arc of contact whose length is proportional to wheel peripheral speed,so the powerWarcthat is dissipated respect to wheel surface is proportional to relative sliding:
High level ofWarcis associated with wear of rolling surfaces and consequently to a high rate of removal of contaminants.The volume of removed contaminants on the contact patch is proportional to the integral of the dissipated powerWarc.The energyEarcin Eq.(4) is assumed to be dissipated on the contact patch.
The integral in Eq.(4) is calculated over a finite time interval: the model reproduces the continuous flow of contaminants that can restore the lubricant film in a finite amount of timetrest.This effect has been verified on experimental data collected in a previous campaign of Trenitalia by Ref.[20].
EN 15595[2]gives some indirect indications that allows to calibrate the model:the maximum valueElimofEarcthat should produce a complete removal of contaminants corresponds to about 7–8 kJ/m,while values under 1 kJ/m(Emin) should produce negligible effects.
Wheel–rail adhesion is further corrected assuming a linear relationship in Eq.(5)between the value ofEarcand the corresponding value of μw.The value of μwis increased from a minimum value μmin(contaminants maintain degraded adhesion conditions) and a maximum one μmax(contaminants have been removed).
This approach is an evolution of the Reye-Archard model that is used to predict the wear of rolling/sliding surfaces.Correction of available adhesion is performed as a function of specific energyEarc,so this criterion is often indicated as energetic model.
This degraded adhesion model was validated from experimental data proposed by Trenitalia from the beginning of rig activities [21],and it is validated over an increasing population of data made available by experimental activities that are continuously carried by Italcertifer.Further studies proposed in the literature by different research groups [18,22,23] have substantially confirmed the validity of this approach.
Some minor differences between adhesion models concern the interpolation of adhesion respect to dissipated energy in wheel–rail interface.The cleaning effect described by Eq.(5) is strongly affected by the behaviour of tested WSP.Results of Fig.10a are referred to a degraded adhesion test performed on a real vehicle.In this case the action of the WSP system is not able to avoid high sliding.Therefore,when the level of dissipated energy rises over a certain level,mean deceleration of the vehicle increases.
A similar behaviour is shown in Fig.10b where a similar test run is reproduced on the HIL rig: in this case the WSP allows high sliding;then,according to the model described by Eq.(5),the energy dissipated in the contact patch can partially restore the adhesion increasing the mean deceleration of the vehicle.
In a real test,the magnitude of this cleaning effect also depends on other factors like the nature of contaminants,surrounding environmental conditions (as example temperature),and by other tribological properties of wheel and rail that can be affected by prolonged testing campaigns.The execution of many degraded adhesion tests repeated in few hours should affect tribological properties of rolling surfaces especially if high sliding is involved.
However,the behaviour of a good,homologated WSP system is better represented by the examples of Figs.5 and 9.A good WSP can protect rolling surfaces from excessive sliding limiting the cleaning effect which is potentially dangerous in terms of wear of wheel surfaces.
3.4 Dynamical behaviour of the pneumatic brake plant
Application of braking forces is performed through a pneumatic plant whose components are affected by friction and other nonlinear dynamic effects that are widely studied and documented in Refs.[24,25].On a level 1 test rig for WSP,the pneumatic brake plant is physically reproduced on the rig.Nonlinear behaviour of the pneumatic plant is excited by the interaction with WSP.As shown in Fig.11,WSP valves are fed by real pneumatic relay/amplifiers and are connected to real brake cylinders.

Fig.11 Brake plant of the Italcertifer test rig (scheme from the HMI of the rig,version 2020)
Pressure drops in calibrated capacities that fed the brake plants are used to evaluate air consumptions[2].Reference pilot pressure for pneumatic amplifiers is provided by a model of the brake distributor.Distributor is simulated with a piecewise linearized model,an approach that is often adopted for real-time applications[26].There is no need to simulate brake pipe dynamics since WSP tests are performed on single coaches,so delays associated with propagation along the pipe are almost negligible.The other pipes of the vehicle plant are physically reproduced on the rig,contributing to a realistic behaviour of the system.The rig brake plant is calibrated to reproduce cylinder filling time and pneumatic resistances/capacities of the vehicle.
The response of real pneumatic components and their complex interactions with tested WSP produce some variability on degraded adhesion tests that are shown in the examples of Fig.12a,b,and c,where a braking manoeuvre with an initial speed of 120 km/h is repeated ten times,simulated conditions and tested WSP are the same,and results of these repeated tests are compared.
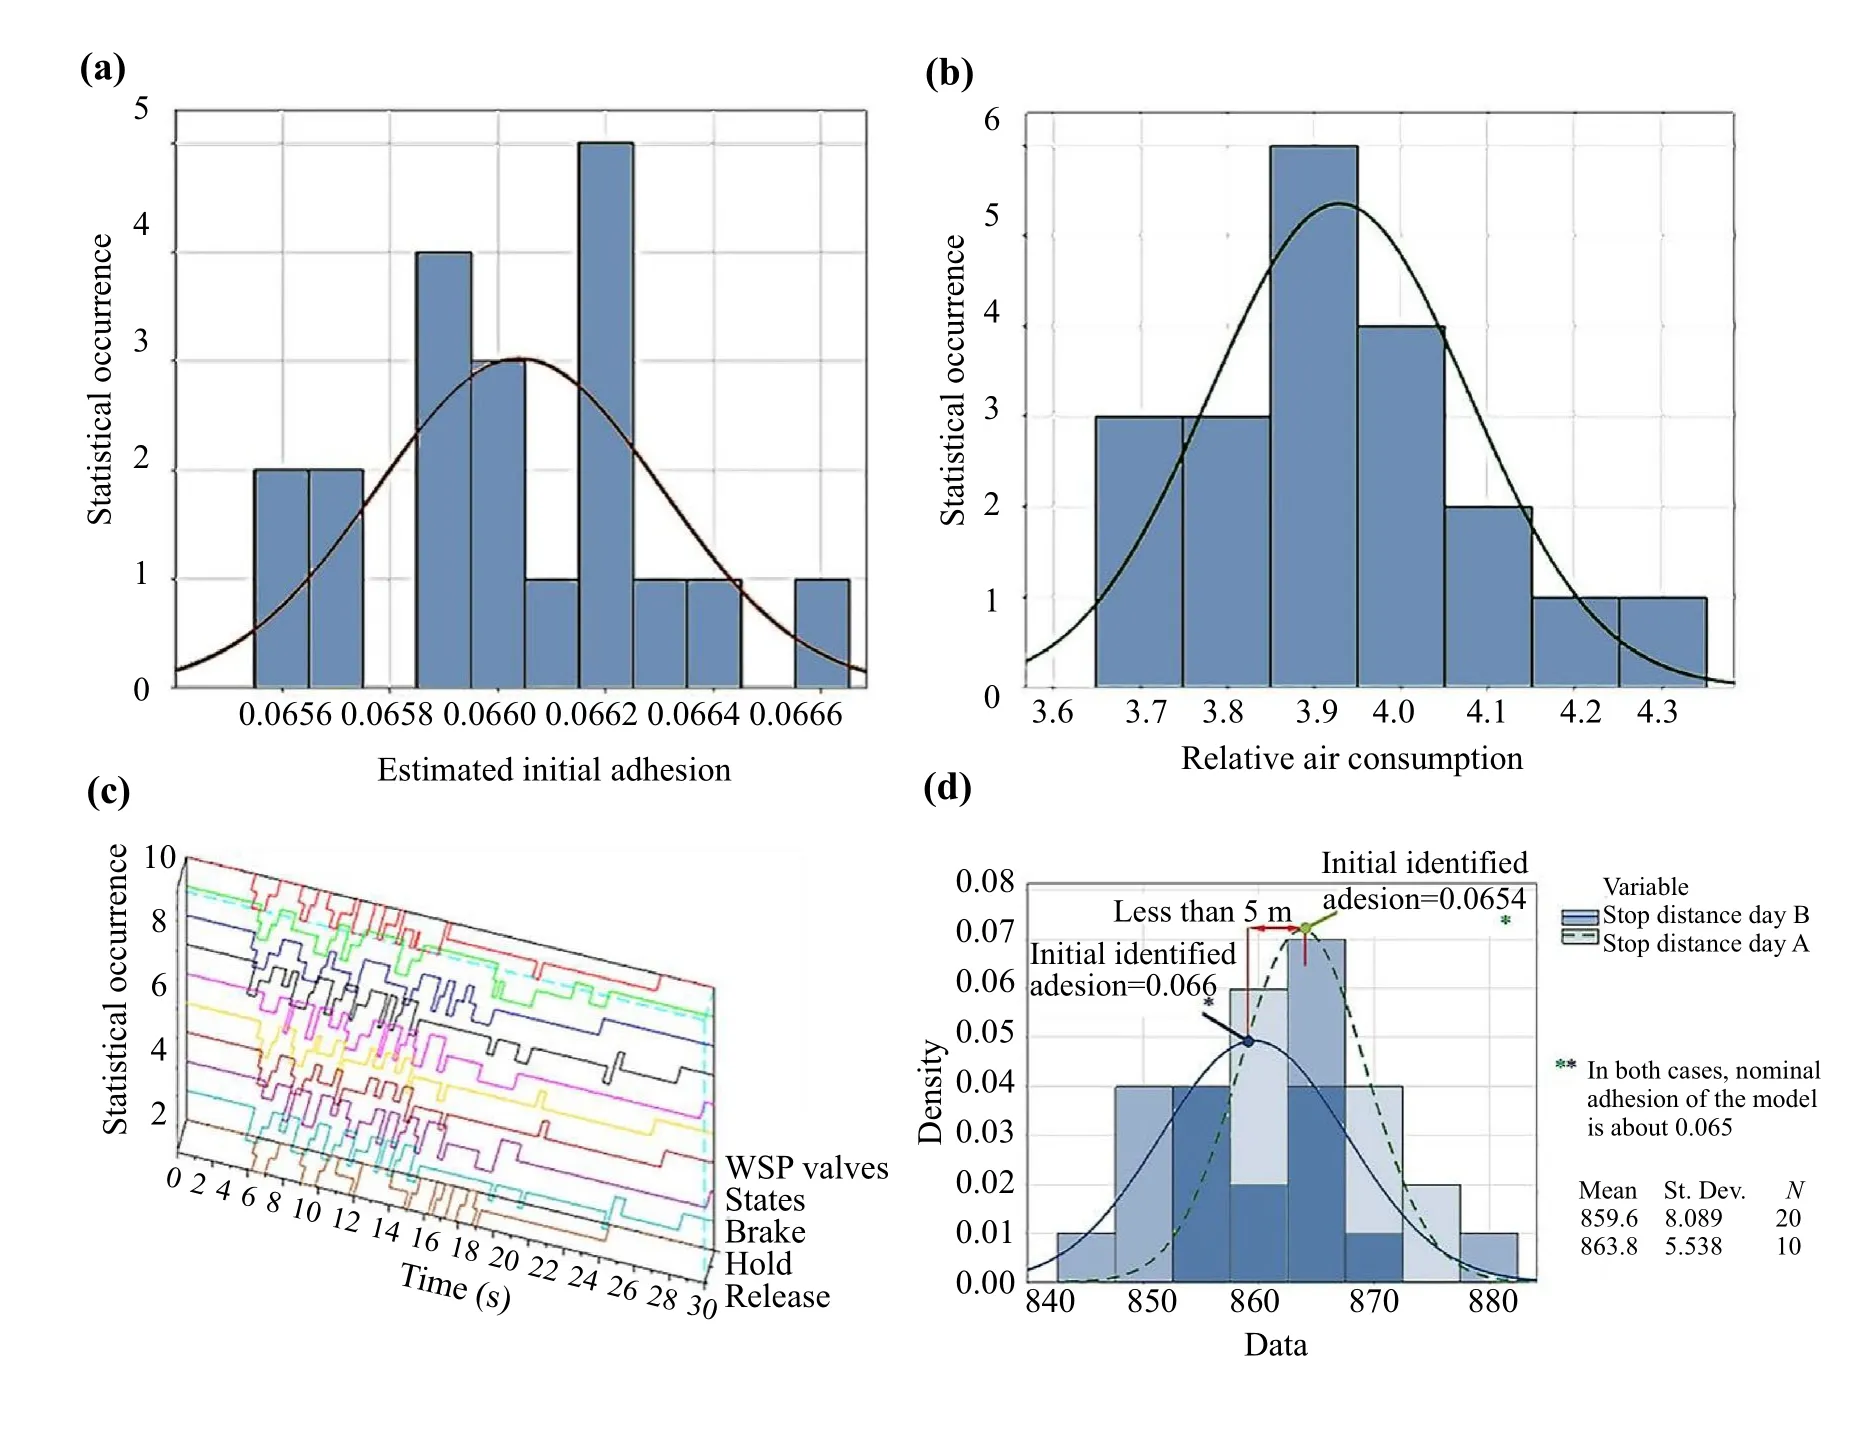
Fig.12 a Repeatability in terms of initial estimated adhesion over a population of ten consecutive tests on the same homologated WSP;b repeatability in terms of relative air consumptions(ten degraded adhesion tests from an initial speed of 120 km/h with the same WSP);c state of the WSP valves regulating brake pressure of cylinders of the first axle in ten consecutive tests;d repeatability and stability of performed measurements in terms of simulated braking distance
Figure 12a shows the statistic distribution of the initial degraded adhesion[1,2].This index is interesting because this is not a parameter of the simulation but an index that is currently used to identify degraded adhesion value from data of a real experimental test.Degraded adhesion is estimated by measuring axles speed derivatives in the initial phase of the braking manoeuvre before WSP starts to modulate braking forces detecting excessive sliding.The value of identified adhesion has a very narrow distribution.Thus,all the performed tests are almost equivalent in terms of identified initial adhesion.Standard deviation of the observed population is lower than 0.3%of the mean value.These small errors are compatible with noise on sensors.
Figure 12b shows the statistic distribution of the relative air consumption of degraded adhesion tests.Relative air consumption is defined as the ratio between the air consumed during a degraded adhesion test and the corresponding consumption with good adhesion conditions(WSP does not modulate brake pressures).Standard deviation of measured air consumptions is higher,and it can be estimated as about the 4% of the mean recorded value.
In Fig.12c,it is shown the sequence of states of the WSP valves that control the brake pressures of the axle 1 for the ten consecutive tests: even light disturbances produce appreciable variations in terms of recorded interventions of the WSP system.Results in terms of air consumptions are quite repeatable,since they depend on the statistic occurrence of WSP interventions;however,some small fluctuations are possible.
Figure 12d shows fluctuations in terms of measured stopping distances.Despite above-mentioned variability of the WSP corrections,recorded stopping distances are very repeatable.Standard deviation of recorded stopping distances is about 0.85% of the mean value.
In the same figure results performed in different seasons(winter 2020 vs summer 2021) are compared: measurements are stable since the mean difference in terms of braking distances measured after 8 months with different environmental conditions is about 5 m (0.05%) which is about negligible.
These negligible variations in stopping distance also produce very small variations of estimated initial adhesion.Both variations are physically coherent: recorded increase/decrease of braking distance is justified by a corresponding variation of the initial estimated adhesion.
These results are quite interesting since they show that negligible variations of testing conditions produce completely different sequences of intervention of the WSP valves that are associated with small fluctuations of air consumptions.They justify the adoption of real pneumatic components since it creates a realistic variability in performed tests.The effect in terms of variability of braking distance for a good homologated WSP is almost negligible.HIL testing offers the possibility of stressing the robustness of a WSP system,maintaining an excellent repeatability and stability for what concern safety relevant parameters such as braking distance.This high repeatability is also related to the tested WSP.Algorithms of UIC homologated systems are typically robust enough to properly handle real noisy measurements.
3.5 Numerical validations: continuous maintenance and verification of the software
The whole test rig is homologated.Also,real-time models used for HIL testing are a part of the rig.A continuous update and maintenance of the system is required mainly for two reasons:
• Continuous progress of tested WSP which often involve customizations,
• Unavoidable hardware and software maintenance or updates due to ageing of electronic hardware (as example ageing of host workstation) and software(update of drivers,compilers,MATLAB release,etc.).
After many years of activity,a complete renewal of the rig was performed.This renewal involved a complete update of workstations,operating system,releases of adopted simulation tool (DSPACE and MATLAB).
As shown in Fig.12,consecutive HIL tests repeated with the same WSP should produce the equal macroscopic results (as example in terms of stopping distance),but the time history of recorded WSP interventions is variable.
For this reason,the comparison of results of HIL test is very important,but it cannot be used to evaluate small numerical errors that should be introduced,as example,by the migration between different releases of MATLAB/Simulink.So,numerical verifications concerning the stability of the rig software are performed adopting the following procedure:
• Verification of sub-models with synthetic inputs,
• SIL verification of a compiled rig model,
• HIL verification of the RIG with a homologated WSP.
3.5.1 Verification of sub-models with synthetic inputs
The simulation software of the rig is composed by several modules,such as vehicle models and brake plant models.For each module it is possible to define several different variants (for example vehicles with a different wheelsets).Finally,each variant of the same module can be configured with a different set of parameters (such as a vehicle of a different mass and geometric dimension).
For every simulation on the rig,the chosen model is completely reassembled and recompiled starting from this library of sub-models.After a software migration/update every sub-model of the library is tested separately with assigned inputs.In this way it is possible to preliminarily verify the implementation of each sub-model that should be used by larger number of assembled models.
3.5.2 SIL verification of compiled RIG model
As shown in Fig.4,the test rig supports a complete SIL(software in the loop) implementation in which a virtual model of the tested WSP interacts with the whole model of the vehicle.Due to the absence of any external noise introduced by sensors and actuators,these tests are completely repeatable.In this way it is possible to evaluate the stability of the calculated results respect to maintenance interventions by comparing results of the same simulations performed before and after the introduction of maintenance interventions.These SIL campaigns reproduce the same testing sequences that are normally used to verify the behaviour of a WSP[1,2].Simulated WSP reproduces the behaviour of existing industrial products whose internal logic is completely known from previous research activities.
In Fig.13 an example is shown,where the simulated coach is a Eurocity SBB-P3 equipped with a Micro-Wupar WSP.Simulated initial speed for degraded adhesion braking is 160 km/h.The simulation results performed with the software before (old) and after (new) the maintenance intervention are identical both in terms of speed and pressure profiles:the sequence of WSP interventions is not affected by maintenance activities performed on the rig.Time histories of WSP valves are completely repeatable.
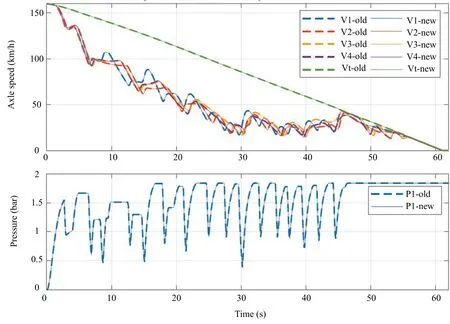
Fig.13 Comparison of the same SIL test performed with the software before(old) and after(new) a maintenance intervention(Eurocity SBBP3,Parizzi Wupar WSP device,low adhesion)
This is a significant result considering that minimal variations on signals in HIL tests should produce the variability of WSP interventions shown in Fig.12c.We evaluated the difference between calculated continuous states such as brake pressures in cylinders and axle speed.Calculated brake pressure is variables that are affected by the highest numerical noise.Results are encouraging:numerical differences between pressure profiles are almost Gaussian,the mean value of relative errors is null,and their standard deviation is equal to about 2 × 10⁻⁷.This is a very good precision considering that current EPS (maximum relative precisions in the representation of a singleprecision floating number represented in MATLAB 2019A)is about 1.19 × 10⁻⁷.This small numerical noise is compatible with the update from a 32-bit implementation(MATLAB 6.5.1)to a full 64-bit one(MATLAB2019A)or to other minor updates concerning numerical management of saved data.
From a practical point of view,a relative error of 10–7on simulated braking pressures implies absolute errors in the order of 10–2Pa which are almost unsignificant for any brake system.This level of numerical noise is visible only in a full simulation environment;for HIL testing,braking pressures are measured by real sensors that are much noisier (real measurement errors of about 500–1000 Pa).
3.5.3 HIL verification of the RIG with a homologated WSP
Verifications on sub-models and SIL testing demonstrate the numerical stability of the RT model against maintenance activities.A further verification is performed by repeating the same HIL tests on the same WSP.Results obtained after maintenance intervention are compared with the ones obtained before.Performed tests,listed in Table 1,are the same that are usually prescribed for WSP testing[1,2].
Every test of Table 1 is repeated ten times: the mean error between the tests performed before and after the maintenance intervention is evaluated.This error/difference is compared with the repeatability of the same tests performed several times.Three parameters are evaluated:the braking distance,the duration of the braking and the sliding distribution index GM [1,2]:
wheretirepresents the duration of sliding whose amplitude is higher than 10%,andTis the duration of the braking manoeuvre from the maximum/initial speed to a minimum value of 60 km/h.This minimum value is considered since sliding at low speeds is less important to preserve the integrity of rolling surfaces.Also,in terms of braking distance a suboptimal behaviour at low speeds has limited consequences.
In Table 2,the mean error is evaluated between an old test(before maintenance activities)and the new ones(after maintenance activities) in terms of braking distances,duration,and GM index.
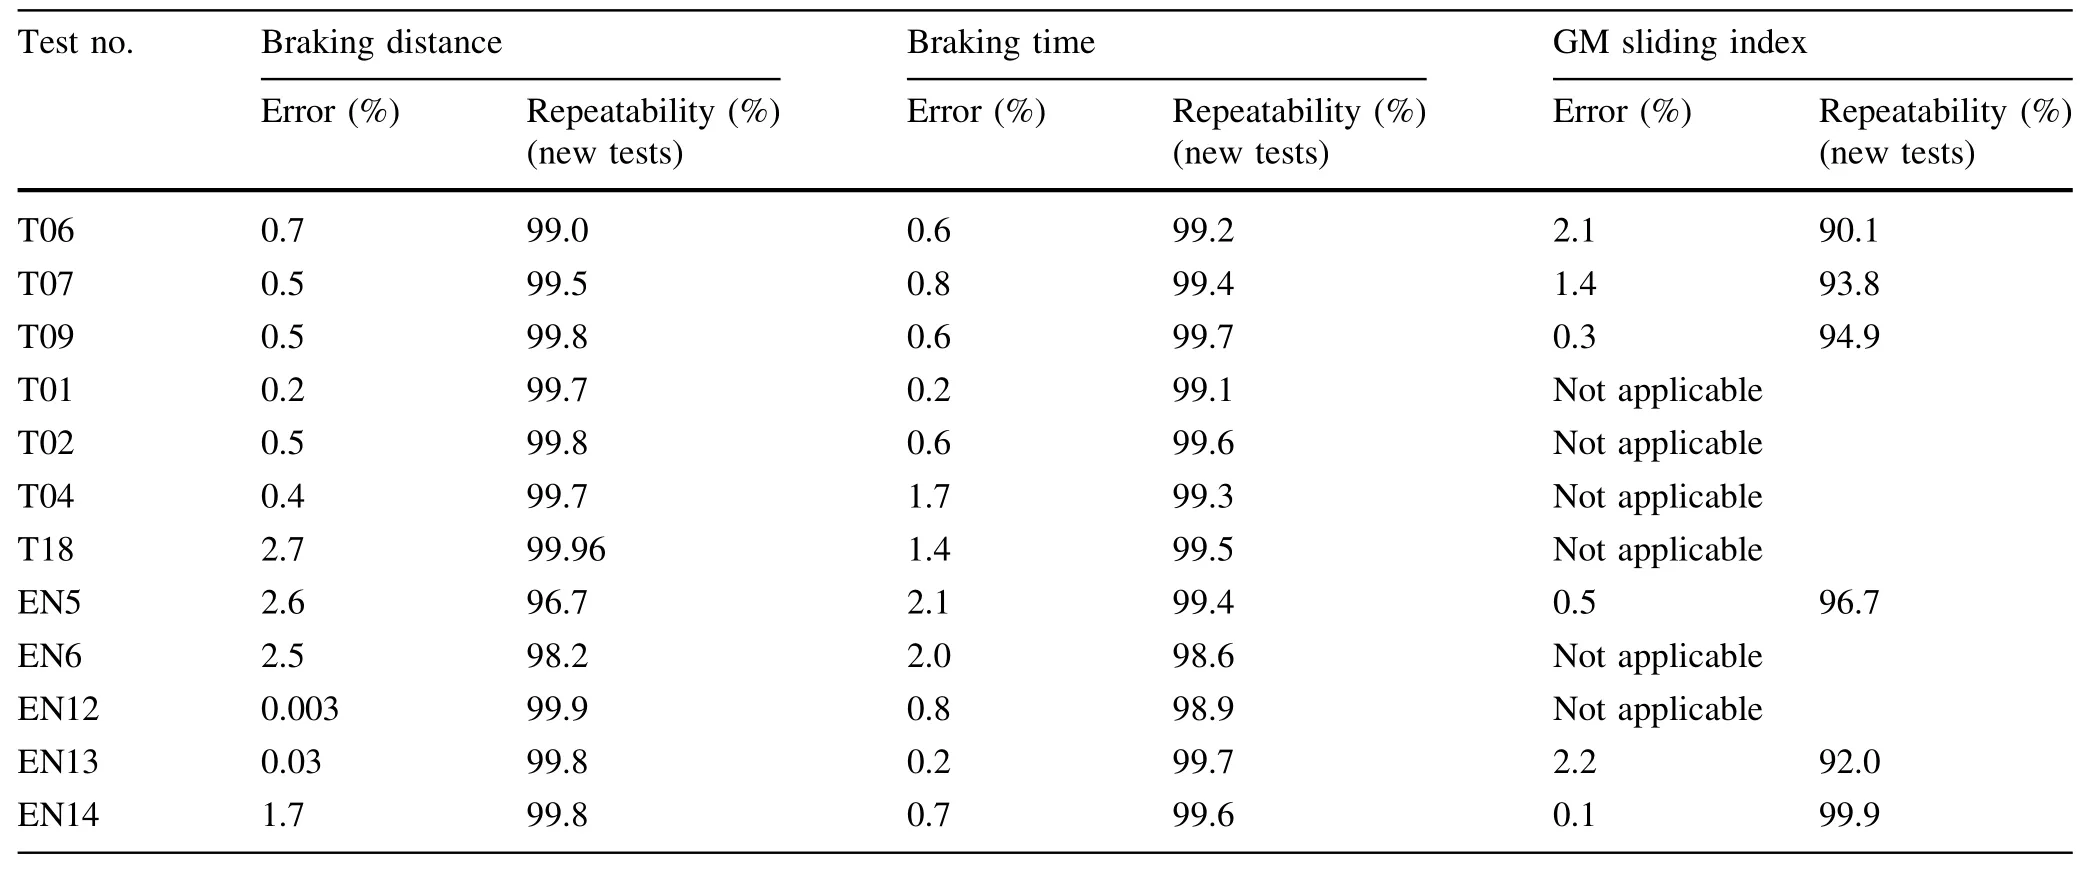
Table 2 HIL testing of the RIG: evaluation of braking distance,duration/time,and GM index
The difference between the old test and the mean of the new ones is quite low,and its value is comparable with the standard repeatability of tests performed after maintenance activities.For the GM index,the mean error is much lower than their repeatability;this result is coherent with previous results of Fig.12c:time histories of WSP interventions are much more variable respect to braking distances.This variable sequence of WSP interventions is an important feature of the rig,since it allows to test the WSP with noisy perturbed physical signals that reproduce the behaviour of a real pneumatic brake plant.
These differences cannot be addressed to the behaviour of the real-time model since previous SIL testing activities have demonstrated the absolute stability of performed calculations.These results are very interesting also considering that the ‘‘old’’ reference test of the WSP was performed several years before (about 16 years ago): performed analysis is also indicative of the overall stability of rig performances after many years of activity and several maintenance interventions.
4 Conclusions
In this work we have extensively analysed the key features that have assured the success and technical longevity (in service from 2002 to 2003) of the Italcertifer test rig of Firenze Osmannoro.These include the chosen software architecture that has assured a continuous expansion rig functionalities and an easy maintenance of the system.
Another important aspect is represented by a continuous monitoring of the real-time simulation software that is performed at multiple levels considering both verification of each sub-model and the SIL simulation of entire vehicle models.
Real pneumatic components are still fundamental to reproduce the behaviour of brake plants.Despite the continuous progress in the simulation tools of pneumatic brakes [27],real components are affected by disturbances and nonlinear behaviours that are still very hard to be reproduced mathematically.This feature is fundamental to stress and debug the logic of innovative WSP systems with disturbances that are physically coherent with the behaviour of real components.
The main contribution of this work is represented by the development of specific criteria to verify the repeatability and stability of rig performances respect to continuous update and maintenance activities.
This is an important result;because of continuous verification and validation it is an indispensable pre-requisite for the diffusion of HIL testing for safety-related railway applications.This is especially true for WSP testing where the behaviour that must be assessed is quite complex involving the evaluation of different performance and robustness indexes such as brake distance,air consumptions.
Authors hope that this contribution will help researchers around the world to increase the number and the variety of HIL test rigs that can perform degraded adhesion simulations in a reliable way stimulating new applications and ideas.
Open AccessThis article is licensed under a Creative Commons Attribution 4.0 International License,which permits use,sharing,adaptation,distribution and reproduction in any medium or format,as long as you give appropriate credit to the original author(s) and the source,provide a link to the Creative Commons licence,and indicate if changes were made.The images or other third party material in this article are included in the article’s Creative Commons licence,unless indicated otherwise in a credit line to the material.If material is not included in the article’s Creative Commons licence and your intended use is not permitted by statutory regulation or exceeds the permitted use,you will need to obtain permission directly from the copyright holder.To view a copy of this licence,visit http://creativecommons.org/licenses/by/4.0/.
 Railway Engineering Science2023年2期
- Railway Engineering Science的其它文章
- An approach for simulating the air brake system of long freight trains based on fluid dynamics
- Braking distance prediction for vehicle consist in low-speed on-sight operation: a Monte Carlo approach
- A simplified pneumatic model for air brake of passenger trains
- Influence of quick release valve on braking performance and coupler force of heavy haul train
- A numerical method for the simulation of freight train emergency braking operations based on the UIC braked weight percentage
- The effect of controllable train-tail devices on the longitudinal impulse of the combined trains under initial braking