
Temporal dynamics of microglia-astrocyte interaction in neuroprotective glial scar formation after intracerebral hemorrhage
2023-09-26 01:05JingweiZhengHijinWuXioyuWngGuoqingZhngJinnLuWeilinXuShenbinXuYunjinFngAnkeZhngAnwenShoShengChenZhenZhoJinminZhngJunYu
Jingwei Zheng , Hijin Wu , Xioyu Wng , Guoqing Zhng , Ji'nn Lu ,Weilin Xu , Shenbin Xu , Yunjin Fng , Anke Zhng , Anwen Sho ,Sheng Chen , Zhen Zho , Jinmin Zhng ,b,c,**, Jun Yu ,*
a Department of Neurosurgery, Second Affiliated Hospital, School of Medicine, Zhejiang University, Hangzhou, 310000, China
b Key Laboratory of Precise Treatment and Clinical Translational Research of Neurological Diseases, Hangzhou, 310000, China
c Stroke Research Center for Diagnostic and Therapeutic Technologies of Zhejiang Province, Hangzhou, 310000, China
d Center for Neurodegeneration and Regeneration, Zilkha Neurogenetic Institute and Department of Physiology and Biophysics, Keck School of Medicine,University of Southern California, Los Angeles, CA, 90089, USA
Keywords:
Microglia
Astrocytes
Glial scar
Intracerebral hemorrhage
A B S T R A C T
The role of glial scar after intracerebral hemorrhage (ICH) remains unclear. This study aimed to investigate whether microglia-astrocyte interaction affects glial scar formation and explore the specific function of glial scar.We used a pharmacologic approach to induce microglial depletion during different ICH stages and examine how ablating microglia affects astrocytic scar formation.Spatial transcriptomics(ST)analysis was performed to explore the potential ligand-receptor pair in the modulation of microgliaastrocyte interaction and to verify the functional changes of astrocytic scars at different periods. During the early stage,sustained microglial depletion induced disorganized astrocytic scar,enhanced neutrophil infiltration, and impaired tissue repair. ST analysis indicated that microglia-derived insulin like growth factor 1(IGF1)modulated astrocytic scar formation via mechanistic target of rapamycin(mTOR)signaling activation.Moreover,repopulating microglia(RM)more strongly activated mTOR signaling,facilitating a more protective scar formation. The combination of IGF1 and osteopontin (OPN) was necessary and sufficient for RM function, rather than IGF1 or OPN alone. At the chronic stage of ICH, the overall net effect of astrocytic scar changed from protective to destructive and delayed microglial depletion could partly reverse this.The vital insight gleaned from our data is that sustained microglial depletion may not be a reasonable treatment strategy for early-stage ICH. Inversely, early-stage IGF1/OPN treatment combined with late-stage PLX3397 treatment is a promising therapeutic strategy. This prompts us to consider the complex temporal dynamics and overall net effect of microglia and astrocytes,and develop elaborate treatment strategies at precise time points after ICH.
1. Introduction
Astrocytes are derived from neuroepithelial progenitors and tile the entire central nervous system(CNS).Astrocytes provide glucose metabolites as energy support to neurons,constitute the blood-brain barrier (BBB), and promote cerebral interstitial fluid transfer [1].However,external stimuli may induce astrocyte reactivity,which can cause significant changes in astrocyte transcriptome, functions, and morphology in diverse CNS disorders [2]. These changes alter the ability of astrocytes to exert homeostatic maintenance functions.The role of reactive astrocytes has been a subject of some debates for several decades. Many studies indicate that the dense glial scar formed by reactive astrocytes presents a physical barrier to axon regeneration after spinal cord injury or stroke [3,4]. Moreover,damage associated molecular patterns derived from reactive astrocytes may further exacerbate CNS injuries.For instance,chondroitin sulfate proteoglycans(CSPGs)produced by reactive astrocytes were regarded as a crucial inhibitor of axon growth[4].Astrocytes-derived pro-inflammatory cytokines (interleukin-1β (IL-1β), interferon-γ,and IL-6, etc.) would cause neuroinflammation [5]. However, selective ablation of scar-forming reactive astrocytes increased peripheral immune cells infiltration,lesion expansion,failure of BBB repair,and oligodendrocyte death[3].These findings initially revealed the dual nature of reactive astrocytes.
A landmark study has demonstrated that neuroinflammation and ischemia activate two different types of reactive astrocytes:neurotoxic A1 and neurotrophic A2 [6]. A subsequent study revealed that inflammatory stimuli caused heterogeneous responses in astrocytes with defined transcriptomic profiles at a single-cell resolution [7]. This shed new lights on astrocyte heterogeneity and its potential influence on CNS pathology.
Intracerebral hemorrhage(ICH)accounts for 20%-30%of stroke cases,which is the leading cause of death and disability worldwide[8]. Previous studies have demonstrated that both ischemia and hemorrhage may induce severe astrogliosis[9].Ischemia seemed to induce neurotrophic A2 astrocytes [10]. Inversely, A1 astrocyte marker genes were detectably expressed in diverse neurodegenerative diseases [6]. The heterogeneity of astrocytes has ignited tremendous research interest into the specific roles and potential functions of astrogliosis after ICH.
The CNS is a complex system orchestrated by neurons and glial cells including astrocytes and microglia. As resident immune cells,microglia are the foremost cells participating in the pathological process of ICH [11]. ICH can induce extreme changes in microglia morphology,function,and the transcriptome,which is termed‘activation’ [12]. Initially, the M1/M2 terminology was used for naming heterogeneous activation states of microglia (M1 for proinflammatory and M2 for anti-inflammatory). Since the current single-cell sequencing studies reveal microglia's complexity and dynamic states, the nomenclature is under further refinement [10].However, the specific roles and functions of microglia after ICH remain controversial.
Like many great duos, astrocytes and microglia seem to have a unique bond. Microglia-astrocyte communication represents a delicate balance orchestrating neural cell functions when the brain is perturbed [13]. Barres and co-workers [6] demonstrated that microglia-derived tumor necrosis factor (TNF), complement C1q (C1q), and IL-1α were necessary and sufficient to activate A1 astrocytes. Microglia also promote neuroprotective astrocyte formation via downregulation of the purinergic receptor P2Y1 after traumatic brain injury[14].In addition,our previous study showed that ICH induced severe astrogliosis and microgliosis, which subsequently made up the glial scar surrounding the lesion[15].Hence,microglia may play a crucial role in modulating astrocytic scar formation.
To better understand the interaction between microglia and astrocytes after ICH,we used a pharmacologic approach to deplete microglia and examine how ablating microglia affects astrocytic scar formation after ICH. Spatial transcriptomics (ST) analysis was performed to investigate the potential ligand-receptor that participates in mediating the interaction of microglia and astrocytes after ICH. The present study also intended to figure out what specific role the glial scar might play in the pathological process of ICH.Does it hinder or support the tissue repair processes?The functions of microglia and astrocytes alter at different periods in various CNS disorders[1,16-19]. Therefore, the function of glial scar is likely to change at a different stage of ICH. If so, does pharmacological microglial depletion during different time periods cause distinct biological effects on tissue repair after ICH?Here,the present study focused on addressing these questions.
2. Methods
2.1. Ethics statement
All animal procedures were carried out under the Guide for the Care and Use of Laboratory Animals of the National Institutes of Health and approved by the Institutional Animal Care and Use Committee of Zhejiang University(Approval No.:AIRB-2022-0613).The animals were raised three per cage with controlled temperature and humidity and a 12 h light/dark cycle.
2.2. Experimental animals
Mixed-sex C57BL/6 wild-type (WT) mouse pups (postnatal within 24 h) and adult male C57BL/6 WT mice (25 g) were purchased from SLAC Laboratory Co., Ltd. (Shanghai, China).
2.3. ICH induction
C57BL/6 mice were anesthetized by injecting pentobarbital(40 mg/kg). Then, the experimental ICH model was induced by injecting collagenase VII(0.1U in 0.5 μL;Sigma,St.Louis,MO,USA)or 0.5 μL of saline(Sham group)into the right basal ganglia(0.2 mm anterior to the bregma, 2.2 mm right lateral to the midline, and 3.5 mm depth below the skull)using a stereotaxic frame and microperfusion pump within 5 min [15].
2.4. Spatial transcriptomics
2.4.1. Tissue collection for spatial transcriptomics
Adult mice were euthanized under deep pentobarbital anesthesia, and the brains were removed from the cranial cavity. The samples were embedded in Opti-mum cutting temperature compound (OCT) tissue freezing medium and snap-frozen in isopentane pre-cooled with dry ice and liquid nitrogen.
2.4.2. Library preparation and sequencing
The above samples were sectioned coronally with a cryostat at 10 mm thickness. Brain tissue sections were then fixed on a spatially barcoded array with 3.6%-3.8% formaldehyde solution at room temperature for 10 min, then treated for 1 min with isopropanol, and airdried. After tissue staining, imaging and prepermeabilizing, tissues were immediately permeabilized and followed by in situ reverse transcription. Finally, libraries were sequenced on the Illumina Nextseq platform (Illumina, San Diego,CA, USA) using paired-end sequencing.
2.4.3. Data processing
Sequenced raw data were processed using the ST Pipeline v1.45[20]. Data were mapped against the mouse genome (GRCm38. p6(mm10).) with Space Ranger 1.1.0, filtered low quality bases, and generated a count matrix.
2.4.4. Data analysis
The Seurat package (v3.1.5) was used to perform the fundamental downstream analysis and visualization. The CellPhoneDB package (v3.0) was used to assess cell-cell interaction between a variety of cells in brain tissue,the means of the average expression level of ligand and receptor in different spots represented the interaction strengths, and a P-value indicated the statistical significance [21,22]. Then the stLearn package (v3.0) was used to identify regions with high ligand-receptor interaction activity in the brain tissue [23].
2.5. Magnetic-associated cell separation (MACS) purification of astrocytes and RNA sequencing
Astrocytes were isolated from brain tissues by MACS.The brain tissue was dissociated mechanically, and then enzymatic cell dissociation was performed.Then cell suspension was filtered with a 70 μm cell strainer and resuspended in 30% percoll to remove myelin.Afterwards,cells were resuspended in 80 μL of MACS buffer and 10 μL of Fc receptor blocking regent. Subsequently, 10 μL of anti-astrocyte cell surface antigen 2(ACSA-2)magnetic microbeads(#130-097-679, Miltenyi Biotec, Cologne, Germany) were costained with the above-mentioned suspension. Ultimately, the magnetically labeled cells were separated by a suitable MACS separator.
Total RNA from astrocytes was purified using TRIzol reagent(Invitrogen,Carlsbad,CA,USA).The RNA integrity was assessed by Bioanalyzer 2100 (Agilent, Santa Clara, CA, USA). After the final transcriptome was generated, StringTie was used to evaluate messenger RNA (mRNA) levels by calculating fragments per kilobase of exon model per million mapped fragments.
2.6. RNA sequencing (RNA-seq) data analysis
Differential expression analysis was performed using the R package DEseq2. The differentially expressed genes (DEGs) were selected with fold change>2 or fold change<-2(false discovery rate (FDR) < 0.05). Functional enrichment analysis was performed by Metascape (http://metascape.org). A gene ontology term was predicted to be activated with a z-score > 2 and a P-value < 0.01,while a z-score ≤-2 and P-value < 0.01 predicted inhibition. The trend analysis for DEGs was performed by Short Time-series Expression Miner (STEM) software (http://www.cs.cmu.edu/~jernst/stem/). Ingenuity Pathway Analysis (IPA) software was used for pathway analysis.
2.7. Data availability
All relevant data are available from the authors. RNA-seq data are deposited at Genome Sequence Archive,with experiment codes CRA007667.
2.8. Microglial depletion
Colony-stimulating factor 1 receptor (CSF1R) signaling is responsible for microglia survival,differentiation,and proliferation.For microglia depletion, a CSF1R inhibitor PLX3397 (Selleck chem,Houston, TX, USA) was formulated in AIN-76 A standard chow at 290 mg/kg,starting 21 days before ICH surgery[24].Such approach can effectively deplete microglia in mice without neurological abnormalities [24].
2.9. Adeno-associated virus injection and drug administration
The following adeno-associated virus(AAV)vectors were made to express genes of interest in astrocytes(produced by ObioTechnology(Shanghai) Corp., Ltd., Shanghai, China; AAV titers: 0.5-2 × 10¹³copies/mL): AAV-GfaABC1D-enhanced green fluorescent protein(EGFP)-3× FLAG-WPRE(AAV-Control), AAV-GfaABC1D-Igf1-6× His-P2A-EGFP-3×FLAG-WPRE(AAV-insulin like growth factor 1(IGF1)),and AAV-GfaABC1D-Spp1-6× His-P2A-EGFP-3× FLAG-WPRE(AAVosteopontin (OPN)). Mice received a stereotactic injection with the 2 μL of the AAV mentioned above 14 days prior to ICH induction.Rapamycin(6 mg/kg/day,HY-10219;MedChemExpress,Weehawken,NJ, USA) was administered by intraperitoneal injection, starting immediately after ICH.Mice were orally administered with OSI-906(40 mg/kg/day, HY-10191; MedChemExpress), starting immediately after ICH.
2.10. Flow cytometry
As described previously [11], mice brain tissue was dissociated mechanically and digested with 0.6 mg/mL of collagenase IV(Worthington, New York City, NY, USA). After gradient centrifugation with percoll, the inflammatory cells were collected from the gradient interface. Single-cell samples were incubated with CD45-percp and CD11b-fluorescein isothiocyanate (1:200, V/V; BD Biosciences, Franklin Lakes, NJ, USA). CD45+lowCD11b+cells were considered as microglia. For astrocyte isolation, the abovementioned single-cell suspension were incubated with ACSA-2(1:100, V/V). Flow cytometric analysis was then performed using a flow cytometer (C6; BD Biosciences, San Diego, CA, USA) and FlowJo v10 software.
2.11. Transmission electron microscopy (TEM)
As described previously[25],TEM was used to measure myelin thickness around the ICH lesion. Brain samples (1 mm3fragments of peri-hematoma tissue) were collected at 21 days post-injury(dpi). The ultrastructure of the myelin was scanned using TEM(Philips Tecnai 10, Amsterdam, the Netherlands). The electron micrographs were taken at 15 K magnification, and Image J software was used to calculate G-ratios (the ratio of the inner axonal diameter to the total outer diameter).
2.12. Culture and treatment of primary glial cells
As described previously [26,27], cortices were isolated from newborn pups and cut into small pieces. After digestion, filtering,centrifugation,and resuspension,mixed glial cells were plated onto poly-D-lysine-coated T-25 flasks. Seven to 10 days later, microglia were separated from mixed glial cells by orbital shaking for 1 h at 180 rpm. The flask with mixed glial cells mentioned above was shaken for another 2 h at 250 rpm to remove other cells; then astrocytes were collected and re-plated on T-75 flasks.
2.13. Immunofluorescence staining
The coronal brain sections or primary cultured cells were incubated with diverse antibodies overnight, including antiphospho-S6 ribosomal protein (pS6) antibody (1:200, #4857;Cell Signaling Technology, Inc., Danvers, MA, USA), anti-glial fibrillary acidic protein (GFAP) antibody (1:200, #34001 S;Cell Signaling Technology, Inc.), anti-lymphocyte antigen 6 complex locus g antibody (1:200, ab25377; Abcam, Cambridge, MA,USA), anti-CD31 antibody (1:200, ab9498; Abcam), anticomplement C3 antibody (1:400; PA5-21349, Invitrogen, Carlsbad, CA, USA), anti-F-actin antibody (1:100, ab205; Abcam), anti-Iba-1 antibody(1:250,ab5076;Abcam),anti-IGF1 antibody(1:100,sc-518,040; Santa Cruz Biotechnology, Santa Cruz, USA), antimyelin basic protein(MBP)antibody(1:200,sc-66064;Santa Cruz Biotechnology), and anti-CC1 antibody (1:500, OP80; Millipore,Billerica, MA, USA). Afterwards, the samples mentioned above were preprocessed with the secondary antibodies and observed under a fluorescence microscope (Olympus, Tokyo, Japan). Subsequently, the immunostaining data analysis was performed by ImageJ software.
2.14. Quantitative real-time polymerase chain reaction (RT-PCR)
Total RNA was isolated from the mouse brain tissue or primary cultured cells using TRIzol reagent (Sigma-Aldrich, St. Louis, MO,USA).After complementary DNA synthesis, amplification, and PCR reaction, the cycle threshold values were collected. The 2-ΔΔCTmethod was applied for calculation. The target gene primers designed for quantitative RT-PCR are listed in Table S1.
2.15. Western blotting
As described previously [15], the protein samples were subjected to electrophoresis and transfer. Next, the polyvinylidene fluoride membranes were incubated with the primary antibodies overnight, including anti-pS6 antibody (1:1000, #4857;Cell Signaling Technology, Inc.) and β-actin (1:5000, ab8226;Abcam). A ChemiDoc detection system (Leica, Buffalo, IL, USA)was used to detect the signals of the protein bands. Then the data were quantified by Image J software.
2.16. Behavioral tests
2.16.1. Accelerated rotarod test
As described previously [28], to test the motor coordination and limb strength of the mice, an accelerated rotarod test was performed using Rotarod Treadmills (BW-ZH600, Shanghai Biowill Co., Ltd.) at 0, 1, 3, 7, 14, 21, and 28 dpi. The mice were placed on the accelerating rotarod (parameter setting: acceleration from 4 rpm; terminal speed 40 rpm; increasing 4 rpm every 30 s; and test time 5 min). The time during which the animals stayed on the rotarod was recorded. Data are expressed as the mean values from the three trials(each animal underwent the test three times a day with an interval of at least 15 min).
2.16.2. Adhesive removal test
The adhesive removal test was performed by an independent researcher to detect the tactile responses of the mice [11,25].Mice had been trained to familiarize them with the test for three days before the formal test. Adhesive tape (3 mm × 3 mm) was then pasted on the left forepaw (affected side). The time to contact and remove the adhesive tape was recorded(maximum test time: 120 s).
2.17. 5-ethynyl-2′-deoxyuridine (EdU) injection
To label proliferating cells in the CNS, the mice were intraperitoneally injected with EdU (50 mg/kg; Beyotime, Shanghai,China;C0075L) twice a day with an interval of at least 8 h. The injection started at 3 dpi for four consecutive days.The thymidine analogue was incorporated into cellular DNA and then visualized by “Click reaction” [25,29].
2.18. Evans blue dye extravasation
Evans blue dye (2%; 5 mL/kg body weight) was injected intraperitoneally for 3 h. Mice were euthanized with anesthesia and perfused with phosphate-buffered saline(PBS).Then the ipsilateral hemisphere of equal weight was collected and homogenized in 0.7 mL of PBS, and then centrifuged at 15,000 g for 30 min. Afterwards, the supernatant (0.5 mL) was added to 0.5 mL of trichloroacetic acid (at 4°C overnight). After centrifugation (4°C,15,000 g for 30 min), the supernatant was taken for spectrophotometric quantification of extravasated Evans blue dye at 610 nm.
2.19. Statistical analysis
The data are shown as the mean±standard error of the mean(SEM) for continuous variables with normal distributions. Between the two groups, the student's t-test was applied to determine the statistical difference.For continuous variables with nonnormal distributions, the Mann-Whitney U rank-sum test was performed. One-way analysis of variance (ANOVA) with Tukey's post-hoc analysis or two-way ANOVA with Tukey's multiple comparisons test were performed to determine the statistical difference among multiple groups. Based on pilot studies or the current literature, sample sizes were determined. Statistical Package for the Social Sciences(version 22.0)and Graphpad Prism(version 8.0) were used to evaluate statistical significance (a Pvalue of < 0.05).
3. Results
3.1. ICH-induced marked astrogliosis
To investigate spatiotemporal patterns of astrocytic changes after ICH, we first quantified the GFAP+cells in the ipsilateral hemisphere at 0, 7, and 21 days post-injury (dpi). Immunohistochemistry showed the resting astrocytes in the sham group(Fig.1A).However,ICH injury induced marked reactive astrogliosis and strong morphologic changes at 7 and 21 dpi(Figs.1B and C).As shown in Fig.1D, the number of astrocytes strongly increased and peaked at 7 dpi. In terms of morphology, typical palisading astrocytes formed long thickened processes oriented toward the lesion,and hypertrophic astrocytes were located behind the palisading astrocytes. These reactive astrocytes formed a compact border around the hematoma, which was an astrocytic scar.
3.2. Both A1 and A2 astrocyte participated in the astrocytic scar formation
Besides the morphological heterogeneity, ICH also induced transcriptomic changes in astrocytes. Previous studies demonstrated that lipopolysaccharide-induced neuroinflammation and ischemia activated two different types of reactive astrocytes, A1 and A2, respectively [10]. Therefore, we asked whether different types of injury can induce distinct types of reactive astrocytes. To investigate the composition of ICH-induced astrocytic scar, RNAseq was performed on astrocytes isolated from the perihematomal tissues (Fig. 1E). Astrocytes were MACS purified. The heat map depicted the expressions of pan-reactive, A1-specific and A2-specific markers of ICH-induced reactive astrocytes (Fig. 1F). It indicated that ICH injury induced both A1 (C3, Srgn, H2-D1, etc.)and A2(Emp1,Cd14,Ptgs2,etc.)astrocytes expressions at 7 dpi.As a classical A1-specific marker, C3 expression was still strongly expressed in astrocytes at 21 dpi. However, no statistically significant difference was observed in A2-specific marker expression at 21 dpi.
3.3. Spatial mapping of astrocyte-specific markers after ICH
Spatial transcriptome sequencing was performed on coronal brain sections to identify whether the above-mentioned astrocytespecific markers occupy distinct anatomical locations. The black circle marked the perihematomal regions that were consistent with GFAP+astrocytic scar area (Figs. 1G-I). As shown in Fig. 1J, A1-specific markers (C3 and Srgn) were distributed disorderly with low expression levels in the sham group. In contrast, C3 and Srgn were highly expressed around the lesion at 7 dpi.Subsequently,the expression of Srgn decreased at 21 dpi,whereas the C3 expression was not significantly decreased in the perihematomal region.Likewise, A2-specific markers (Emp1 and Cd14) were upregulated around the lesion at 7 dpi, and the expression level of Emp1 and Cd14 significantly decreased at 21 dpi.
3.4. Depletion of microglia-induced disorganized astrocytic scar after ICH
Upon damage to the CNS, astrocytes and microglia formed a compact glial scar around the lesion [30]. Our previous study also demonstrated that the activated microglia were embedded in the astrocytic scar and engulfed myelin debris after ICH[15].As shown in Fig.2A,these ICH-induced palisading astrocytes with long thickened processes oriented toward the lesion and formed a compact scar.However,the PLX3397 administration destroyed the compact structure,and these astrocytes oriented randomly and aligned in disorder.In the PLX3397 treatment group,mice were fed PLX3397 chow for 21 consecutive days prior to experimental ICH induction and then maintained for an additional seven days until the time of sacrifice(Fig.2B).Flow cytometry analysis and immunostaining results indicated that PLX3397 administration caused a significant reduction of microglia(approximately 65%-80%,Figs.2C and D).The GFAP+area was also obviously decreased after microglial depletion(Fig.2E).To further investigate whether microglia modulate the proliferation of reactive astrocytes after ICH,the micewere intraperitoneally injected with EdU. As shown in Figs. 2F and G, the number of EdU+GFAP+astrocytes around the lesion was significantly decreased in the ICH 7 dpi+PLX3397 group when compared with the ICH 7 dpi+control diet group(mean±SEM:215.5±26.72/mm2vs.508±31.75/mm2,P<0.01).These findings suggestedthat microglia played avital role in astrocytic proliferation and the formation of typical astrocytic scar.
3.5. Increased leukocyte infiltration and impaired tissue repair after glial scar disruption
Although ICH caused obvious astrocytic proliferation at 3 dpi,many peripheral neutrophils infiltrated into the lesion border brain parenchyma across the yet-to-be-formed astrocytic scar(Fig.S1).In contrast, the dense astrocytic scar formed a physical barrier segregating neutrophils from the surrounding brain parenchyma at 7 dpi(Fig.3A).Immunofluorescence analysis showed no significant difference of infiltrated neutrophils in both groups at 3 dpi(Fig.3B,ICH + control diet: 24.88 ± 2.96/mm2vs. ICH + PLX3397:24.42 ± 2.52/mm2, P > 0.05). The disorganized astrocytic scar was accompanied by an increased infiltration of neutrophils after microglial ablation at 7 dpi (Figs. 3A and C, ICH + control diet:8.76±1.82/mm2vs.ICH+PLX3397:14.29±1.525/mm2,P<0.05).
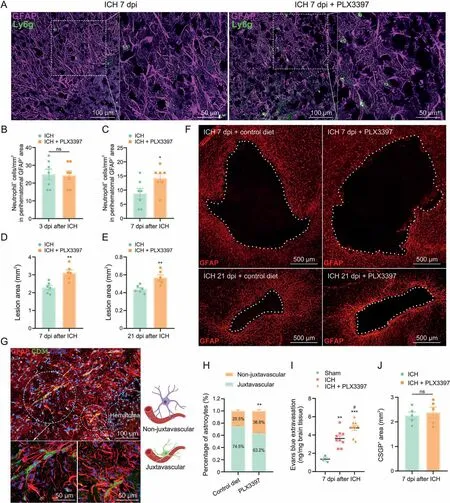
Fig.3. Increased leukocyte infiltration and impaired tissue repair after glial scar disruption.(A)Representative fluorescent images of reactive astrocytes(glial fibrillary acidic protein(GFAP)) and infiltrated neutrophils (lymphocyte antigen 6 complex, locus g (Ly6g)) around the lesion at 7 days post-injury (dpi). (B) Quantification of infiltrated neutrophils into lesion border brain parenchyma at 3 dpi (n = 7/group). (C) Quantification of neutrophils that infiltrated into lesion border brain parenchyma at 7 dpi. *P < 0.05 vs. intracerebral hemorrhage (ICH) + control diet group (n = 7/group). (D) Quantification of lesion area surrounded by reactive astrocytes at 7 dpi. **P < 0.01 vs. ICH + control diet group(n = 6/group). (E) Quantification of lesion area surrounded by reactive astrocytes at 21 dpi. **P < 0.01 vs. ICH + control diet group (n = 6/group). (F) Representative fluorescent images of lesion area surrounded by reactive astrocytes (GFAP) at 7 and 21 dpi. (G) Representative fluorescent images of vessel (CD31) and astrocytes (GFAP, at juxtavascular and non-juxtavascular positions) around the lesion. (H) The proportion of juxtavascular and non-juxtavascular astrocytes. **P < 0.01 vs. juxtavascular group (n = 6/group). (I) Quantification of Evans blue extravasation at 7 dpi. **P<0.01 vs.sham group, ***P<0.001 vs.sham group,and #P<0.05 vs.ICH+control diet group(n=3-9/group).(J)Quantification of chondroitin sulfate proteoglycan (CSPG)+ area at 7 dpi. ns: no significance (n = 5/group). DAPI: 4′,6-diamidino-2-phenylindole.
In addition, the astrocytic scar could confine the lesion size to some extent.As shown in Figs.3D and F,the disorganized astrocytic scar formation in PLX3397-treated mice was associated with an increase of lesion core area compared to control diet-treated mice at 7 dpi(ICH+ control diet:2.285±0.13 mm2vs. ICH + PLX3397:3.11±1.17 mm2,P<0.01).At 21 dpi,the quantification results also showed increased lesion size during sustained microglial depletion(Figs. 3E and F, ICH + control diet: 0.44 ± 0.02 mm2vs.ICH + PLX3397: 0.57 ± 0.03 mm2, P < 0.01).
Previous studies have demonstrated that astrocytes play a crucial role in BBB maintenance [31], especially juxtavascular astrocytes where soma are directly adjacent to blood vessels and could affect the BBB closure after cerebral injury[32].As shown in Figs.3G and H,the proportion of juxtavascular astrocytes decreased significantly in PLX3397-treated mice at 7 dpi(ICH + control diet:74.5% ± 1.7 vs. ICH + PLX3397: 63.2% ± 2.3%, P < 0.05). The mice were injected with Evans blue dye to further evaluate BBB leakage.As expected, ICH induced significant BBB disruption. Moreover,PLX3397-treated mice showed delayed BBB repair compared to control diet-treated mice (Fig. 3I, P < 0.05).
The pioneering studies showed that astrocyte-derived CSPGs could hinder axon growth [30]. It led to the widespread view that astrocytic scar hinders axon regeneration [33]. Intriguingly, we found that the CSPGs+area was not significantly decreased in the lesion core area after astrocytic scar disruption compared to the control diet-treated mice at 7 dpi (Fig. 3J). These findings mentioned above revealed that astrocytic scar played a vital role in enclosing the inflammatory damage and supporting tissue repair after ICH.
3.6. Microglia-derived IGF1 induced astrocytic scar formation via mechanistic target of rapamycin (mTOR) signaling activation
The present study emphasized the interaction of microglia and astrocytes in the lesion core area. Therefore, spatial transcriptome sequencing was performed to explore the potential mechanism by which microglia modulate astrocytic scar formation. ST libraries were generated from three mouse brain sections(sham,ICH 7 dpi,and ICH 21 dpi). Since ICH induced significant changes in morphology,proliferation,and the transcriptome of astrocytes and microglia at 7 dpi,ST analysis mainly focused on the brain section in the ICH 7 dpi group.A total of 1571 spots were under the tissue with an average of 184148.49 reads per spot. Then, the expression clusters were annotated using SpaceRanger (v1.2.0) and seurat(v3.1.0). The clustering analysis (Graph-based) of the ICH 7 dpi dataset resulted in nine well-defined clusters that mapped the different areas of the hemisphere(Figs.4A and B).As shown in Figs.4C and D, microglia (Aif1) and astrocyte (Gfap) markers’ spatial distribution was consistent with the immunofluorescence images mentioned above. Notably, the location of cluster 1 followed the lesion core area,and displayed the highest expression level of Aif1 and Gfap compared with the other clusters (Figs. 4E and F).Therefore, we could determine the transcriptomic changes of microglia and astrocytes in the lesion core area.
As expected,we identified 911 upregulated DEGs,FDR<0.05)in cluster 1.The top 30 upregulated DEGs are shown in Fig.4G.Gene Ontology(GO)enrichment analysis was used to further investigate the functional implication. A total of 1518 GO terms (biological process)were significantly overrepresented(P<0.01)by these 911 upregulated DEGs. The top 10 enriched GO terms are shown in Fig. 4H. These GO terms accurately reflect the biological processes after ICH,including the inflammatory response,positive regulation of cell migration,and cell activation.We used a circos plot to reveal the relationship between upregulated DEGs and the biological processes mentioned above. The results indicated that 19 genes(Spp1,Gpnmb,Adam8,Cd36,Lgals3,Igf1,Pf4,Lilr4b,Hmox1,Mmp12,Col1a1,Cd5l,C3ar1,Cd84,Cd68,Stab1,Arg1,C5ar1,and Col1a2)were involved in at least one of the top 10 GO terms(Fig. 4H).
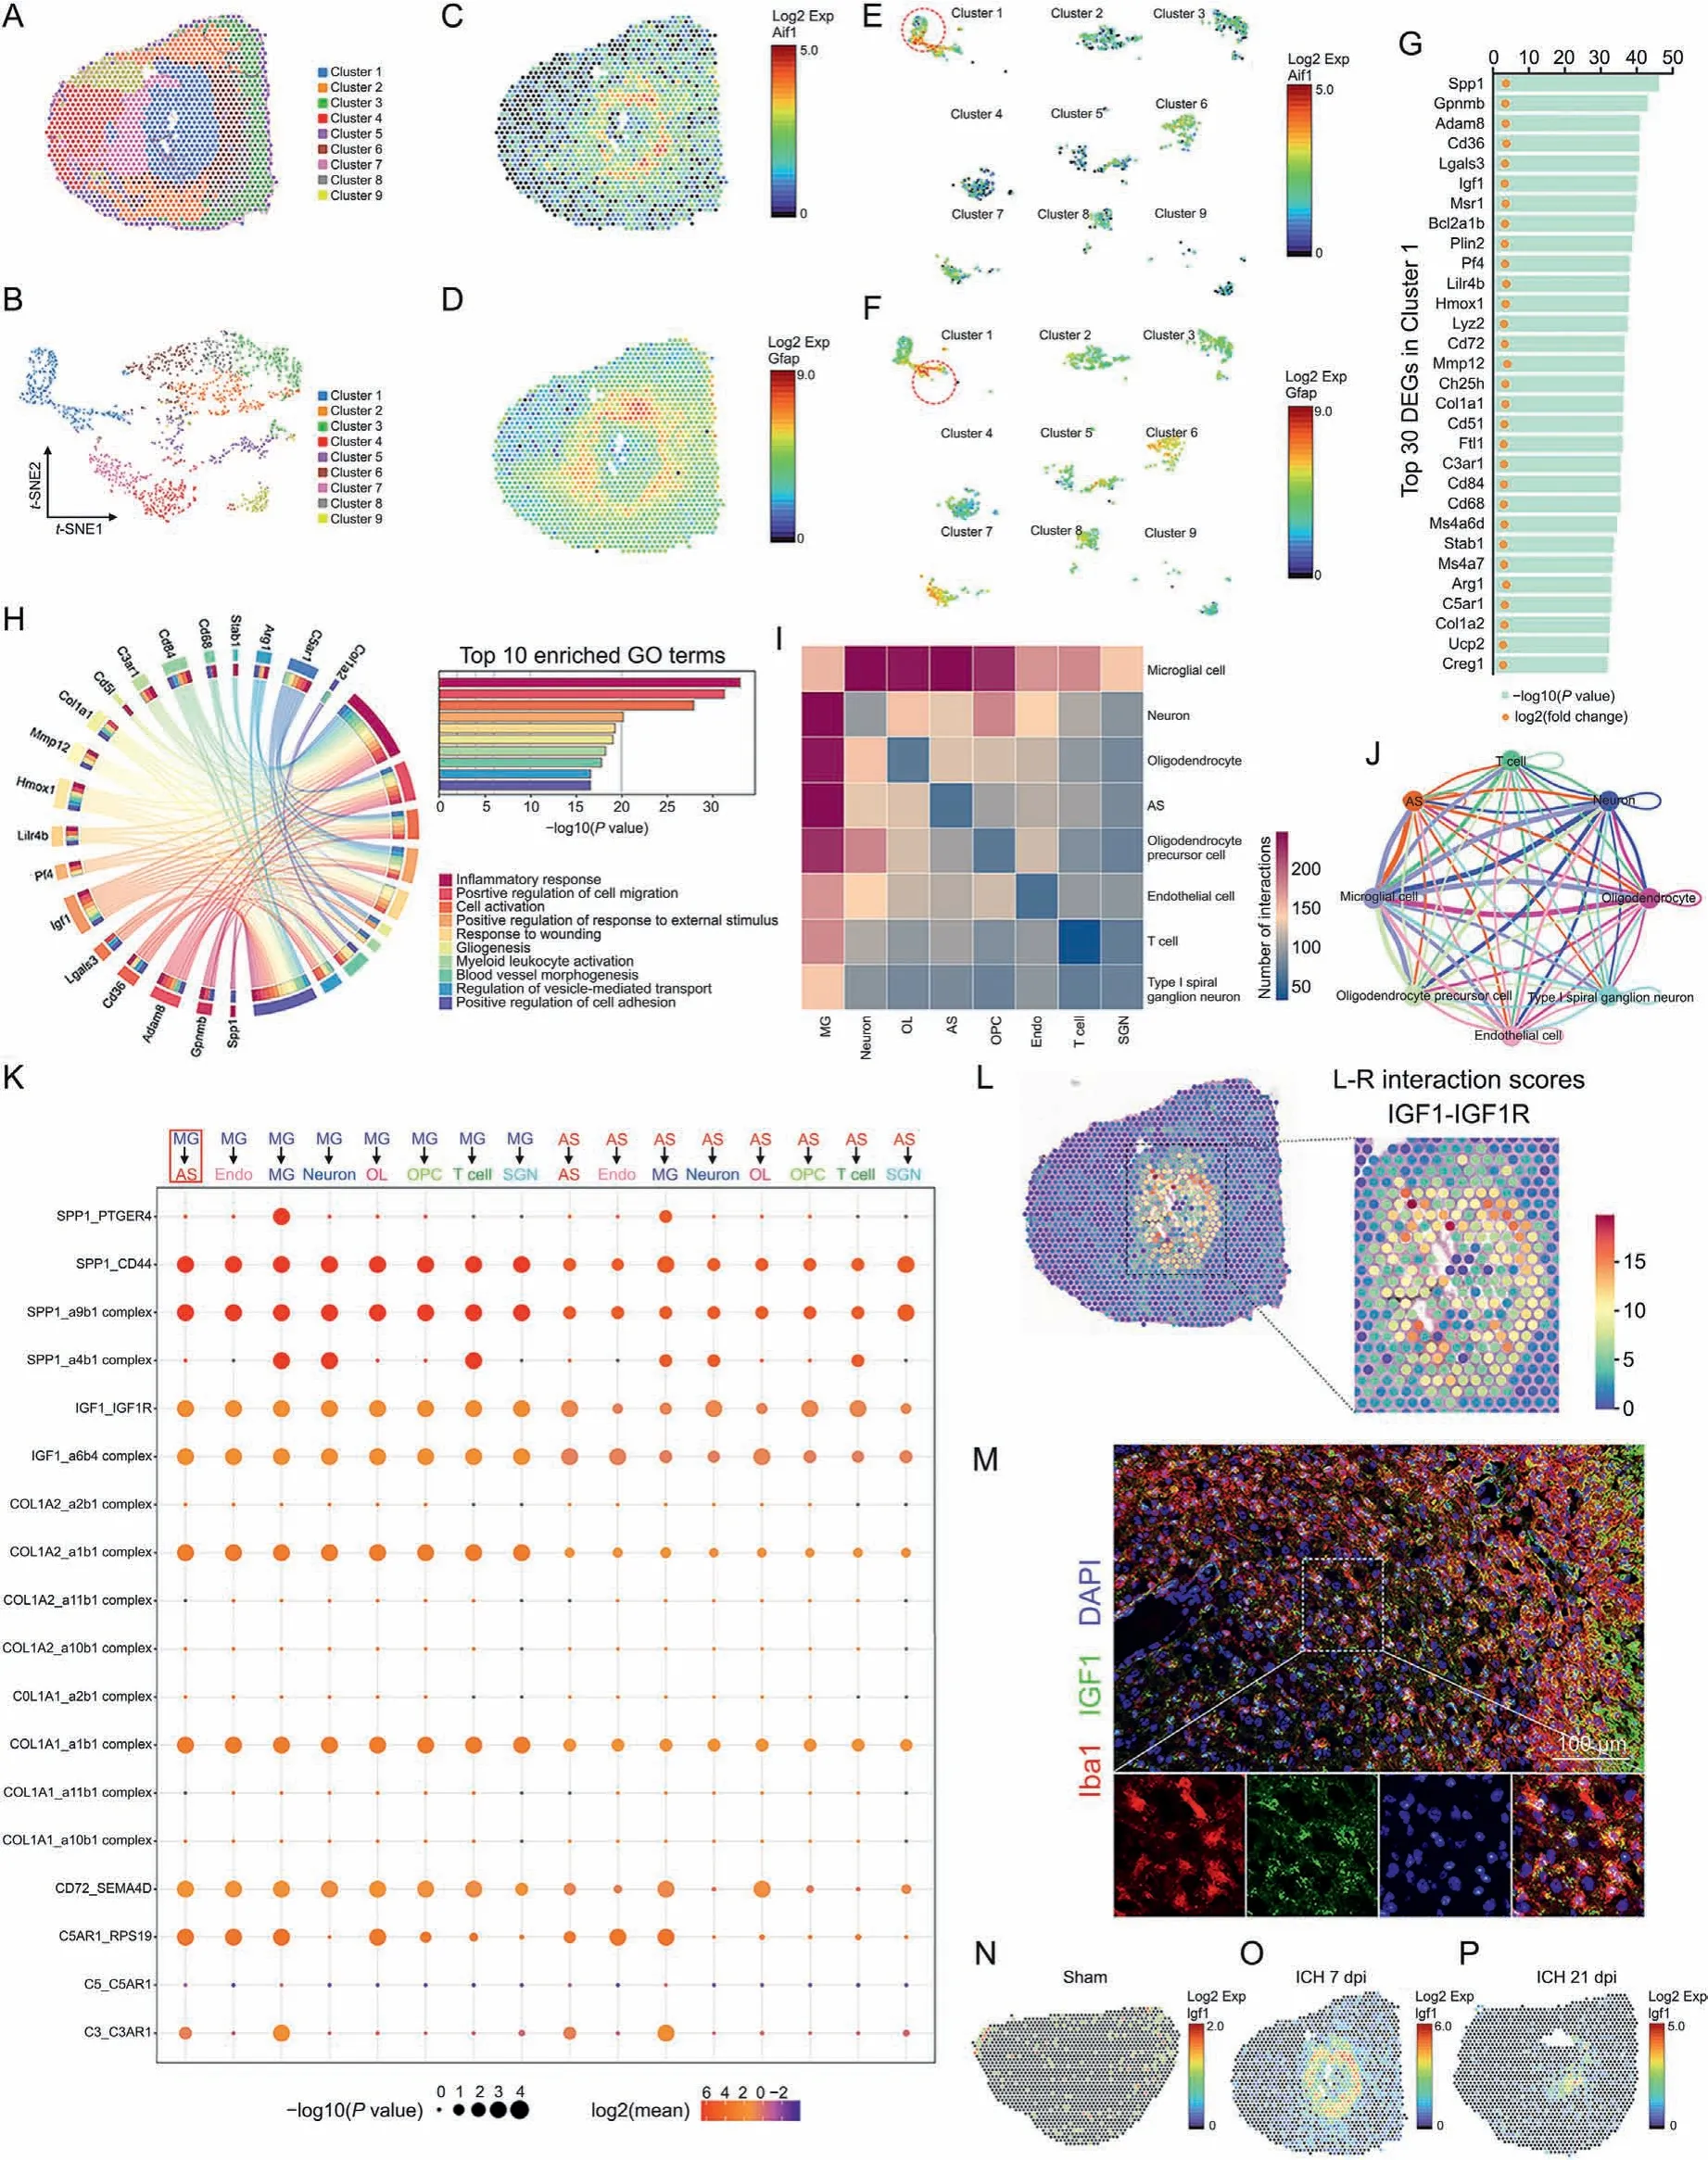
Fig. 4. Insulin like growth factor 1(IGF1)-IGF1 receptor (IGF1R) ligand-receptor modulated microglia-astrocyte interaction. (A) Unbiased clustering of spatial transcriptomics (ST)spots.(B)t-distributed stochastic neighbor embedding(t-SNE)plot of nine clusters.(C,D)Spatial messenger RNA(mRNA)expression of Aif1 and glial fibrillary acidic protein(Gfap)in brain sections at 7 days post-injury(dpi).(E,F)Spatial mRNA expression of allograft inflammatory factor 1(Aif1)and Gfap in different clusters at 7 dpi.(G)Top 30 differentially expressed genes (DEGs) in cluster 1. (H) Circos plot shows the genes which were related to at least one of the top 10 enriched functional clusters. (I) Heatmap shows the total number of interactions between cell types in the intracerebral hemorrhage (ICH) 7 dpi dataset obtained with CellPhoneDB. (J) Network diagram displays the intercellular communication between cell types in brain section at at 7 dpi. Each line represented the ligands expressed by the cell population, then the line connected to the cell types that expressed the cognate receptors.The loops indicated autocrine circuits.The line thickness represented the number of ligand-receptor pairs.(K)Dot plot showed the ligand-receptor pairs for each intercellular link. (L) Hotspots marked the locations where the IGF1-IGF1R ligand-receptor pair was more likely to occur in brain sections at 7 dpi, quantified by ligand-receptor interaction score.(M)Representative images of IGF1 and Iba1 double immunostaining show the reactive astrocytes and activated microglia around the lesion at 7 dpi. (N-P) Spatial mRNA expression of Igf1 in brain sections at 0, 7, and 21 dpi. Exp: expression; GO: Gene Ontology; MG: microglia; AS: astrocyte; Endo: endothelial cell; OL:oligodendrocyte; OPC: oligodendrocyte precursor cell; SGN: spiral ganglion neuron.
Subsequently,cell-cell interaction analysis was performed with the ST data using the CellPhoneDB software.As shown in Fig.4I and J, the heatmap and network diagram quantified interactions between cell types.The results indicated a strong interaction between microglia and astrocytes at 7 dpi.Here,we focused on the potential cell-cell interaction mechanism between microglia and astrocytes.The dot plot displayed the ligand-receptor pairs in which the ligands or the receptors were from the above-mentioned top 30 DEGs in cluster 1 (Fig. 4K). Then, eight potential ligand-receptor pairs, namely, SPP1/CD44, SPP1/integrin-a9b1 complex, IGF1/IGF1 receptor (IGF1R), IGF1/integrin-a6b4 complex, COL1A2/integrina1b1 complex, COL1A1/integrin-a1b1 complex, CD72/SEMA4D,and C5AR1/RPS19,were predicted to be strongly activated(Fig.4K,P <0.01, fold change >2).
Among these ligands and receptors, CD72 was not involved in one of the top 10 GO terms (Fig. 4H). C5AR1 did not meet our requirements (it was a receptor in microglia). COL1A2 was not involved in any biological processes associated with astrocytic scar formation (Fig. 4H). However, a previous study demonstrated that COL1A1 (collagen type I) was associated with astrocytic scar formation after spinal cord injury [34]. Collagen type I is an essential component of the extracellular matrix and is mainly secreted by fibroblasts. Therefore, COL1A1/integrin receptor pairs were not likely to be associated with microglia-astrocyte interaction. Here,all the above-mentioned ligand-receptor pairs were excluded.
Previous studies have demonstrated that OPN (encoded by Spp1) is highly expressed in microglia after injury [35]. It plays a vital role in mediating intercellular communication via its flexible structure and engagement with integrins or CD44-variant receptors [36]. Previous studies also indicated that OPN and its integrin receptor are upregulated during glial scar formation after focal stroke [37]. The dot plot also revealed that SPP1/CD44 and SPP1/integrin-a9b1 complex ligand-receptor pairs were strongly activated (Fig. 4K). Hence, SPP1 may be a potential regulator of astrocytic scar formation.
Notably,Igf1 was involved in eight GO terms(Fig.4H).Thereinto,biological processes such as positive regulation of cell migration,cell activation,gliogenesis,and positive regulation of cell adhesion might be involved in the pathogenesis of astrocytic scar formation(Fig.4H).In the CNS,microglia were the major source of IGF1 which participated in the modulation of neurogenesis, angiogenesis,tumorigenesis, and oligodendrocyte precursor proliferation and maturation [38-40]. The above-mentioned network diagram and dot plot quantified the communication between cell types, but failed to display the anatomical locations of these ligand-receptor pairs. Here, stLearn analysis was performed to identify the tissue locations that were marked as hotspots where cell-cell interactions are more likely to occur. At 7 dpi, these hotspots with high IGF1-IGF1R ligand-receptor pair interaction activity were mainly congregated in the lesion core area where microglia and astrocytes were concentrated (Fig. 4L). Subsequently, the interaction activity of the IGF1-IGF1R ligand-receptor pair decreased at 21 dpi(Fig. S2A). The immunostaining and ST analysis results further demonstrated that IGF1 was highly expressed in microglia in the lesion core area at 7 dpi (Figs. 4M-P). To sum up, IGF1 was most likely to be the key regulator of astrocytic scar formation.
To further identify the potential pathway involved in mediating astrocytic scar formation, RNA-seq analysis was performed on astrocytes that were MACS purified from perihematomal tissues at 0,7,or 21 dpi.First,differential expression analysis was used on these RNA-seq data. We identified 5790 DEGs (3049 upregulated and 2741 downregulated) in astrocytes from ICH 7 dpi mice compared to sham mice (Fig.5A).Moreover,astrocytes from ICH 21 dpi mice showed 104 upregulated DEGs and 32 downregulated DEGs compared to sham mice (Fig. 5B). Subsequently, we studied how the genes behave over time in activated astrocytes. STEM analysis was performed to determine the gene expression pattern at each time point(0,7,and 21 dpi)via STEM clustering algorithm,and the clusters were ordered based on the P-value (Fig. 5C). Finally, the two most significant clusters were determined (Fig. 5C, profile 5 and profile 10). The expression level of genes in profile 5 significantly decreased at 7 dpi and subsequently increased to a normal level at 21 dpi.Conversely,in profile 10,the gene expression peaked at 7 dpi and tended to return to a normal level at 21 dpi.The abovementioned immunostaining results indicated that the area of GFAP+astrocytic scar peaked at 7 dpi and decreased rapidly at 21 dpi.This gene expression trend was in accordance with the process of astrocytic scar formation that made it a cluster of interest.Thus,the potential regulators participating in modulating astrocytic scar formation may have been present in profile 10.
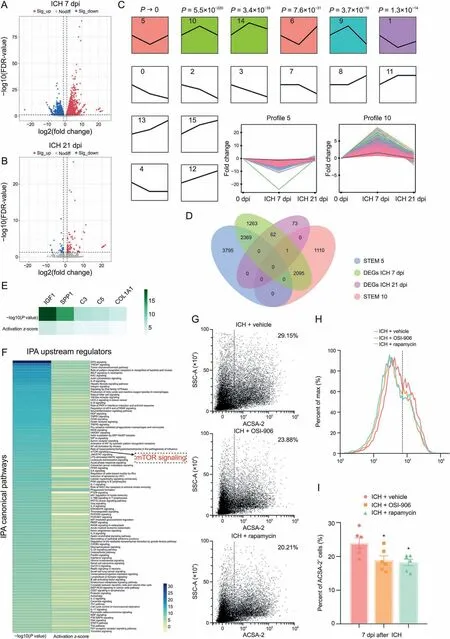
Fig.5. Microglia-derived insulin like growth factor 1(IGF1)induced astrocyte mechanistic target of rapamycin(mTOR)signaling activation.(A)Volcano plot shows the differentially expressed genes(DEGs)(fold change>2 or<-2,false discovery rate(FDR)<0.05)in astrocytes of intracerebral hemorrhage(ICH)7 days post-injury(dpi)group compared to sham group. (B) Volcano plot shows the DEGs (fold change > 2 or < -2, FDR < 0.05) in astrocytes of ICH 21 dpi group compared to sham group. (C) Short time-series expression miner (STEM)analysis showed the clusters of the gene expression pattern at each time point.(D)Venn plot shows the overlap between four gene lists.(E)Ingenuity pathway analysis(IPA)for upstream regulators. (F)Ingenuity pathway analysis (IPA)for canonical pathways. (G, H)Flow cytometric dot plot and histogram plot of astrocytes isolated from the ipsilateral hemisphere at 7 dpi.(I)Quantification of astrocyte cell surface antigen-2(ACSA-2)+cells. *P<0.05 vs.ICH+vehicle group(n=6/group).Sig:significant;EIF2:eukaryotic initiation factor 2B; TREM1: triggering receptor expressed on myeloid cells 1; fMLP: formyl peptide receptor 1; RAC: Rac family small guanosine triphosphate hydrolases (GTPase); IL:interleukin; HER-2: erb-b2 receptor tyrosine kinase 2; PKR: eukaryotic translation initiation factor 2 alpha kinase 2; eIF4: eukaryotic translation initiation factor 4E; HGF: hepatocyte growth factor;TNFR1:tumor necrosis factor(TNF)receptor superfamily member 1A;iNOS:nitric oxide synthase 2;HMGB1:high mobility group box 1;ARP-WASP:activator protein-Wiskott-Aldrich syndrome protein;HIF1α:hypoxia inducible factor 1 subunit alpha;NF-κB:nuclear factor kappa B;JAK/STAT:Janus kinase/signal transducer and activator of transcription; LPS: lipopolysaccharide; MAPK: mitogen-activated protein kinase; ILK: integrin linked kinase; HIV1: human immunodeficiency virus type 1; PI3K: phosphatidylinositol-4,5-bisphosphate 3-kinase; RIG1: antiviral innate immune response receptor; PTEN: phosphatase and tensin homolog; MIF: macrophage migration inhibitory factor;ERK: extracellular regulated protein kinases; AKT: protein kinase B; PEDF: serpin family F member 1; RANK: TNF receptor superfamily member 11a; CXCR4: C-X-C motif chemokine receptor 4;MSP:macrophage stimulating 1;RON:macrophage stimulating 1 receptor;NGF:nerve growth factor;PAK:P21(RAC1)activated kinase;SSC-A:side scatter-area.
The Venn diagram displays the overlap of gene lists in profile 5,profile 10,DEGs ICH 7 dpi,and DEGs ICH 21 dpi(Fig.5D).Then 2096 intersecting genes between profile 10 and DEGs ICH 7 dpi were subject to pathway analysis using IPA software.IPA showed that the upstream regulators such as IGF1 and SPP1 were predicted to be activated (Fig. 5E). This result was consistent with the findings of cell-cell interaction analysis mentioned above.Notably,the top 100 canonical pathways identified are shown in Fig. 5F. Among these canonical pathways, mTOR signaling which is one of the downstream targets of IGF1-mediated signaling pathways caught our attention. The mTOR signaling pathway is a crucial signaling hub that integrates several cues and exerts plenty of biological functions including cell proliferation and survival, cytoskeleton dynamics,protein synthesis,and metabolic balance[41].Moreover,mTOR has been repeatedly shown to be associated with neuronal development and CNS disorders[42].The results of flow cytometry analysis also indicated that IGF1R antagonist(OSI-906)and mTOR inhibitor(rapamycin) administration caused a significant decrease in the number of astrocytes in ICH mice(approximately 20%,Figs.5G-I).Thus, microglia-derived IGF1 could promote astrocytic proliferation and induce astrocytic scar formation via mTOR signaling activation after ICH.
3.7. Repopulating microglia promoted tissue repair and improved long-term neurological function recovery
Previous studies have demonstrated that repopulating microglia(RM) positively modulates the injured brain's microenvironment[16]. The above-mentioned findings indicated that microgliaderived IGF1 promoted astrocytic scar formation via mTOR signaling. This played a vital role in limiting lesion size and neutrophil infiltration. As such, this aroused our interests as to whether RM modulates the microenvironment via astrocyte interaction after ICH.
Here, mice were fed PLX3397 chow for 21 consecutive days prior to ICH induction. Subsequently, the CSF1R inhibition was removed by feeding mice with a control diet (Fig. 6A). Then RM rapidly replenished the whole brain after withdrawal of CSF1R inhibition. BBB permeability was assessed using IgG immunostaining; RM significantly attenuated BBB disruption after ICH(Figs. 6B and C, P < 0.05). The result of EdU/cc1 immunostaining indicated that microglia repopulation increased the number of newly differentiated mature oligodendrocytes (Figs. 6D and E,ICH+control diet:41.95±3.57/mm2vs.ICH+RM:56.61±6.07/mm2, P < 0.05). In addition, the results of MBP immunostaining and G-ratio showed white matter injury at 21 dpi(Figs.6F and G).Quantification indicated that the MBP+lesion size was decreased by microglia repopulation (Fig. 6H, ICH + control diet:0.48 ± 0.04 mm2vs. ICH + RM: 0.32 ± 0.03 mm2, P < 0.01).Similarly, microglia repopulation was associated with a decrease of GFAP+glial scar lesion core area at 21 dpi(Fig.6I,P<0.05).It is worth noting that the area of GFAP+lesion core and MBP+lesion size showed a significant positive correlation in both groups(Fig. 6J, ICH group: R2= 0.9958, P < 0.0001; ICH + RM group:R2=0.9863,P<0.0001).TEM analysis was performed to measure the thickness of the myelin sheaths around the lesion core at 21 dpi (Fig. 6G). Quantification revealed that the myelin sheaths in ICH+RM mice showed a lower G-ratio than those in ICH+control diet group (Figs. 6K and L, ICH + control diet: 0.81 ± 0.005 vs.ICH + RM: 0.78 ± 0.004, P < 0.001). Hence, RM could promote remyelination and improve the anatomical integrity of the myelinated fibers. In behavioral tests, ICH caused significant sensorimotor deficit(adhesive removal test,Figs.6M and N)and a decrease in long-term motor coordination and limb strength(accelerated rotarod test,Fig.6O)in mice.Microglial repopulation significantly improved such neurological deficits (Figs. 6M-O).
These above-mentioned findings indicated that microglial repopulation could accelerate the pace of GFAP+scar formation.Such a neuroprotective astrocytic scar could enclose the inflammatory damage in the lesion core area, establishing a suitable microenvironment for oligodendrocyte progenitor cell differentiation, remyelination, and BBB repair.
3.8. IGF1 was necessary but insufficient for the function of RM
To further explore the potential mechanism of RM in mediating neuroprotective astrocytic scar formation, first, we examined whether RM could change the cellular composition of astrocytic scars after ICH. Astrocytes were separated from mice brain tissues and followed by quantitative RT-PCR analysis.As shown in Fig.7A,microglial repopulation significantly reduced the proportion of A1 astrocytes(marker C3 mRNA expression)in the glial scar compared to ICH + control diet group (P < 0.05). Microglia were separated from mice brain tissues and followed by quantitative RT-PCR analysis (Figs. 7B-F). Unexpectedly, the mRNA expression levels of TNF-α, IL-1α, and C1q showed no statistical difference between endogenous microglia and RM (Figs. 7B-D).
However, the mRNA expression of IGF1 was significantly more elevated in RM than in the endogenous microglia(Fig.7E,P<0.05).Therefore, RM might promote neuroprotective astrocytic scar formation in an IGF1 dependent way. Therefore, we injected the striatum with AAV vectors containing the astrocyte-specific promoter gfaABC1D to promote the expression of IGF1 in reactive astrocytes(AAV-gfaABC1D-IGF1,Fig.S2B).Unexpectedly,immunofluorescence analysis showed no significant difference in the lesion size between the AAV-GfaABC1D-EGFP group (control)and the AAV-GfaABC1D-IGF1 group at 7 dpi (Figs. 7G and H).
We then considered another potential key regulator, i.e., OPN(SPP1).The RT-PCR result indicated that the mRNA level of OPN was also elevated in RM than in endogenous microglia(Fig.7F,P<0.05).The dot plot also demonstrated that the SPP1/CD44 and SPP1/integrin-a9b1 ligand-receptor pairs were predicted to be strongly activated(Fig.4K).Furthermore,ST analysis showed that SPP1 mRNA expression peaked at 7 dpi in the lesion core area (Figs. S2C-E).stLearn analysis also indicated that SPP1-CD44 and SPP1-integrin a9b1 complex ligand-receptor pairs showed high interaction activity in the lesion core area at 7 dpi(Figs.S2F and G).Subsequently,such interaction activity of SPP1-CD44 and SPP1-integrin a9b1 complex ligand-receptor pairs decreased at 21 dpi(Figs.S2H and I).However,AAV-GfaABC1D-OPN treatment alone also failed in decreasing lesion size at 7 dpi (Fig. S2J). Both treatments with AAV-IGF1 or AAV-OPN alone showed limited effects on tissue repair after ICH.
Noticeably, the lesion area significantly decreased in AAV-OPN/IGF1 treated mice than that in the AAV-Control treated mice(Fig. 7G and H, P < 0.05). As a recognized marker of mTOR activation, the pS6 protein expression level was obviously increased in AAV-OPN/IGF1-treated mice(Figs.7I and J,P<0.05 vs.AAV-Control group).Whereas AAV-IGF1 or AAV-OPN alone failed to increase pS6 significantly (Figs. 7I, 7J, S2K, and S2L). Likewise, immunostaining analysis also showed that pS6 largely increased and colocalized with GFAP in the AAV-OPN/IGF1-treated mice at 7 dpi (Fig. 7K).
In vitro, the C3 protein and mRNA expressions strongly increased in activated microglia conditional medium (MCM)-treated astrocytes(Figs.7L and M,P<0.001 vs.control),and IGF1/OPN treatment reversed this change (Fig. 7M, P < 0.05 vs. MCM group). Although we did not find the obvious morphological changes(palisading)in astrocytes treated with IGF1/OPN(Figs.7N and O), it significantly promoted astrocyte proliferation during short-term ex vivo culture(Fig. 7P, P < 0.01).
A plausible hypothesis was that OPN can sensitize astrocytes’responses to IGF1, thereby strongly promoting mTOR signaling activation. Therefore, it was likely that RM could promote neuroprotective astrocytic scar formation via the combined effect of OPN and IGF1, which further established a suitable microenvironment for tissue repair.
3.9. Delayed microglial depletion partly reversed the functional changes of astrocytic scar at the chronic stage of ICH
We had proven the neuroprotective effects of astrocytic scar at an early stage of ICH. To further explore whether the overall net effects of astrocytic scar changed at a different stage,we utilized the K-means method for second clustering analysis. Ten well-defined clusters mapped the regions of the hemispheres in both ICH 7 dpi and ICH 21 dpi brain sections (Figs. 8A and B). Based on the prior knowledge of locations and specific cell markers,we identified the representative cluster of astrocytic scars in the ICH 7 dpi group and the ICH 21 dpi group(cluster 7 in the ICH 7 dpi group and cluster 6 in the ICH 21 dpi group) (Figs. 8A, 8B, and S3). Subsequently, the results of GO enrichment analysis showed the overall net effect of astrocytic scar transformed from protection into destruction at the chronic stage of ICH (Figs. 8C and D). Moreover, we noted that the C3 (A1 neurotoxic astrocytes marker) expression level was highly increased in the astrocytic scar at 21 dpi(Fig.8E).This showed that both A1 and A2 astrocytes participated in the astrocytic scar formation at 7 dpi.However,neurotoxic A1 astrocytes occupied most of the cellular components of the astrocytic scar at 21 dpi. Hence,the functional changes were likely associated with the increased proportion of A1 astrocytes in a glial scar.This result was contrary to the astrocyte-specific RNA-seq result (Fig. 8F), with spatial transcriptome sequencing more accurately reflecting the transcriptomic and functional changes in an astrocytic scar.
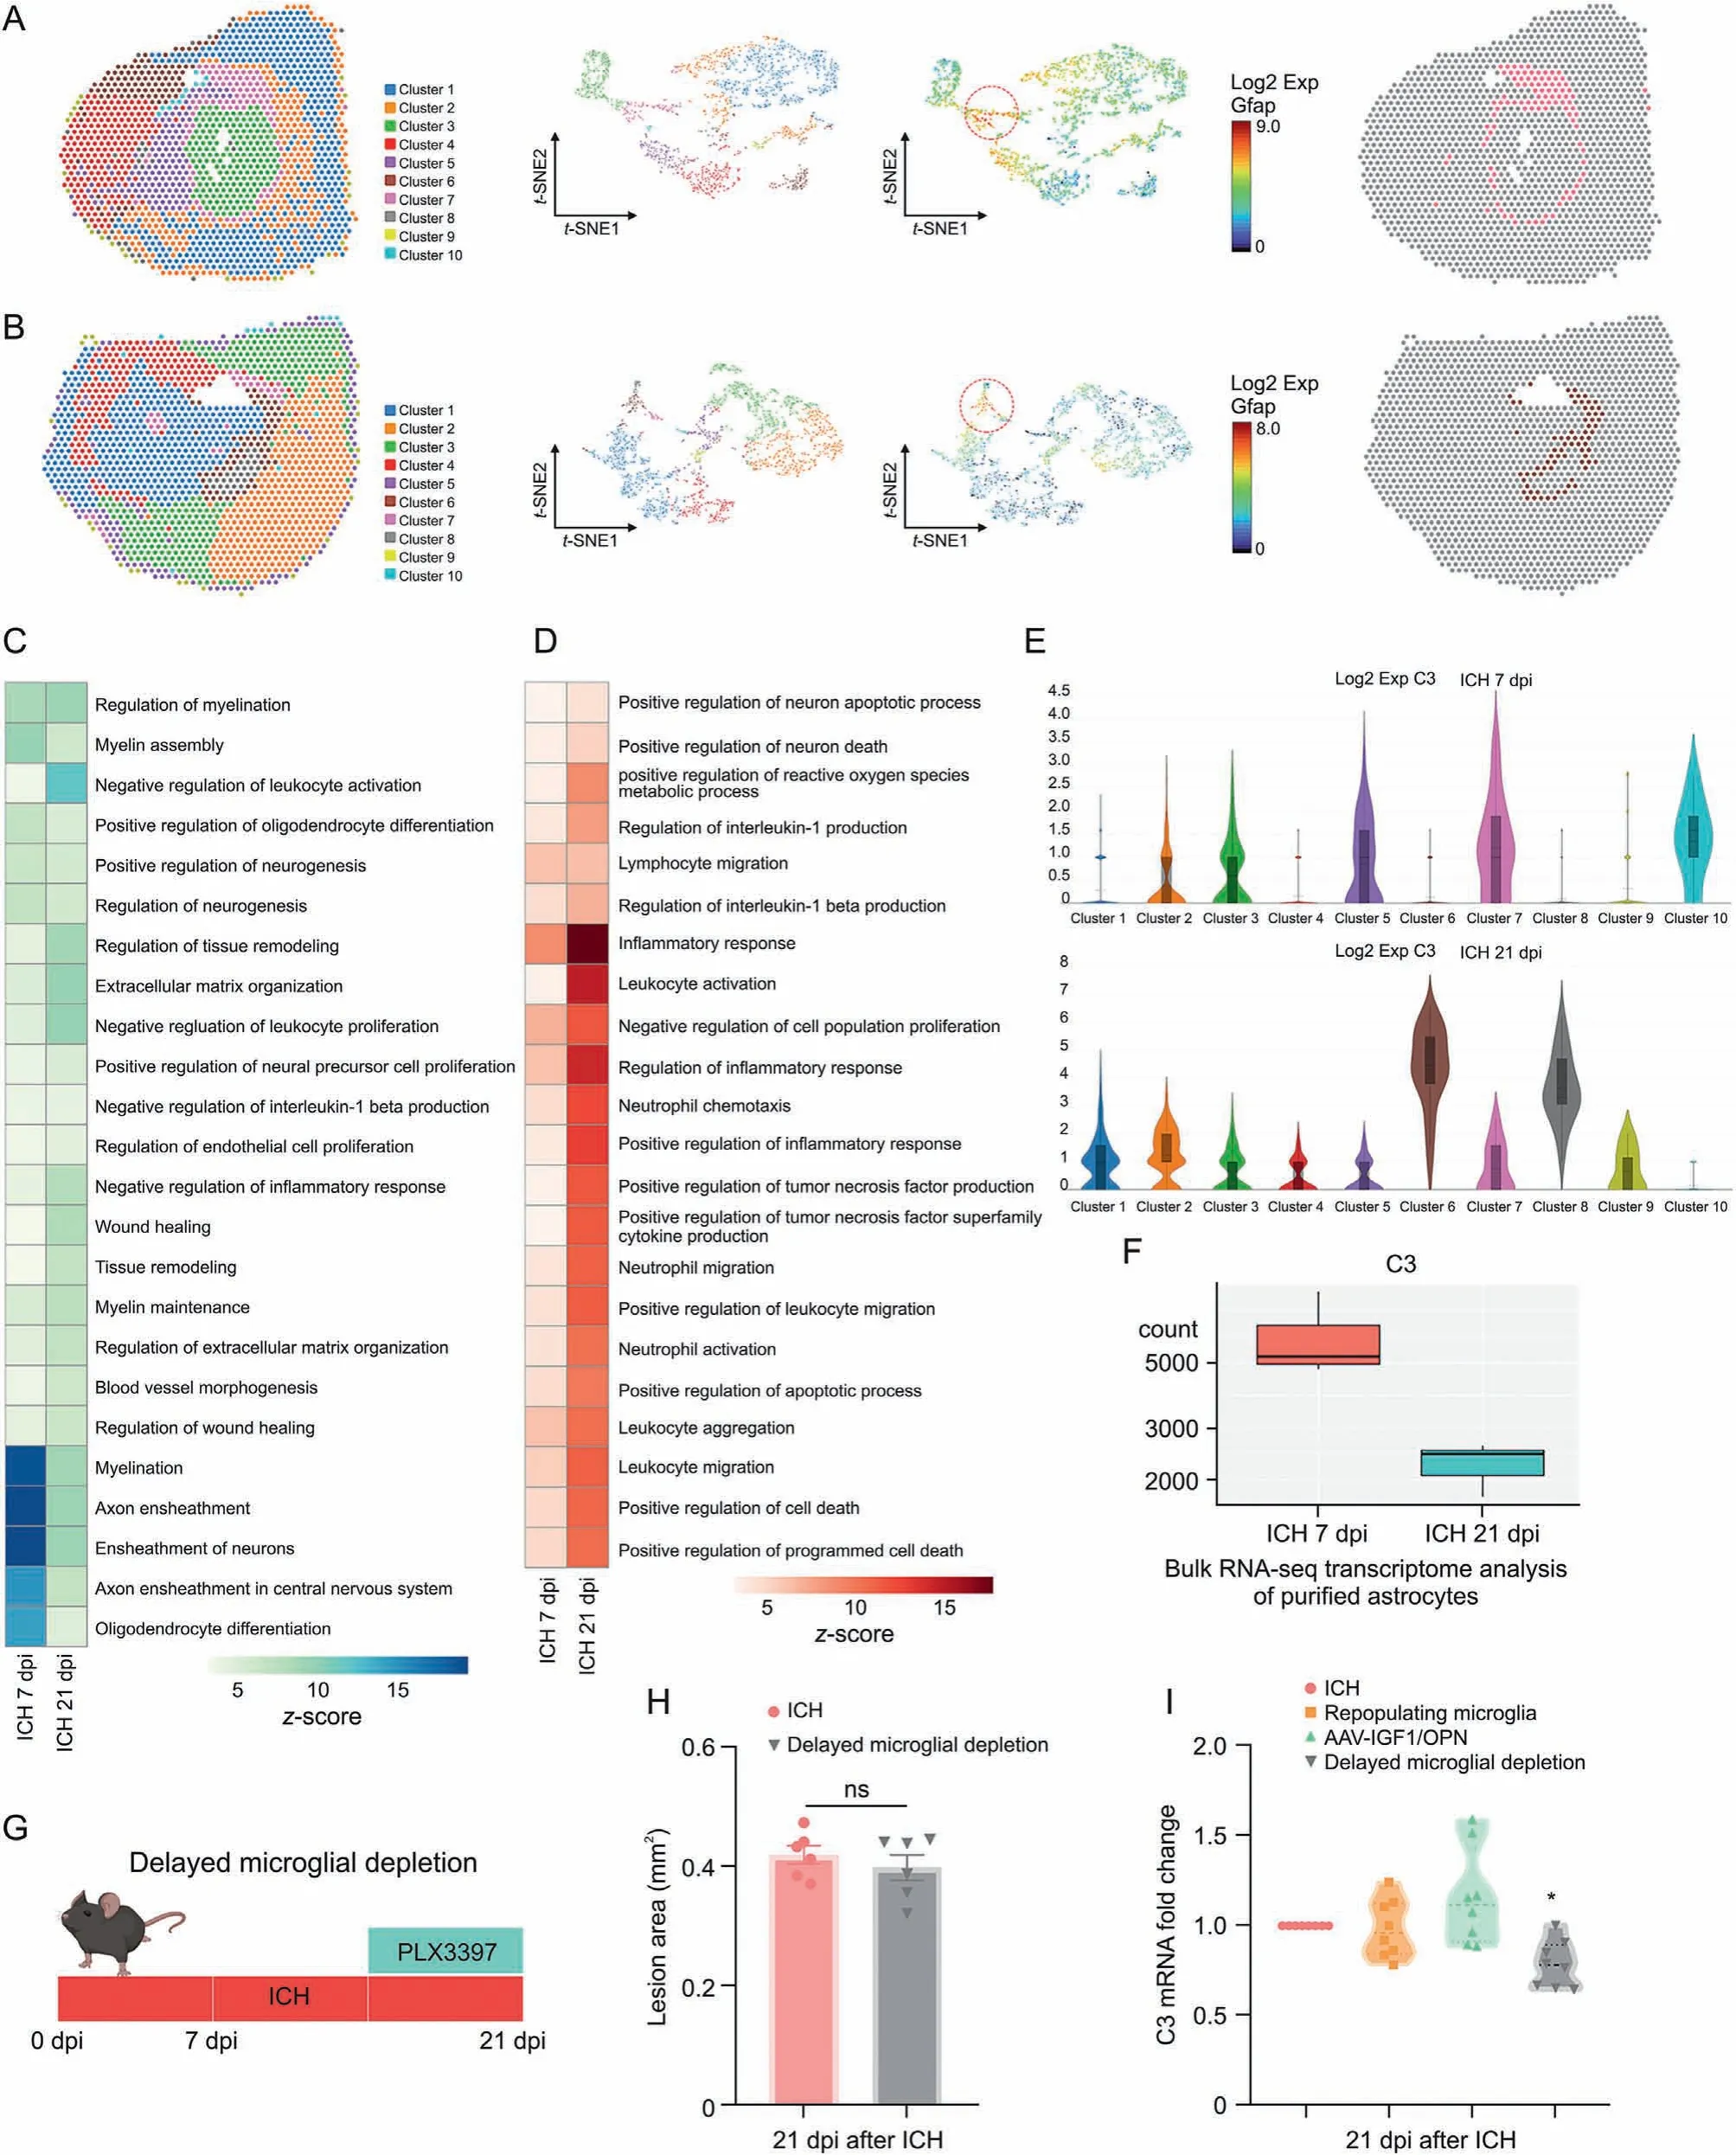
Fig.8. Delayed microglial depletion partly reversed the functional changes of astrocytic scar.(A)Clustering analysis identified representative cluster of astrocytic scar at 7 days postinjury(dpi).(B)Clustering analysis identified representative cluster of astrocytic scar at 21 dpi.Heatmap of enriched Gene Ontology(GO)terms(biological process)in astrocytic scar at 7 and 21 dpi: (C) GO terms associated tissue damage and (D) GO terms associated with tissue repair. (E) Spatial transcriptomics (ST) analysis showed complement C3 (C3)messenger RNA(mRNA)expression in different clusters at 7 and 21 dpi.(F)Astrocyte-specific RNA sequencing(RNA-seq)showed C3 mRNA expression in astrocyte at 7 and 21 dpi.(G)Scheme of delayed microglial depletion.(H)Quantification of lesion area at 21 dpi.ns:no significance.(I)Reverse transcription quantitative real-time polymerase chain reaction(RT-qPCR) analysis of C3 mRNA expression in astrocytes at 21 dpi. *P < 0.05 vs. intracerebral hemorrhage (ICH) + control diet group (n = 8/group). Exp: expression; GFAP: glial fibrillary acidic protein; t-SNE: t-distributed stochastic neighbor embedding; AAV: adeno-associated virus; IGF1: insulin like growth factor 1; OPN: osteopontin.
Since sustained microglial depletion may not be a reasonable treatment strategy for ICH at an early stage,here,this study aimed to investigate the effect of temporary microglia depletion during the chronic stage of ICH. For delayed microglial depletion, mice were fed with PLX3397 starting 14 dpi after ICH surgery until the end of the experiments (Fig. 8G). As shown in Fig. 8H, delayed microglial depletion was not associated with an increased lesion core area at 21 dpi. In contrast, unlike microglia repopulation or AAV-IGF1/OPN treatment, delayed microglial depletion treatment significantly decreased C3 mRNA expression at 21 dpi compared to ICH + control dietary treatment (Fig. 8I, P <0.05).
These findings indicated that the role of astrocytic scar altered at different stages of ICH-induced injury.Delayed microglial depletion might bring benefits at the chronic stage of ICH.
4. Discussion
There has been a long-held view that activated microglia and reactive astrocytes result in severe inflammatory pathology after CNS injury.Most preclinical studies have considered the inhibition of such “reactivity” or “activation” as a therapeutic strategy. However, this ignored the crucial positive effects of astrocytes and microglia in tissue repair. Astrocytes and microglia act as cooperative functional units in the CNS. To better understand the interaction between microglia and astrocytes after ICH, we took advantage of pharmacologic depletion strategy (PLX3397) to investigate how ablating microglia affected astrocytic scar formation during different stages of ICH-induced injury.
The present study showed that ICH-induced palisading astrocytes formed long thickened processes that oriented toward the lesion and formed a compact border around the hematoma at 7 dpi.Subsequently, we found that sustained microglia depletion with consecutive PLX3397 diet destroyed the compact scar structure and induced disorganized astrocytic scar. Moreover, glial scar disruption further enhanced neutrophil infiltration, disrupted the BBB,and impaired white matter repair. Consistent with our research,recent studies demonstrated that depletion of microglia augmented infarct size, inflammatory mediator production,leukocyte infiltration, and neuronal death during brain ischemia[43,44].Similarly,research on spinal cord injury also indicated that astrocyte scar formation aided rather than prevented central nervous system axon regeneration,depletion of microglia exacerbated injury, and impaired neurofunction recovery [33,45]. However,Gerber et al. [46] demonstrated that sustained inhibition of proliferating microglia by GW2580 (before and after injury)improved functional recovery and preserved tissue integrity after spinal cord injury. Another study also indicated that microglial ablation conferred neuroprotection by inhibiting brain inflammation after ICH [47]. Our results partially agreed with this opinion.Microglia are the major source of pro-inflammatory molecules after CNS injury[48].Undoubtedly,microglial depletion can inhibit ICHinduced inflammatory factors expression in brain tissue during the acute phase (within 3 dpi). It is worth noting that microglia have detrimental and beneficial effects on CNS injury. Microglia are critical for remyelination and angiogenesis via releasing neurotrophic factors such as IGF-1 and VEGF [15,49,50]. In contrast,microglia-derived inflammatory mediators including TNF-α and IL-6 have been recognized to promote neuronal progenitor and oligodendrocyte precursor cells proliferation [51,52]. The elimination of microglia will certainly conceal its neuroprotective function.Recent studies show that transient inhibition of microglia proliferation after spinal cord injury (SCI) in mice and nonhuman primates improves motor function tissue recovery [53]. However,long-term inhibition of microglia proliferation after SCI is detrimental [54]. Such results highlight the specific roles of microglia subpopulations and the importance of the time window of microglia modulation. This was exactly the focus of the present study.
Hence,therapy strategies targeting microglia should emphasize balancing their “protective” and “detrimental” functions rather than complete microglia elimination. The vital insight from our data is that sustained microglial depletion may not be a reasonable treatment strategy for ICH,at least in its early stage(within 7 dpi).
Next,we explored the potential mechanism by which microglia modulate neuroprotective astrocytic scar formation. Cell-cell interaction analysis and IPA canonical pathway analysis were performed based on our spatial transcriptome sequencing and astrocyte-specific RNA-seq data. The results revealed that IGF1/IGF1R ligand-receptor pair might mediate microglia-astrocytes interaction, and microglia-derived IGF1 induced astrocytic scar formation via mTOR signaling activation. The mTOR signaling pathway acts as a signaling hub that orchestrates internal and external cues and exerts numerous biological functions, including cell proliferation and survival, cytoskeleton dynamics, and metabolic balance [41]. Notably, reactive astrocyte proliferation and cytoskeleton remodeling were likely associated morphologic astrocytic changes (palisading astrocytes) and astrocytic scar formation. Our data showed that IGF1R antagonist (OSI-906) and mTOR inhibitor (rapamycin) administration led to an obvious reduction of astrocytes at 7 dpi, and it further verified the conjecture mentioned above.
In CNS disorders, the role of reactive astrocytes has been controversial for several decades. The overall net effect of reactive astrocytes deserves consideration in evaluating its function. There are some views that the dense astrocytic scar forms a physical barrier hindering axons regeneration after spinal cord injury or stroke [3,55,56]. However, our data showed that the dense astrocytic scar was a physical barrier that segregated neutrophils from the surrounding brain parenchyma.
Neutrophils are involved in BBB disruption by producing reactive oxygen species,proteases (e.g., MMPs), and pro-inflammatory factors (e.g., IL-1 and TNF-α). Furthermore, neutrophils produce neutrophil extracellular traps that further impair BBB permeability[57]. Similarly, we found that the disorganized astrocytic scar was accompanied by increased infiltration of neutrophils and delayed BBB repair after microglial depletion.
In addition, there is a widespread view that reactive astrocytederived CSPGs are associated with deteriorated plasticity and failed axon regeneration [4,30]. Intriguingly, results indicated that the CSPGs+areawas not significantly reduced in the lesion core area after astrocytic scar disruption. Sofroniew and co-workers [33] demonstrated that preventing astrocyte scar formation with STAT3-CKO did not reduce the expression of CSPGs in SCI lesions.They also indicated that scar-forming astrocytes aided rather than inhibited axonal growth after SCI[58].However,it is worth noting that the glial scar is more than just astrocytes.For example,the authors have ignored the deleterious effects of highly activated macrophages, which can induce the extensive retraction of axons through direct physical contact,specific ligand/receptor interactions,and protease secretion after SCI [59]. In addition, CSPGs inhibited axonal outgrowth in certain situations not by repulsion, but by excessive adhesion. This explains why dystrophic axons eventually took up residence in close apposition with CSPG-containing cells[59].Another interesting view demonstrates that there is no neural cell survival in the CNS lesion core. Hence, there is no necessity or benefit of promoting axon crossing the glial scar into the lesion core[60].In addition,different CSPGs exert diverse effects in inhibiting or supporting axon growth[58].CSPGs were highly upregulated by reactive astrocytes,fibroblast lineage cells, pericytes, and so on [58]. It indicates that CSPG levels may not precisely reflect an axon-inhibitory environment.
These findings indicate that microglia mediate the formation of neuroprotective astrocytic scar which promotes rather than hinders tissue repair at the early stage of ICH (within 7 dpi).
Since the sustained microglial depletion by plx3397 dietary treatment may not be a reasonable treatment strategy for ICH at the early stage,we subsequently induced the repopulation of microglia via plx3397 preprocessing. Previous studies have demonstrated that RM positively modulates the injured brain's microenvironment[16].The present study indicated that RM further accelerated neuroprotective astrocytic scar formation and established a suitable microenvironment for oligodendrocyte progenitor cells differentiation,remyelination,and BBB repair.Unexpectedly,although the mRNA expression of IGF1 was significantly elevated in RM than in endogenous microglia, IGF1 was necessary but insufficient for the function of RM.OPN,another key regulator highly expressed in RM,mediated a more protective scar formation together with IGF1.Microglia were the main source of OPN after injury [35]. It plays a vital role in mediating intercellular communication via its flexible structure and engagement with integrins or CD44-variant receptors [36]. Recent studies also indicated that the administration of OPN plus IGF1 significantly promotes axonal regeneration compared with OPN or IGF1 alone [61,62]. As the underlying mechanisms of the combined effect of OPN and IGF1 in driving mTOR activation are not yet elucidated, a plausible hypothesis is that OPN can sensitize astrocytic responses to IGF1 by interacting with integrins or other cell-surface proteins,thereby gathering the IGF1 receptors and strongly promoting mTOR signaling activation.
Lastly, the present study investigated the effect of microglia depletion during the chronic stage of ICH. Since the functions of microglia and astrocytes alter at different time periods in various CNS disorders [1,16,17], the function of the glial scar is likely to change at different stages of ICH. Our ST analysis revealed that changes in function and cellular components of astrocytic scar formed from 7 to 21 dpi. Neurotoxic A1 astrocytes occupied most of the cellular components of astrocytic scar.The overall net effect of astrocytic scar transformed from protection into destruction at the chronic stage of ICH. Similarly, previous studies also demonstrated that astrocyte components of the spinal injury scar had beneficial effects during the acute phase of injury but displayed detrimental effects at chronic or later stages [4,30]. In addition,microglia that retained a persistent state of activation into the chronic stages were generally regarded as detrimental after traumatic brain injury [16]. Subsequently, we found that delayed microglial depletion treatment significantly decreased C3 mRNA expression at 21 dpi compared to ICH+control dietary treatment.However, microglia repopulation or AAV-IGF1/OPN treatment failed to do so. Meanwhile, delayed microglial depletion was not associated with an increase of ICH lesion area,unlike the sustained microglial depletion. Previous studies also demonstrated that microglia ablation at chronic phase markedly improved chronic neuroinflammation after traumatic CNS injury [63,64]. Thus,delayed microglia depletion may be a potential therapeutic strategy for ICH at the chronic stage.
In summary,microglia-derived IGF1 modulated neuroprotective astrocytic scar formation via mTOR signaling activation during the early stage of ICH. The sustained microglial depletion induced disorganized glial scar and impaired tissue repair. Microglial repopulation could more strongly activate mTOR signaling via the combined effect of IGF1 and OPN,facilitating a more protective glial scar formation and establishing a suitable microenvironment for remyelination and BBB repair.During the chronic stage of ICH,the overall net effect of astrocytic scar transformed from protection into destruction. Delayed microglia depletion could bring benefits during this phase. Therefore, early-stage IGF1/OPN treatment combined with late-stage PLX3397 treatment could be a promising therapeutic strategy for ICH.
5. Conclusion
These findings reveal novel therapeutic avenues for ICH and prompt us to revisit the role of microglia and astrocytes. Rather than focusing on good versus bad unilaterally, the complex temporal dynamics and the overall net effect of activated microglia and reactive astrocytes deserve consideration in evaluating their function.Future preclinical studies should develop elaborate treatment strategies at precise time points after injury.
CRediT author statements
Jingwei ZhengandHaijian Wu:Conceptualization, Methodology, Writing - Original draft preparation;Xiaoyu WangandGuoqiang Zhang:Investigation, Data curation;Jia'nan LuandWeilin Xu:Formal analysis,Visualization;Shenbin XuandYuanjian Fang:Writing - Reviewing and Editing;Anke Zhang:Visualization;
Anwen ShaoandSheng Chen:Resources;Zhen Zhao:Writing -Reviewing and Editing;Jianmin ZhangandJun Yu: Supervision,Project administration, Funding acquisition.
Declaration of competing interest
The authors declare that there are no conflicts of interest.
Acknowledgments
This study was supported by the National Natural Science Foundation of China (Grant Nos.: 82071287 and 81870916), the National Natural Science Foundation of China (Grant No.:81971097), the Basic Public Interests Research Plan of Zhejiang Province, China (Grant No.: GF18H090006), the National Natural Science Foundation of China (Grant No.: 81701214), the National Natural Science Foundation of China (Grant No.: 82001299), and the Natural Science Foundation of Zhejiang Province, China(Grant No.:TGD23C040017).We thank LC-Bio for the assistance with RNAseq,Zelin Wang who founded the Shuzhi Biotech,LLC.(Guangzhou,China) for technical assistance with data processing, Amin Liu for the technical support with flow cytometry, as well as Prof. Baojin Wu for providing valuable advice on the present study.
Appendix A. Supplementary data
Supplementary data to this article can be found online at https://doi.org/10.1016/j.jpha.2023.02.007.
 Journal of Pharmaceutical Analysis2023年8期
- Journal of Pharmaceutical Analysis的其它文章
- Integrative multi-omics and systems bioinformatics in translational neuroscience: A data mining perspective
- Single-cell RNA sequencing reveals the dynamics of hepatic non-parenchymal cells in autoprotection against acetaminophen-induced hepatotoxicity
- Ultrasensitive proteomics depicted an in-depth landscape for the very early stage of mouse maternal-to-zygotic transition☆
- Promise of spatially resolved omics for tumor research
- A single-cell landscape of triptolide-associated testicular toxicity in mice
- Single-cell and spatial heterogeneity landscapes of mature epicardial cells