Construction of Quantum Dot-modified Ln-ZIF Hybrid Materials and Fluorescence Detection of Tannic Acid
2023-10-08 02:39FANGZhouJIADongshengLITianmingLIYingZHANGDongliang
发光学报 2023年9期
FANG Zhou, JIA Dongsheng, LI Tianming, LI Ying, ZHANG Dongliang
(School of Materials & Chemistry, University of Shanghai for Science and Technology, Shanghai 200093, China)
Abstract: Lanthanide Eu3+-doped metal-organic backbone material Eu/ZIF-67 was prepared by a one-step hydrothermal method with a novel pleated sphere structure. A dual-emission fluorescent hybrid material Eu/ZIF-67@ZnO QDs with a zeolite imidazolium ester backbone was obtained by loading ZnO quantum dots onto the surface of Eu/ZIF-67 via coordination bonding. The structure, morphology and fluorescence sensing properties of the material were characterized in detail. Furthermore, the fluorescent material was found to display the dual fluorescence emission of ZnO quantum dots and lanthanide red europium ions. The fluorescence sensing performance of Eu/ZIF-67@ZnO QDs to tannic acid was further investigated, and the results indicated that tannic acid can effectively burst the characteristic fluorescence emission of Eu/ZIF-67@ZnO QDs at ZnO QDs with a detection limit of 0.029 9 μmol/L. Meanwhile,Eu/ZIF-67@ZnO QDs have the fluorescence response to tannic acid with anti-interference ability, which can be used as a cost-effective fluorescence sensor to specifically identify tannic acid.
Key words: metal organic skeleton; quantum dots; dual-emission probes; tannic acid; fluorescent detection
1 Introduction
Tannins, or ellagic acid, is a multiphase phenolic compound widely distributed in nature and can be mainly classified into three categories: hydrolyzed tannins (HT), condensed tannins (CT) and fucoidan polyphenols (PT)[1-3]. The polyphenolic hydroxyl structure of tannins gives them a unique set of chemical properties and physiological activities, making them valuable in food, pharmaceutical and industrial production applications. The polyphenolic structure of tannins allows them to combine with proteins and alkaloids, as well as to complex and electrostatically interact with many metal ions, and to possess antioxidant and anti-inflammatory properties[4-9]. Therefore,tannins can be used as food antioxidants, detoxifying agents, sunscreen skin brighteners, topical coagulants, clarifying agents for beer and wine, coagulants for rubber,etc.[10]. In beer brewing, tannic acid can form precipitates with proteins in the wort, clarifying and making the beer transparent. However, excessive intake of tannic acid also has certain adverse effects on the human body, therefore, as a widely used food additive, the concentration level of tannic acid not only affects the flavor of food, but also plays a standard role in evaluating the quality of food[11-12].Currently, the detection of tannins mainly includes spectrophotometric[13], electrochemical[14-15], chromatographic[16]and colorimetric[17]methods. Although there are various detection methods, most of them exist poor selection specificity, complicated pre-processing or operation, expensive machine cost, and other problems, hence, it is of practical significance to explore a method for the accurate, rapid, and effective detection of tannins.
Quantum dots are quasi-zero-dimensional nanomaterials with a semiconducting nanostructure in which electrons are bound in all three directions.With the ability to modify the emission spectrum by modulating the size and chemical composition, quantum dots also have excellent photostability, large Stokes shifts, low cytotoxicity, and high stability[18-20].Therefore, they have a wide range of applications in recent decades in the fields of biofluorescent labeling, luminescent devices, and fluorescence detection[21-25]. Among them, ZnO quantum dots are a novel semiconductor nanomaterial with a forbidden band width of 3.37 eV[26], which have great potential for applications in fluorescence detection and matter sensing due to their good biocompatibility and excellent optoelectronic properties[27-29]. Metal organic framework materials (MOFs) are a class of porous crystalline materials with a regular network structure formed by metal ions or clusters as the central binding ligands. MOFs have in-depth investigations and applications in sensing and storage separation of gases, catalysis, and drug mitigation due to their high specific surface area, low crystal density, tunable pore size, and easily modified functional structures[30-33]. Due to metal-organic framework materials have the features of designable pore surface functional sites and adjustable ligands, novel framework structures can be continuously designed to expand the application fields of lanthanide MOFs by introducing different central metal ions, loading, or embedding nanomaterials and designing novel ligands.
Herein, we designed a simple & green strategy to construct a dual-emitting metal organic skeleton material. The yellow-emitting ZnO quantum dots were prepared by a chemical solution method and capped with amino groups to obtain amino-functionalized ZnO quantum dots; then a novel zeolite-like imidazolium ester backbone was constructed by doping with Co and lanthanide metal Eu to obtain a novel pleated sphere structured metal-organic framework. By loading ZnO quantum dots, a fluorescent hybrid material with double emission is finally obtained, which can realize the sensing detection of tannic acid and provide a simple and feasible method for the rapid and effective detection of tannic acid concentration.
2 Experiment
2.1 Preparation of Eu/ZIF-67@ZnO QDs
2.1.1 Experimental Reagents
Eu(NO3)3∙6H2O, Zn(OAc)2∙2H2O, L-arginine,L-alanine, glycine, L-aspartic acid, gallic acid, ellagic acid,(3-aminopropyl) tri-ethoxysilane(APTES),2-Methylimidazole, KBr and tannic acid(TA) were purchased from Adamas-beta Co., Ltd.(Shanghai,China). Methyl alcohol, L-ascorbic acid(AA), Mg-Cl2, NaCl, CuCl2, FeCl3∙6H2O, FeCl2∙4H2O, ZnCl2,KOH and CoCl2∙6H2O were purchased from Sinopharm Chemical Reagent Co., Ltd.(Shanghai, China). Toluene, anhydrous ethanol, glucose, and sucrose were purchased from Shanghai Aladdin Biochemical Technology Co., Ltd.(Shanghai, China).
2.1.2 Preparation Process
(1)Preparation of amino-functionalized ZnO QDs
The 2.79 mmol of Zn(OAc)2∙2H2O was added to 15 mL of anhydrous ethanol in a water bath at 78 ℃ and refluxed under vigorous stirring until completely dissolved. The 6 mol of KOH was dissolved in anhydrous ethanol and refrigerated to 4 ℃, then slowly add dropwise to the ethanol solution of Zn-(OAc)2∙2H2O. After stirring for 60 min at room temperature, 0.5 mmol of APTES was added to anhydrous ethanol/water (anhydrous ethanol∶water =10∶1), mixed well and added to the above reaction system, and continued to stir at room temperature for 6 h. After the reaction was completed, the precipitate was washed several times by centrifugation with toluene and anhydrous ethanol and dried, and the white translucent solid was obtained as ZnO QDs.
(2) Synthesis of Eu-doped ZIF-67
The mixture of 0.95 mmol of CoCl2∙6H2O and 0.05 mmol of Eu(NO3)3∙6H2O was dissolved in 10 mL of deionized water as solution A. The 20 mmol of 2-methylimidazole was dissolved in 10 mL of deionized water as solution B. After adding B to A and sonicating for 5 min, the mixed system was placed in a 50 mL reactor at 120 ℃ for 1 h. When reaction was finished, the mixture was washed several times by centrifugation using methyl alcohol and water, respectively, and dried to obtain the purple solid as Eu/ZIF-67.
(3) Construction of Eu/ZIF-67@ZnO QDs
The 20 mg of Eu/ZIF-67 was ultrasonically dispersed in 10 mL of deionized water, and 30 mg of ZnO QDs was dispersed in 10 mL of deionized water. The ZnO QDs solution was added dropwise to the aqueous solution of Eu/ZIF-67, stirred for 12 h at room temperature, and then centrifuged to obtain Eu/ZIF-67@ZnO QDs(Fig.1) .

Fig.1 Experimental process and schematic diagram of Eu/ZIF-67@ZnO QDs
(4) Sensing detection of tannic acid (TA)
Eu/ZIF-67@ZnO QDs were configured into a homogeneous solution, to which a series of TA solutions with different concentrations were added dropwise, and the fluorescence intensity changes were measured using a fluorescence spectrometer. The concentration range of the added TA solution was 0.01-1 μmol/L. The fluorescence emission spectrum was measured at the excitation wavelength of 356 nm, where the emission wavelength was 505 nm for ZnO QDs and 615 nm for Eu/ZIF-67@ZnO QDs.The slit of the instrument was 5 nm in all fluorescence tests.
2.2 Performance and Characterization of Samples
The chemical structure of the samples was characterized by potassium bromide compression and scanned on a Fourier transform infrared spectroscopy (FT-IR) SPECTRUM 100 FT-IR spectrophotometer (Perkin Elmer, USA) at 4 000-400 cm-1. Scanning electron microscopy (SEM) was performed on a ZEISS Sigma 300 (Germany) with acceleration voltageEHT= 3.0 kV. Powder X-ray diffraction (XRD)was determined on a D8 ADVANCE X-ray diffractometer. The UV-Vis absorption spectra of the samples were obtained by analysis on a UV-Vis spectrometer(Lambda FEG450). The samples were analyzed for elemental content and functional group types using X-ray photoelectron spectroscopy (XPS)with a Thermo Scientific K-Alpha+, monochromatic AI Kα X-ray source(1 486.6 eV) at 12 kV and 72 W, respectively, instrument model and parameters.Fluorescence spectroscopy tests were obtained on a Shimadzu S220 V fluorescence spectrophotometer and an Edinburgh FLS920 fluorescence spectrometer with excitation sources of 450 W xenon lamp, μF 920H pulsed light source and EPL-375 nanosecond light source.
3 Results and Discussion
3.1 Structural Characterization of ZnO QDs,Eu/ZIF-67 and Eu/ZIF-67@ZnO QDs
The surface morphology before and after the Eu/ZIF-67 composite ZnO QDs was characterized by scanning electron microscopy (EHT=3.00 kV,Mag=50.00 KX, SignalA=SE2,WD=7.9 mm). As the Fig.2(a) describes, the surface of the Eu-doped ZIF-67 is richly folded and has an overall spherical shape with a diameter of about 1.2 μm. The introduction of ZnO QDs resulted in fewer folds on the surface of the irregular spheres and many particles loaded on the surface, leading to a slight increase in the particle size of the spheres. The above results suggest that the ZnO QDs are probably loaded on the surface of the Eu/ZIF-67 skeleton by chemical bonding, and their introduction would not cause the collapse of the skeleton structure.

Fig.2 The SEM images of Eu/ZIF-67(a) and Eu/ZIF-67@ZnO QDs(b)
The chemical structures of ZnO QDs (a), ZIF-67 (b), Eu/ZIF-67 (c) and Eu/ZIF-67@ZnO QDs(d) were characterized by FT-IR. As Fig.3 suggests, where the broadband at 3 469 cm-1is attributed to the O—H stretching vibration and the absorption peaks at 2 925 cm-1and 3 134 cm-1are attributed to the C—H stretching vibration. Line a corresponds to ZnO QDs, where the absorption peak at 1 595 cm-1is attributed to N—H and the absorption band near 1 000 cm-1is attributed to the Si—O band from APTES. These characteristic peaks indicate that APTES was successfully encapsulated on the surface of ZnO QDs and ZnO QDs were successfully amino-functionalized[34-36]. Among the lines b, c and d, the peak clusters in the range of 680-1 500 cm-1are attributed to the stretching and bending vibrations of the imidazole ring, the absorption peak at 1 598 cm-1is attributed to the stretching vibrations of C—N, and the broad absorption band at 1 044 cm-1in d is attributed to Si—O in ZnO QDs[37-38]. The above results indicate the successful preparation of ZnO QDs and zeolite-like imidazole ester frameworks, and the introduction of ZnO QDs didn't destroy the skeleton structure of Eu/ZIF-67.
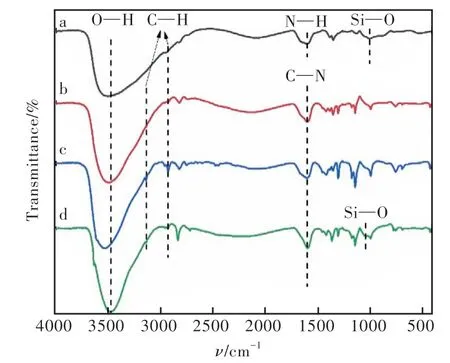
Fig.3 FT-IR spectrum of ZnO QDs(a), ZIF-67(b), Eu/ZIF-67(c) and Eu/ZIF-67@ZnO QDs(d).
The crystal structures of ZnO QDs, ZIF-67,Eu/ZIF-67 and Eu/ZIF-67@ZnO QDs were characterized by X-ray powder diffraction. As described in Fig.4, Eu/ZIF-67 and Eu/ZIF-67@ZnO QDs exhibit the same crystal structure at 2θ=7.39°(011),10.38°(002), 12.75°(112), 14.70°(022), 16.47°(013), 18.06°(222), 22.14°(114), 24.50°(233),26.70°(134) , which corresponds exactly to the ZIF-67 in the literature[37-38]. They demonstrate that the introduction of ZnO QDs did not cause the collapse of the crystal structure of Eu/ZIF-67. The ZnO QDs exhibit broad peaks at 31.78°(001),34.47°(002), 36.15°(101), demonstrating the successful preparation of ZnO QDs. Furthermore,the characteristic peaks at 36.46° and 34.54° for Eu/ZIF-67@ZnO QDs are attributed to the combination of ZnO QDs with Eu/ZIF-67, further demonstrating the successful preparation of europium iondoped zeolite-like imidazolium-based frameworks and Eu/ZIF-67 with ZnO QDs.
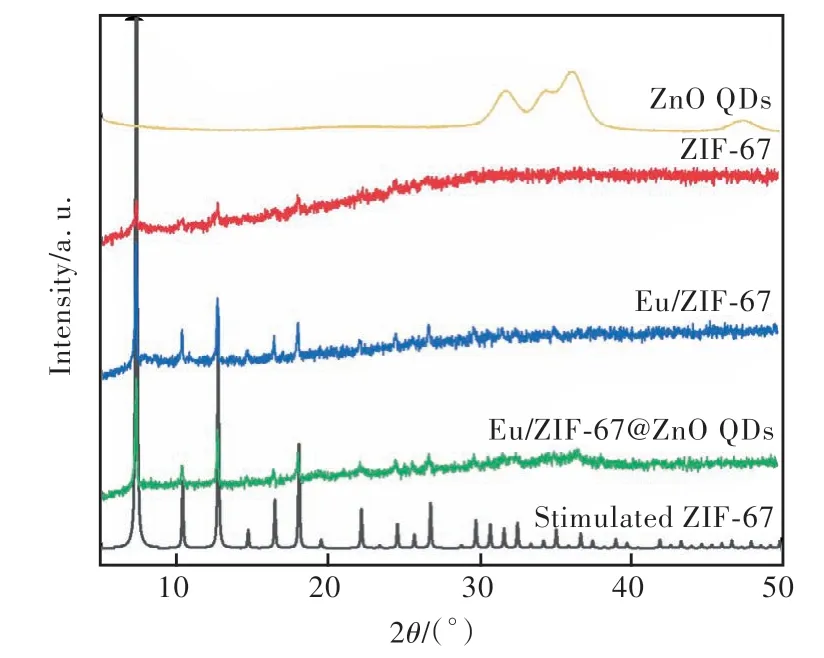
Fig.4 XRD spectrum of ZnO QDs, ZIF-67, Eu/ZIF-67, Eu/ZIF-67@ZnO QDs and stimulated ZIF-67.
The elemental composition of the prepared Eu/ZIF-67@ZnO QDs was analyzed by XPS. This material shows the characteristic peaks of C, O, N,Co, and Eu at 284.73, 530.95, 398.82, 781.03,1 134.71 eV, respectively. The contents of these five elements are 46.93%(C), 21.94%(O), 13.81%(N), 4.33%(Co), and 0.79%(Eu). Fig.5(b)-(f) represents the fine spectrum of C 1s, O 1s, N 1s, Co 2p, and Eu 3d, respectively. For the C 1s spectrum, three peaks appear at 284.3, 284.9,285.6 eV, which correspond to the characteristic peaks of C—C/C=C, N—C=N and C—O, respectively; for the O 1s spectrum, there are three peaks at 530.1, 531.1, 531.9 eV, indicating the presence ofM—O(Mfor Zn, Co, Eu), Si—O and materials in the sample that indicate the possible adsorption of presence of water, and also demonstrates the successful introduction of ZnO QDs[36,39]. For the N 1s spectrum, the peaks at 398.4, 398.9, 399.4,400.4 eV can be attributed to C=N—C, Co—N,C—NH—C and N—O, respectively. the Co 2p spectrum is composed of two energy levels concentrated at 780.9 eV and 796.9 eV, respectively, attributed to Co 2p3/2and Co 2p1/2. The peaks at 780.7, 782.3, 786.5 eV can be attributed to Co2+,Co3+and a satellite peak, respectively[37-38]. For the Eu 3d spectrum, 1 134.7 eV and 1 164.9 eV correspond to the Eu 3d5/2and Eu 3d3/2energy levels, respectively[40]. For the Zn 2p spectrum, 1 021.6 eV and 1 044.6 eV correspond to two energy levels, Zn 2p3/2and Zn 2p2/1, respectively. The above results are consistent with the FT-IR spectral results, further indicating the successful synthesis of Eu/ZIF-67@ZnO QDs.

Fig.5 (a)XPS spectrum of Eu/ZIF-67@ZnO QDs. (b)C 1s spectrum of Eu/ZIF-67@ZnO QDs. (c)O 1s spectrum of Eu/ZIF-67@ZnO QDs. (d)N 1s spectrum of Eu/ZIF-67@ZnO QDs. (e)Co 2p spectrum of Eu/ZIF-67@ZnO QDs. (f)Eu 3d spectrum of Eu/ZIF-67@ZnO QDs.
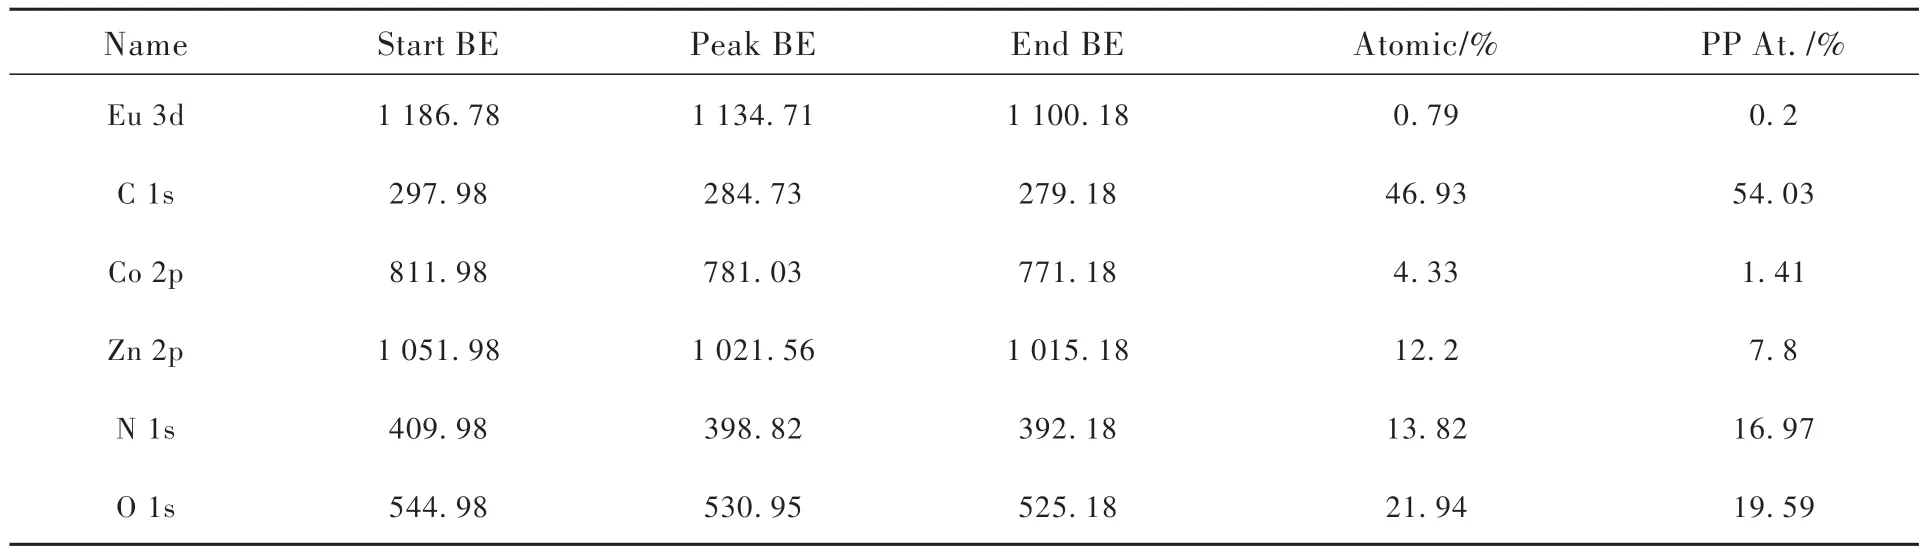
Tab.1 The XPS survey of Eu/ZIF-67@ZnO QDs of each element
3.2 Fluorescent Properties of Eu/ZIF-67@ZnO QDs
The excitation and generation spectra of the prepared ZnO QDs and Eu/ZIF-67@ZnO QDs were measured using a fluorescence spectrometer at room temperature. As shown in Fig.6(a), the optimal emission spectrum, and the optimal excitation spectrum of the ZnO QDs were determined at the excitation wavelength of 356 nm and the emission wavelength of 572 nm, respectively. Fig.6(b) indicates that the optimal emission spectra and the optimal excitation spectra of Eu/ZIF-67@ZnO QDs were determined at 356 nm excitation wavelength and 615 nm emission wavelength, respectively, where the emission peak at 554 nm was attributed to the yellow emission of ZnO QDs and the emission peak at 615 nm was attributed to the characteristic jump of Eu at5D0-7F2. The two emission peaks surface the successful doping of Eu and the successful introduction of ZnO QDs.
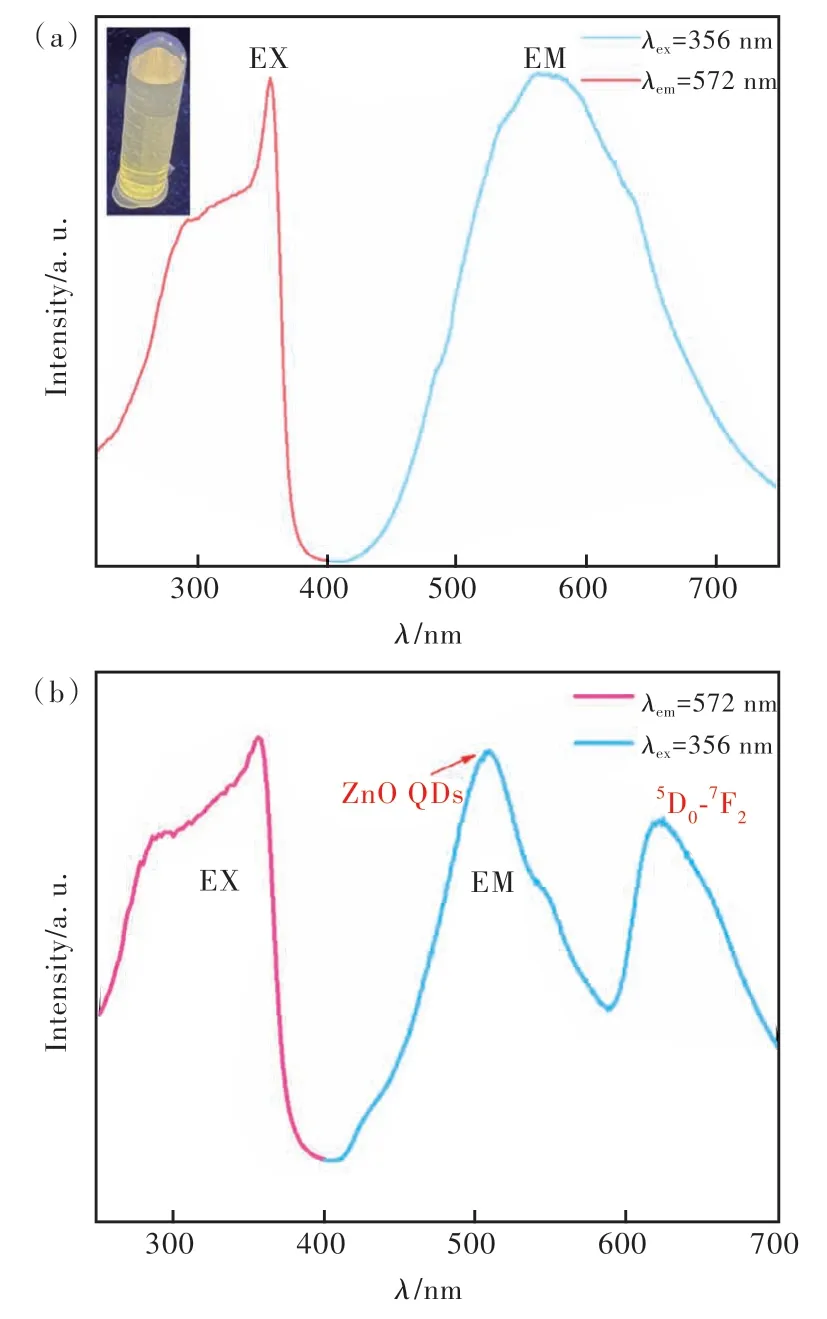
Fig.6 (a)The optimal excitation and emission spectrum of ZnO QDs(inset is a photograph of aqueous ZnO QDs under a 365 nm UV lamp). (b)The optimal excitation and emission spectrum of Eu/ZIF-67@ZnO QDs.
To investigate the sensitivity of Eu/ZIF-67@ZnO QDs for the detection of TA, the fluorescence response of this fluorescent probe to different concentrations of TA was carried out. Firstly, time and temperature conditions optimization experiments were carried out for the detection of TA. Fig.7(c)-(d) illustrate that, when TA was added, the fluorescence response value of Eu/ZIF-67@ZnO QDs completed the response within 1 min with little subsequent change as the time increased. Then the response of Eu/ZIF-67@ZnO QDs to TA was investigated at different incubation temperatures. The fluorescence response decreases continuously as the temperature increases. Considering the environmental temperature of 20-28 ℃ for TA in beer brewing,25 ℃ was chosen as the real-time detection temperature. Fig.7(a) reveals that the fluorescence intensity of Eu/ZIF-67@ZnO QDs at both quantum dots and rare earth ions gradually decreases with the increase of TA concentration, we selected the fluorescence intensity change at ZnO QDs as the response signal.As shown in Fig.7(b), it can be analyzed that the probe has a good fluorescence response to TA in the concentration range of 0-0.2 μmol/L, and its weakening trend is well in line with the first order exponential decay, and the fluorescence response value(F/F0) shows a good linear relationship with the concentration of TA. A linear fit was performed to obtain a linear regression equation ofy= -0.8471x+0.9699(R2= 0.996). The fit was calculated using the Stern-Volmer equation as follows.

Fig.7 The fluorescence response values(F/F0) of Eu/ZIF-67@ZnO QDs to TA with respect to temperature(a) and reaction times(b). The fluorescence emission spectrum of Eu/ZIF-67@ZnO QDs after the addition of different concentrations of TA(λex=356 nm)(c) and fluorescence response values(F/F0) versus TA concentration(inset is a linear plot)(d).
whereCis the concentration of tannic acid (TA),KSVis the Stern-Volmer constant,Fis the fluorescence intensity at ZnO QDs after the addition of TA,andF0is the fluorescence intensity of blank Eu/ZIF-67@ZnO QDs at ZnO QDs. The detection limit(LOD)Dof the probe for TA can be calculated from the 3σequation as 0.029 9 μmol/L:
σis the standard deviation obtained from 20 consecutive scans of the probe blank solution, andSis the slope of the linear regression equation.
We compared the Eu/ZIF-67@ZnO constructed in this work with the recent related work. As shown in Tab.2, it is observed that the Eu/ZIF-67@ZnO fluorescent probe prepared in this work possesses better sensitivity and lower detection limit for the detection of TA. From the above results, it is concluded that the Eu/ZIF-67@ZnO QDs probe has good fluorescence sensing properties for TA and can be used as an excellent sensor to measure the concentration level of TA.
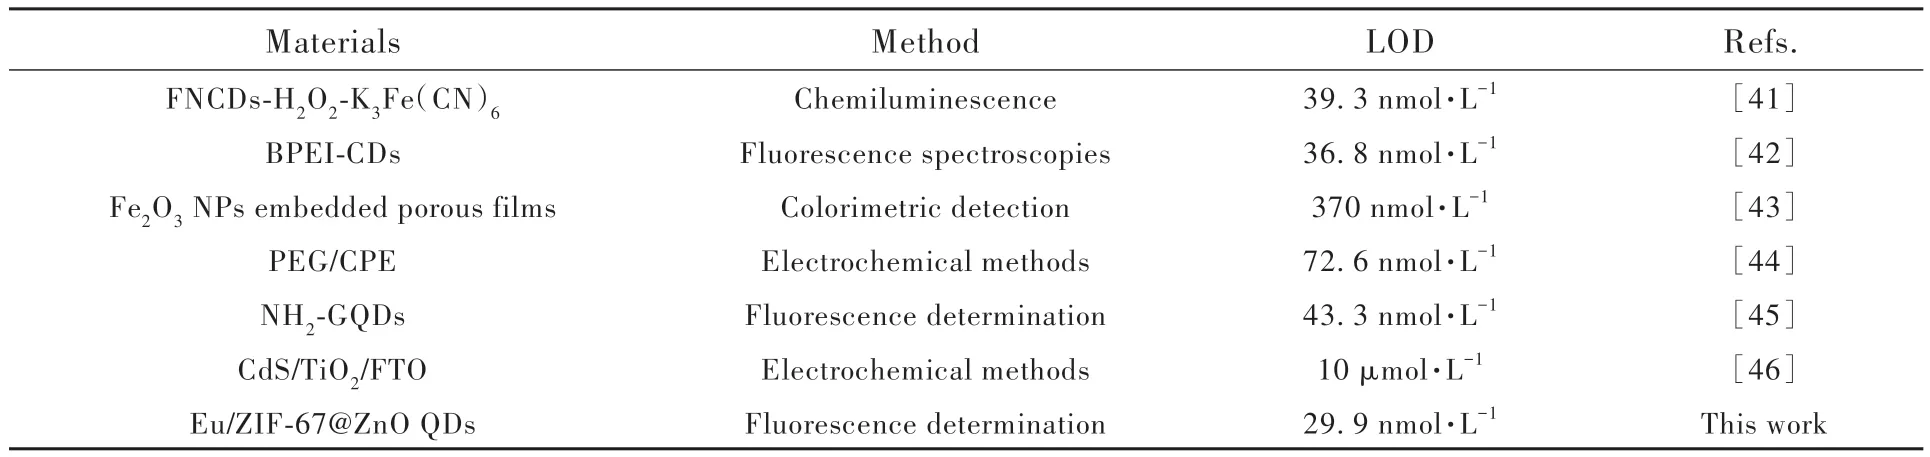
Tab.2 The comparison table of Eu/ZIF-67@ZnO for detecting TA with other works
To further investigate the specificity and selectivity of Eu/ZIF-67@ZnO QDs probes for the detection of TA, anti-interference tests were performed for common substances, including Mg2+, Na+, Cu2+, Ca2+,Zn2+, Fe2+, Fe3+, Cl-; the common amino acids L-arginine, L-ascorbic acid (AA), L-alanine, glycine, L-aspartic acid, gallic acid, and ellagic acid; sugars such as glucose, sucrose. The concentration of TA was 0.01 μmol/L and the concentration of all other interfering substances was 1 μmol/L. We examined the fluorescence response changes of the Eu/ZIF-67@ZnO QDs probes for these substances. Compared with other anti-interference substances, tannic acid can effectively burst the fluorescence of Eu/ZIF-67@ZnO QDs(Fig.8). These results demonstrate that Eu/ZIF-67@ZnO QDs can be used as a fluorescent sensor with good sensitivity and specificity for the selective detection of TA.

Fig.8 The fluorescence emission spectrum of Eu/ZIF-67@ZnO QDs after dropwise addition of different antiinterference substances at 356 nm(F is the fluorescence intensity at ZnO QDs after the addition of different anti-interference substances, and F0 is the fluorescence intensity of blank Eu/ZIF-67@ZnO QDs at ZnO QDs).
3.3 Possible Mechanism of Fluorescence Quenching of Eu/ZIF-67@ZnO QDs
The UV absorption spectra of Eu/ZIF-67@ZnO QDs and the detection substance tannic acid (TA)were scanned by UV-Vis spectrophotometer. From the absorption spectrum of TA, it can be clearly seen that TA has a broad absorption peak within 200-350 nm, while the fluorescence emission characteristic peak of ZnO QDs of Eu/ZIF-67@ZnO QDs is at 505 nm, and its absorption spectrum does not match with the luminescence spectrum of Eu/ZIF-67@ZnO QDs. According to the above results, we speculate that the fluorescence quenching of ZnO QDs is not caused by TA absorption, which excluding the fluorescence quenching caused by the fluorescence resonance energy transfer. In addition, the position of the UV absorption peak almost did not change before and after adding TA(Fig.9(a)). As illustrated in Fig.9(b), the UV absorption peak of Eu/ZIF-67@ZnO QDs occurs a blue-shift trend with the increase of the concentration of TA. So, it can be inferred that the formation of zincate complexes between TA and quantum dots due to the charge transfer. And it can be attributed to the dynamic collision between quantum dots and TA, resulting in electron transfer between quantum dots and aromatic groups of TA.As shown in Fig.9(c), there is a good overlap between the UV absorption spectra and the fluorescence excitation and emission spectra of Eu/ZIF-67@ZnO QDs, therefore, we speculate that the internal filtration effect is also one of the possible causes of the fluorescence burst. In summary, the fluorescence quenching of Eu/ZIF-67@ZnO QDs by TA may be generated based on the synergistic effects of both charge transfer and internal filtration effects[47].
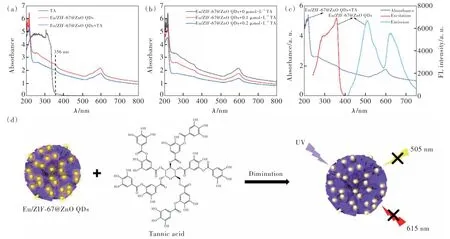
Fig.9 (a)UV-Vis spectroscopic of TA, Eu/ZIF-67@ZnO QDs, and Eu/ZIF-67@ZnO QDs +TA. (b)UV-Vis spectroscopic of Eu/ZIF-67@ZnO QDs with different concentrations of TA added. (c)The UV-Vis spectroscopic, excitation and emission spectrum of Eu/ZIF-67@ZnO QDs. (d)The mechanism of tannic acid detection by Eu/ZIF-67@ZnO QDs.
4 Conclusion
In summary, a new pleated spherical zeolitelike imidazole ester skeleton material Eu/ZIF-67 was prepared by doping with lanthanide Eu, and aminofunctionalized quantum dots ZnO QDs were successfully loaded on the surface to obtain a fluorescent hybrid material Eu/ZIF-67@ZnO QDs with double emission. It was found that this fluorescent hybrid material could achieve fluorescence detection of TA with good selective specificity and detection sensitivity, and the detection limit was as low as 0.029 9 μmol/L, and the fluorescence response could occur rapidly within 1 min. It provides a new idea for the economical and efficient measurement of TA concentration levels.
Response Letter is available for this paper at:http://cjl.lightpublishing.cn/thesisDetails#10.37188/CJL.20230048.