
Characterization of natural peptides in Pheretima by integrating proteogenomics and label-free peptidomics
2023-10-24 02:40XiaoxiaoLuoQiruiBiDongongHuangYunLiChangliangYaoJianqingZhangWenlongWeiJiayuanLiZhenweiLiJingxianZhangShenJiYurongWangDeanGuo
Xiaoxiao Luo ,Qirui Bi ,Dongong Huang ,Yun Li ,Changliang Yao ,Jianqing Zhang ,Wenlong Wei ,Jiayuan Li ,Zhenwei Li ,Jingxian Zhang ,Shen Ji ,***,Yurong Wang ,De-an Guo a,,*
a School of Basic Medicine and Clinical Pharmacy,China Pharmaceutical University,Nanjing,211198,China
b Shanghai Research Center for Modernization of Traditional Chinese Medicine,National Engineering Research Center of TCM Standardization Technology,Shanghai Institute of Materia Medica,Chinese Academy of Sciences,Shanghai,201203,China
c University of Chinese Academy of Sciences,Beijing,100049,China
d NMPA Key Laboratory for Quality Control of Traditional Chinese Medicine,Shanghai Institute of Materia Medica,Chinese Academy of Sciences,Shanghai,201203,China
Keywords:Pheretima Natural peptides Label-free peptidomics Proteogenomics Animal derived medicine
ABSTRACT Pheretima,also called “earthworms”,is a well-known animal-derived traditional Chinese medicine that is extensively used in over 50 Chinese patent medicines (CPMs) in Chinese Pharmacopoeia (2020 edition).However,its zoological origin is unclear,both in the herbal market and CPMs.In this study,a strategy for integrating in-house annotated protein databases constructed from close evolutionary relationship-sourced RNA sequencing data from public archival resources and various sequencing algorithms (restricted search,open search,and de novo) was developed to characterize the phenotype of natural peptides of three major commercial species of Pheretima,including Pheretima aspergillum (PA),Pheretima vulgaris (PV),and Metaphire magna (MM).We identified 10,477 natural peptides in the PA,7,451 in PV,and 5,896 in MM samples.Five specific signature peptides were screened and then validated using synthetic peptides;these demonstrated robust specificity for the authentication of PA,PV,and MM.Finally,all marker peptides were successfully applied to identify the zoological origins of Brain Heart capsules and Xiaohuoluo pills,revealing the inconsistent Pheretima species used in these CPMs.In conclusion,our integrated strategy could be used for the in-depth characterization of natural peptides of other animal-derived traditional Chinese medicines,especially non-model species with poorly annotated protein databases.
1.Introduction
Pheretima,also known as earthworms,is an animal-derived traditional Chinese medicine that has been widely used in Asia for thousands of years because of its anticoagulant,fibrinolytic,antiepileptic,and cough-and asthma-relieving activities [1,2].According to Chinese Pharmacopoeia(ChP,2020 edition),the dried bodies of four earthworm species are the original medicinal materials of Pheretima,includingPheretima aspergillum(PA),Pheretima vulgaris(PV),Pheretima guillelmi(PG),andPheretima pectinifera(PP) [3].Pheretima is used in approximately 10% of Chinese patent medicines(CPMs)containing animal-derived drugs (50/504) in the ChP [4].However,market research showed that 44% of commercial Pheretima samples were from PA and PV,approximately 55% fromMetaphire magna(MM),an unofficial species,and less than 1% from PG and PP[5].Additionally,there are several sympatrically distributed related species with similar morphological characteristics,making it difficult to distinguish authentic medicines from adulterated species [6] as well as to identify the source of Pheretima in CPMs.Although much work has been done on the authentication of Pheretima species,such as amino acids [7],endogenous small molecules [1],tryptic peptides[5,8],DNA barcoding [9],and biological source consistency evaluation[6],a viable approach to identify Pheretima species in CPMs is still lacking.
Natural peptides are an important group of components in animal-derived drugs having diverse bioactivities,which include antibacterial peptides[10],toxic peptides[11],neuropeptides[12],and peptide hormones [13].Although tryptic peptides are specific for the authentication of Pheretima species [5,8],natural peptides have some advantages.First,they are potential active ingredients that are naturally present in the organism.Second,without enzymatic hydrolysis,the sample preparation process of natural peptides is much more time-saving,labor-saving,and economical.However,research on natural peptides has been hampered for many reasons.First,the database search is widely devoted to proteomics-based peptide identification,which has been used to screen species-specific peptide biomarkers ofBombyx batryticatu[14],deer-hide gelatin [15],leather [16],and bacterial pathogens[17].However,most animal-derived drugs in the ChP are from nonmodel species that have not been well-studied in protein database annotations.Second,natural peptides are complex,with more than 1,000 reported post-translational modifications (PTMs) [18,19].Third,natural peptides may have low sensitivity or high falsepositive rates during peptide identification because of the large search space created by nonspecific digestion [20,21].
Proteogenomics integrates transcriptomics and proteomics to create an annotated protein database that can be used to interpret tandem mass spectrometry(MS/MS)spectra of enzymatic proteins.This strategy has been successfully applied to protein database construction and molecular phenotyping of emerging model organisms [22].Moreover,international public archival resources,such as the Sequence Read Archive (SRA),preserve public-domain sequencing data that are free,unrestricted,and permanently accessible.By October 2022,the SRA had stored approximately 6.7×10¹⁶bp of raw sequencing data (https://www.ncbi.nlm.nih.gov/sra/docs/sragrowth/) [23],providing good resources for protein database construction.Several computational strategies,such as alignment-based,sequence tag-based,spectral library searching,and de novo approaches,have been proposed for peptide identification,which have proven to be useful.
In this study,three major commercial Pheretima species were evaluated for natural peptide characterization and signature peptide screening and subsequently used for species identification of Pheretima in CPMs.First,theoretical protein databases for the three species were established using proteogenomics,based on opensource RNA sequencing(RNA-seq)data.Second,natural peptides in the species were characterized through de novo and database searches.Third,the peptide biomarkers of the species were screened using label-free peptidomics.Fourth,targeted dynamic multiple reaction monitoring(dMRM)peptidomics based on a precursor ion list were performed to screen for signature peptides,which were further validated using synthetic peptides.Finally,signature peptides were used for the species differentiation of multi-source Pheretima in CPMs,including Brain Heart capsules (BHCs) and Xiaohuoluo pills(XHLs).Overall,this strategy provides an approach for characterizing natural peptides in animal-derived drugs and screening for signature peptides to identify the zoological origin of CPMs,especially for animal-derived drugs with poorly annotated databases.
2.Materials and methods
2.1.Reagents and materials
Ultrapure water (18.2 MΩ∙cm at 25°C) used in this study was purified using a Millipore Alpha-Q water purification system(Millipore,Billerica,MA,USA).We purchased 36 batches of Pheretima from a herb market(Bozhou,China),including 11 batches of PA,12 of PV,and 13 of MM,which were macroscopically and microscopically identified by Dr.De-an Guo from the Shanghai Institute of Materia Medica,Chinese Academy of Sciences (Shanghai,China),and also examined with DNA barcoding and signature tryptic peptides [5,7].Detailed information on the study samples is summarized inTable S1.Acetonitrile(ACN)and formic acid(FA)(ROE Scientific Inc.,Newark,DE,USA) were mass-spectrometry grade.Signature peptides were synthesized by Shanghai Royo Biotech Co.,Ltd.(Shanghai,China).
2.2.Sample preparation
Several extraction solvents were optimized,including 8 M urea,1% NH4HCO3,phosphate-buffered saline,and water.Of these,8 M urea was selected as the extraction solvent because of its superior peptide identification properties (Fig.S1).
For sample preparation,100 mg each of PA,PV,and MM samples were sonicated in 1 mL of 8 M urea for 30 min and centrifuged at 14,000 rpm at 4°C for 10 min.The resulting supernatant (200 μL)was precipitated with 3×volume of pre-cooled acetone[24-26]for 30 min at 4°C and centrifuged at 14,000 rpm for 10 min.The supernatant of the natural peptides was dried in a vacuum concentrator (Thermo Scientific Inc.,Wilmington,DE,USA) to remove organic solvents.Precipitates of tryptic peptides were subjected to reduction,alkylation,and trypsin hydrolysis according to previously reported methods with minor modifications [27].All samples were desalted using Sep-Pak C18cartridges(Waters,Milford,MA,USA)and resuspended in Milli-Q water containing 0.1% (V/V) FA before analysis.Quality control (QC) samples (total QC and single-species QC)were prepared by pooling equal amounts of powder from the analyzed samples.
2.3.Liquid chromatography-mass spectrometry (LC-MS) analysis
2.3.1.High-resolution MS (HRMS) analysis
All samples were analyzed using an Ultimate 3,000 UHPLC system in tandem with a linear ion-trap quadrupole-Orbitrap Velos Pro hybrid mass spectrometer equipped with an electrospray ionization(ESI)source operated in positive ion mode(Thermo Fisher Scientific Inc.,Waltham,MA,USA).Chromatographic separation was performed on an ACQUITY UPLC®BEH C18column(2.1 mm×100 mm,1.7 μm)maintained at 30°C.The mobile phase consisted of 0.1%(V/V)FA in water (A) and 0.1% (V/V) FA in ACN (B) with an optimized gradient program: 0-5 min,5% (B);5-55 min,5%-25% (B);55-75 min,25%-35% (B);75-83 min,35%-95% (B);83-87 min,95%(B);87-87.1 min,95%-5%(B);and 87.1-90 min,5%(B).The flow rate was set at 0.3 mL/min and the injection volume at 4 μL.
The optimum source parameters were set as follows: spray voltage,3 kV;capillary temperature,300°C;source heater temperature,400°C;sheath gas (N2),40 arbitrary units;and auxiliary gas(N2),10 arbitrary units.The Orbitrap analyzer scanned over a mass range ofm/z300-2,000 in profile format with a resolution of 30,000 for the MS1scan,and in centroid format with a resolution of 7,500 for the MS2scan.The normalized collision energy of the MS/MS product ions was 30%.Dynamic exclusion was enabled using the following parameters: number of repetitions,1;repetition duration,20 s;exclusionlist size,50;andexclusion duration,20 s.An isolationwidth of 2 Da was used.The minimum signal intensity that could trigger MS2fragmentation was set to 5,000.Data were recorded and processed using Xcalibur 2.1 software(Thermo Fisher Scientific Inc.).
2.3.2.Triple quadrupole (QQQ) MS analysis
Targeted peptide analysis was performed on the Agilent 6,495 Triple Quad (Agilent Technologies,Palo Alto,CA,USA) equipped with an Agilent 1,290 Infinity II UPLC system and an ESI source operating in positive ion mode.Chromatographic separation was performed using an ACQUITY UPLC®BEH C18column(2.1 mm×50 mm,1.7 μm)with a mobile phase of 0.1%(V/V)FA in water (A) and 0.1% (V/V) FA in ACN (B).The optimized gradient program was set as follows: 0-13 min,5%-15% (B);13-20 min,15%-20%(B);20-25 min,20%-35%(B);25-26 min,35%-95%(B);26-28 min,95% (B);28-28.1 min,95%-5%;and 28.1-30 min,5%(B).The flow rate was set at 0.3 mL/min and the injection volume was set at 4 μL.
The ESI source parameters were set as follows:gas temperature,200°C;gas flow (N2),14 mL/min;nebulizer,35 psi;sheath gas temperature,250°C;sheath gas flow,11 mL/min;capillary voltage,4,000 V;and nozzle voltage,500 V.Peptides were detected in dMRM mode.
2.4.Method validation for dMRM
Method validation,including linearity,precision,and repeatability,was performed.The total QC sample solutions were serially diluted to obtain a 210-fold dilution series(1,1/2,1/22,1/23,1/24,1/25,1/26,1/27,1/28,and 1/29).Linearity was assessed by calculatingR2of the rate of change in peak area versus the concentration for each multiple reaction monitoring transition.Precision was expressed as the relative standard deviation (RSD) of six repeated injections within one day.Repeatability was denoted by the RSD of the six QC samples.
2.5.Database construction
The transcriptome data (Table S2) for PA,PV,and PG were obtained from the National Center for Biotechnology Information(NCBI) public SRA database (https://www.ncbi.nlm.nih.gov/sra).Sequencing reads were assembled into contigs using Trinity software(Ver.2.13.2)(Broad Institute,Boston,MA,USA)[28]with default parameters.The contigs were translated using Trans-Decoder software (Ver.5.5.0) (Broad Institute) [29].To maximize the peptide identification rate,the minimum length of each protein sequence was set to 50 according to the optimized results.Finally,CD-hit software (Ver.4.8.1) (University of California,Riverside,CA,USA) was used to remove redundant sequences[30],and Geneious Prime software (Ver.2022.0.1) (Biomatters,Auckland,New Zealand) was used for statistical analysis,with a similarity of 1.0.
2.6.Comprehensive peptide identification
Peptide identification was performed using PEAKS Studio®Xpro 10.0 software (Bioinformatics Solutions Inc.,Waterloo,Canada) through de novo and restricted search.The parameters were set as follows:nonspecific mode;oxidation,and acetylation were set as variable modifications;fragment ion tolerance was 0.05 Da;and precursor ion tolerance was 10 ppm.All other parameters were set to the default settings.To increase the peptide identity rate,an open search in pFind [31] was used for peptide characterization.Its parameters were set as follows:open search;parent mass error tolerance,10 ppm;fragment mass error tolerance,0.05 Da;peptide mass,600-10,000 Da;and peptide length,6-100.For tryptic peptides,trypsin and other specific modes were selected for the enzymatic module.Carbamidomethylation(+57.02) was set as a fixed modification.The other parameters were the same as those used for natural peptides.Result filtration parameters were set as follows: for peptides,false discovery rate(FDR) <1%,de novo score >90;for proteins,FDR <1%,unique peptides ≥1.
2.7.Chemometric analysis
Progenesis QI 2.1 software (Waters,Redmond,WA,USA) was used to extract ionic information.Ion fusion was performed for multi-charged ions,including [M+H]+,[M+2H]2+,and [M+3H]3+,and so on.All information was exported using a data matrix,including molecular weight,charge,retention time,adduct ion,and intensity.Volcanic maps were analyzed using Origin 2022 software(OriginLab,Northampton,MA,USA).The results were imported into SIMCA-P 14.1 software (Umetrics AB,Umea,Sweden) for multivariate statistical analysis using projections to latent structures discriminant analysis(PLS-DA)in both the unit variance(UV)and Pareto variance (Par) models.Discriminating features with a coefficient>0 and variable importance for the projection(VIP)>1 in the UV model,and a coefficient>0 and VIP>1.5 in the Par model were considered and manually checked.Clustered heat map analysis was performed using Origin 2022 software.MS proteomics data,databases,and results were deposited in the ProteomeXchange Consortium via the PRIDE partner repository under the dataset identifier PXD041497.
3.Results and discussion
3.1.Peptidomics analysis of natural peptides in Pheretima
3.1.1.Establishment of protein databases
The in-house theoretical Pheretima protein databases of PA and PG were established in our laboratory based on the coding sequence prediction of transcriptome data,which were uploaded to the NCBI website [5].However,until December 2022,the PV and MM protein databases were poorly annotated,with no sequences retrieved from the NCBI website.However,PV transcriptome data could be downloaded from the SRA website.The neighbor-joining(NJ) tree (Fig.1A) indicated that PA,PV,and PG had a close evolutionary relationship with MM among the 149 Amynthas and Metaphire species.Nonspecific databases have a positive effect on peptide identification in proteomic studies,especially for organisms with poorly annotated databases[32].Therefore,in this study,the RNA-seq data for PA,PV,and PG were downloaded from the SRA website,assembled,translated,and had redundancies removed to construct protein databases(Fig.1B and Table S2).The database richness is highly dependent on the quality of RNA-seq data,which were assessed using the contig length of N50 and the Benchmarking Universal Single-Copy Orthologs (BUSCO) [33].The N50s of PA,PV,and PG were 2,263,2,489,and 1,805,respectively,and the BUSCOs of the three species exceeded 90% (Fig.S2).These results indicated that the data assembly quality of the species was satisfactory and suitable for protein database construction.Finally,three databases were constructed using 185,813,292,787,and 151,809 protein sequences of PV,PG,and PA,respectively.The newly constructed databases are available in the PRIDE Archive.As shown in Fig.1C,sequences with a length range of 100-300 constituted 60%-85% of the databases.Amino acid compositions and proportions in the three databases were consistent (Fig.1D).
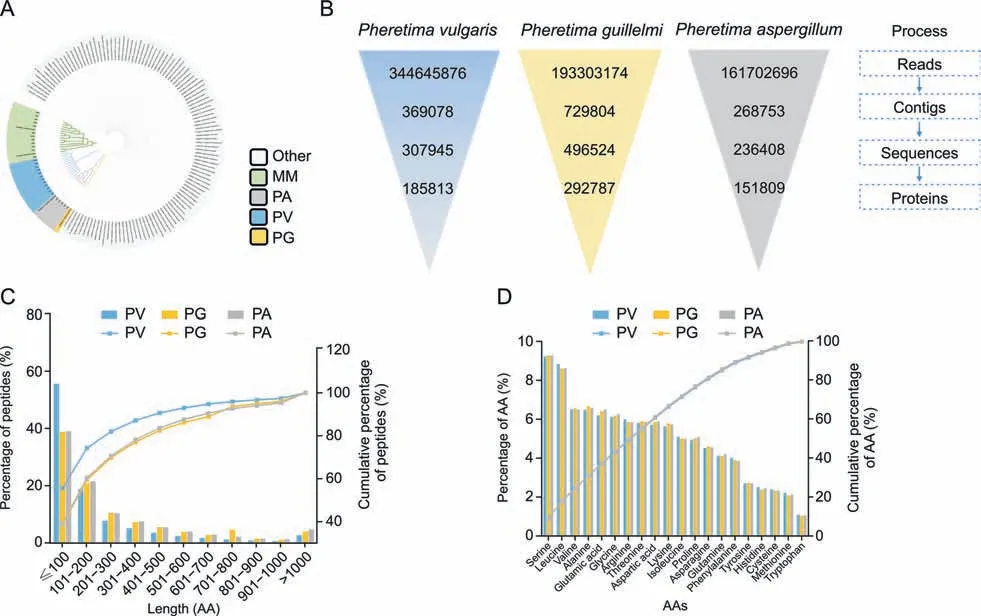
Fig.1. Database construction of Pheretima vulgaris (PV), Pheretima aspergillum (PA),and Pheretima guillelmi (PG).(A) Neighbor-joining (NJ) tree of the Amynthas and Metaphire species with commercial Pheretima samples based on the mitochondrial cytochrome C oxidase subunit I(COI)sequences.(B) Illustration of the database construction process.(C)Histogram of the protein length distribution of the three databases.(D) Histogram of the 20-amino acid (AA) composition of the three databases.MM: Metaphire magna.
3.1.2.Selection of databases and algorithms for natural peptide identification
Databases and algorithms are critical components of peptide identification in proteomic studies.In this study,three databases(PA,PV,and PG) and three sequencing algorithms (de novo,open search,and restricted search) were used to identify natural peptides in the three species.As shown in Fig.2A,three databases were used for peptide identification in the three sample groups.For PA,the highest number of peptides were identified in the PA database compared to the PV and PG databases,as well as the PV group.For MM,PA was the closest species according to the NJ tree (Fig.1A),and the PA database was the best match for peptide identification in MM(Fig.2A).Therefore,PA was selected as the database for the analysis of natural peptides from MM.These results suggest that for natural peptide identification,a database can be selected based on evolutionary proximity in the absence of a specific database.
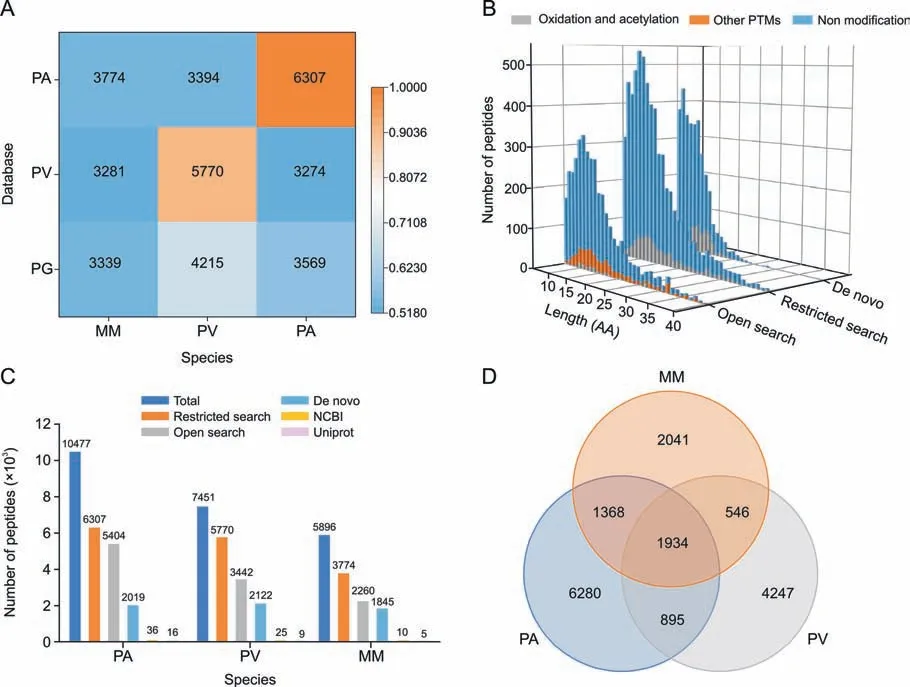
Fig.2. Determination of databases and algorithms for natural peptide identification.(A) Relevance of the databases for the different species based on the number of identified peptides.(B) Evaluation of the three algorithms for peptide identification using Pheretima aspergillum (PA) data with the PA database.(C) Comparison of different algorithms and databases for natural peptide identification.(D)Venn diagram showing the relationship and number of peptides in the three species.PV: Pheretima vulgaris;PG: P.guillelmi;MM:Metaphire magna;PTMs: post-translational modifications;AA: amino acid;NCBI: National Center for Biotechnology Information.
Multiple algorithms can enhance the prosperity of peptide sequence identification.Matching MS/MS spectra to a database via a restricted search has long been the dominant approach for peptide identification in shotgun proteomics [34,35].Open search improves peptide identification by expanding the search space,particularly for peptides with unexpected modifications [31].De novo sequencing of peptides directly from MS/MS spectra,without using a protein database,has been used to identify natural peptides in ginseng [24].Therefore,all these algorithms were extensively evaluated for natural peptide identification.As shown in Fig.2B,the restricted search identified the most peptides,while the open search covered a wider range of modifications.Compared to the database search,peptides derived from de novo sequencing were much shorter in length.Nevertheless,different algorithms have different advantages,and the combined application of these three algorithms provided a more complete characterization [36].
In this study,a strategy for integrating databases of close evolutionary relationships using three algorithms was applied for peptide identification.A total of 10,477,7,451,and 5,896 peptides were identified in PA,PV,and MM,respectively.This strategy demonstrated superior peptide identification compared to single algorithms and traditional databases(NCBI and UniProt databases)(Fig.2C).Among thesepeptides,approximately 80% hadasequencelengthdistribution of 6-20-mer (Fig.S3A),major charges of 2+and 3+(Fig.S3B),and major modifications of oxidation and acetylation(Fig.S3C).Furthermore,only 1,934 peptides were common to each species (Fig.2D),indicating a highly diverse peptidome among the three species.
To elucidate the differences between tryptic and natural peptides,the peptide profiles of both types were compared.As shown in Fig.S4A,although the amino acid length profiles of tryptic and natural peptides were similar,there were large differences in peptides,PTMs (Fig.S4B),and proteins (Figs.S4C-E).The unexpected differences in protein levels indicated the importance of natural peptide analysis,which could provide a complementary approach to mainstream proteomic analysis for a more comprehensive exploration of peptides and proteins in organisms.
3.2.Screening of signature peptides
3.2.1.Screening of potential biomarkers via label-free peptidomics analysis
Potential Pheretima biomarkers were screened via label-free peptidomics.PA,PV,and MM were classified into three separate clusters in the PLS-DA model,and the natural peptides showed good potential to discriminate these species (Figs.3A-D).In addition,both the correlation coefficient and VIP were used to screen for ions with significant differences.A total of 243 ions were obtained,of which 86 showed significant differences with interspecies ratios>10 or<1/10.Finally,a hierarchical clustering heat map demonstrated that PA,PV,and MM could be classified completely using these 86 ions (Fig.3E).
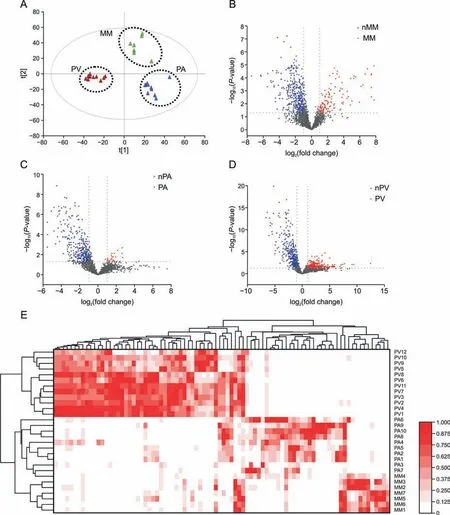
Fig.3. Identification of potential ion biomarkers in the three species via untargeted peptidomics.(A) Score plots of the projections to latent structures discriminant analysis(PLSDA)model for Pheretima aspergillum(PA)(n=10),Pheretima vulgaris(PV)(n=12),and Metaphire magna(MM)(n=7).(B-D)Volcano maps of 2,566 ions in the three species.(E)Clustered heat map of 86 potential ion biomarkers in the three species.nMM: non-MM species;nPA: non-PA species;nPV: non-PV species.
3.2.2.Screening of potential transition biomarkers via targeted peptidomics analysis
To increase the quantification accuracy,a targeted strategy utilizing the dMRM mode was used to analyze potential biomarkers.However,the conventional data-dependent acquisition mode was limited by the slow acquisition rate of the instrument,resulting in only 30 of the 86 compounds having corresponding MS/MS spectra.To overcome this problem,a precursor ion list acquisition approach was used to increase the coverage of the MS/MS spectra of the 86 potential biomarkers(Figs.4A and B).The two highest product ions were extracted,and multi-charged ions were infused using the inhouse software Pep-MRMer (Fig.4C).Additionally,the retention times of potential transition biomarkers were transferred from the high-resolution instrument to QQQ using a previously reported retention time calibration method[37].A dMRM method involving 570 ion pairs was obtained and run on QQQ and 372 transitions with good chromatographic peak patterns were manually checked.Subsequently,the collision energy of all the transitions was optimized at three levels:20,30,and 40 V(Fig.4D).Finally,dMRM was established by integrating the ion pairs,retention times,and optimized energies (Fig.4E).
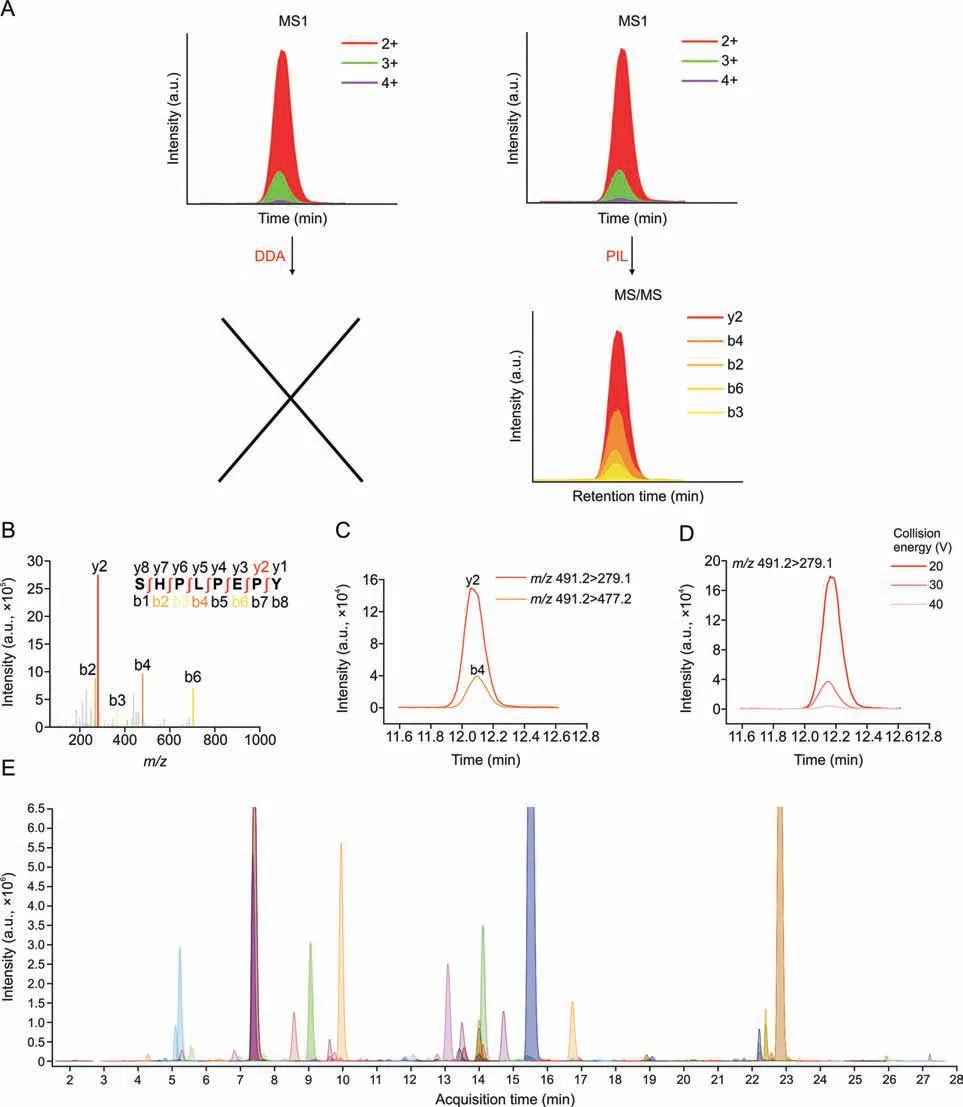
Fig.4. Construction of the targeted dynamic multiple reaction monitoring (dMRM) method for natural peptide profiling.(A) Schematic representation of the combination of traditional data-dependent acquisition (DDA) and precursor ion list acquisition (PIL) for MS/MS spectra of potential biomarkers.(B) MS/MS spectrum of a potential biomarker.(C)Selection of the two highest ion transitions of the candidates.(D)Optimization of the collision energy of the transition(m/z 491.2>279.1)with 20,30,and 40 V.(E)Extraction ion chromatogram of 372 ion pairs from the dMRM method.
3.2.3.Validation of the targeted methods
Methodological investigations of linearity,precision,and repeatability were conducted to evaluate the quantitative performance of the targeted dMRM method.The linearity of the 372 transitions was assessed usingR2values of the 210-fold gradientdiluted QC samples.As shown in Fig.S5A,>94% of the transitions had anR2>0.8,and >72% of the transitions had anR2>0.95.The repeatability and precision of the instrument were assessed by calculating the RSD.In this case,98% and 97% of the transitions had an RSD <20% (Figs.S5B and C).These results reflect the good quantification ability of the developed dMRM method(Supplementary Data).
Soon he agreed to “dangle,” sit on the side of the bed to build up sitting tolerance6, energy and balance. He agreed to “work” with physical therapy if I d return “to talk.”
3.2.4.Screening of transition biomarkers via targeted LC-MS/MS
For further screening of the transition biomarkers,36 batches of commercial Pheretima were quantified using QQQ6495 with ESIpositive ionization in the dMRM mode.The 372 transitions were filtered using the following criteria.First,the transitions could be presented stably with an intraspecific RSD ≤50%.Second,the area ratio of each transition between any two of the three species should be greater than 10.Consequently,55 species-specific transitions were retained for further screening.
3.2.5.Identification and validation of signature peptides
Of the 55 species-specific components,26 peptides were identified using the aforementioned integrated strategy.The accuracy of natural peptide characterization is influenced by several factors,such as PTMs,database richness,and co-elution interference.Therefore,to validate the peptide identification accuracy,five peptides were selected and synthesized with the following limitations.First,multi-charged states were confirmed in the MS1scan to eliminate the interference of fragment ions.Second,peptides with chimeric spectra and co-eluted peptides were excluded [38].Third,peptides with misidentified charges were excluded.Fourth,isotopic patterns of the peptides should show good regularity.Fifth,the fragment ions should be in good agreement with the b and y ions.In total,2,2,and 1 signature peptides with excellent specificity were selected and solid-phase-synthesized for PA,PV,and MM,respectively(Table 1 and Fig.5).Furthermore,the MS/MS and retention times of all five synthetic peptides were in good agreement with those of the QC sample compounds,demonstrating that the peptides were correctly identified.
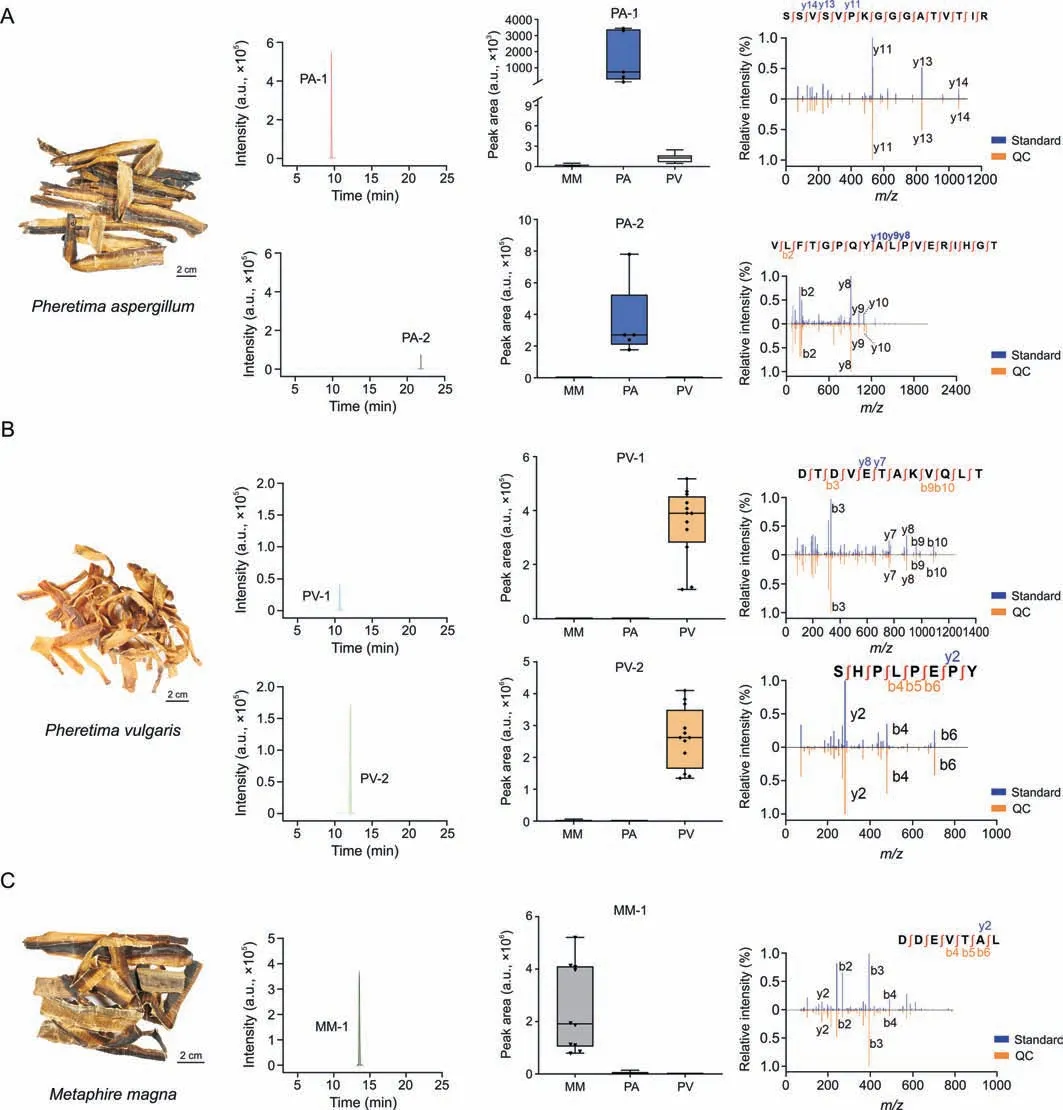
Fig.5. Fingerprint spectrum of the signature peptides in the three species and their specificity.(A) Signature peptide fingerprint spectrum of Pheretima aspergillum (PA) and specificity of PA-1 and PA-2,which was validated using synthetic peptides.(B) Signature peptide fingerprint spectrum of Pheretima vulgaris(PV) and specificity of PV-1 and PV-2,which was validated using synthetic peptides.(C) Signature peptide fingerprint spectrum of Metaphire magna (MM) and specificity of MM-1,which was validated using synthetic peptides.QC: quality control.
3.3.Identification of pheretima species in CPMs
The specificity of the signature peptides was further validated by mixing any two of the three species at different concentrations,including 99:1,90:10,80:20,70:30,60:40,50:50,40:60,30:70,20:80,and 10:90.As shown in Figs.6A-D,the signature peptides were proportional to the sample content of the corresponding species.The ratio of sample percentages to peak areas of the five signature peptides showed excellent correlation coefficients,indicating robust specificity.Interestingly,low levels of adulteration were detectable,even at the 1% level,demonstrating the high sensitivity of this method.
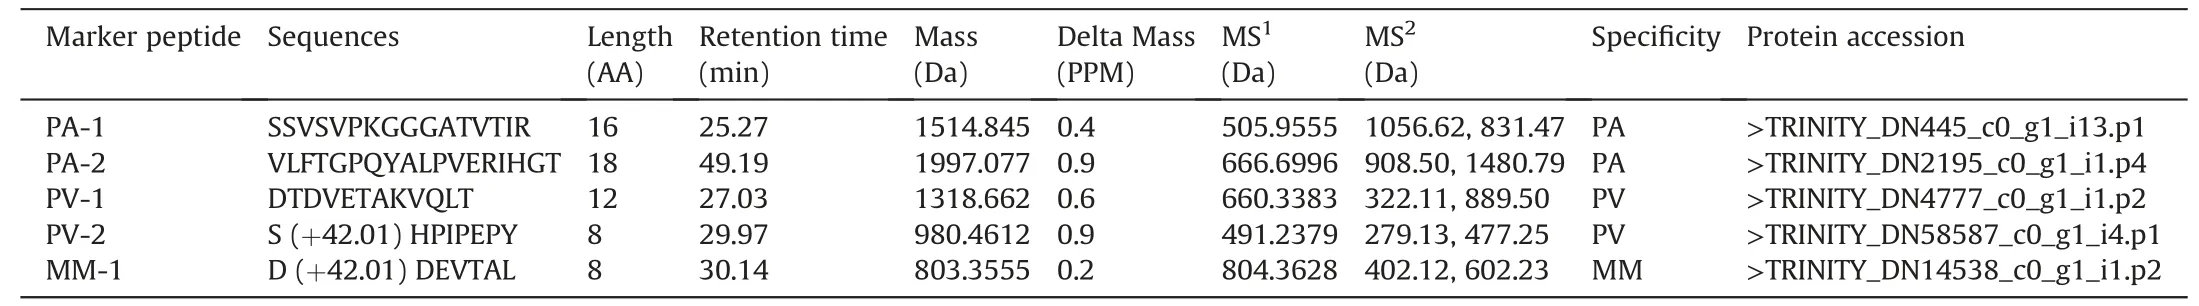
Table 1 The information of five synthetic species-specific peptides.
Signature peptides were used to authenticate the Pheretima species used in the BHCs and XHLs(Table S3).As shown in Fig.6E,PV-2 was detected in all six BHC batches,suggesting that PV was used in BHCs.However,the zoological origins of Pheretima in XHLs were diverse,with one batch containing PV-2,two batches containing MM-1,and the rest not containing any of the five signature peptides,suggesting that the Pheretima species used in commercial XHLs were inconsistent and unstandardized.A possible explanation may be that all XHL batches were produced by different manufacturers.
Fig.6. Verification and application of the signature peptides.(A-C) 3D waterfall plot of the peak area of the signature peptides detected using the dynamic multiple reaction monitoring (dMRM) method for different ratios of Pheretima vulgaris (PV)/Pheretima aspergillum (PA),PA/Metaphire magna (MM),and PV/MM,respectively.(D) Correlation coefficients of the ratio of sample percentages to peak areas of the five signature peptides.(E) Fingerprint spectrum of the signature peptides of Brain Heart capsules (BHCs) (n=6)and Xiaohuoluo pills (XHLs) (n=4) detected using the dynamic multiple reaction monitoring (dMRM) method.CPMs: Chinese patent medicines.
4.Conclusion
In this study,a strategy was developed for the sequencing of natural peptides in three Pheretima species,with particular emphasis on the PV and MM species that had poorly annotated protein databases.This strategy integrated an in-house annotated protein database constructed from closely related RNA-seq data from public archival resources with various sequencing algorithms,including restricted,open search,and de novo sequencing.A total of 10,477,7,451,and 5,896 peptides were identified in PA,PV,and MM samples,respectively.Our strategy demonstrated a significant improvement over standard peptide identification.To reveal the inherent differences in natural peptides among the three commercially available Pheretima species,label-free and targeted peptidomics were developed.From thousands of ions,55 transitions were selected as potential biomarkers for classifying the three species.Of these,26 transition biomarkers matched peptide sequences and 5 peptide biomarkers were confirmed via chemical synthesis.The peptide biomarkers showed robust specificity and good potential for determining the zoological origins of Pheretima in CPMs,such as BHCs and XHLs.The results revealed that the sources of Pheretima in XHLs were not only ChP-recorded species(PV) but also non-ChP-recorded species (MM),even in samples with no identified signature peptides.This indicates a chaotic market for XHLs that poses a great threat to their safety and efficacy.
In conclusion,the integrated method developed in this study not only successfully analyzed the challenging natural peptides in Pheretima but could also pave the way for the analysis of natural peptides in other animal-derived drugs,particularly for species with poorly annotated protein databases.
CRediT author statement
Xiaoxiao Luo:Writing -Original draft preparation,Investigation,Data curation,Formal analysis;Qirui Bi:Conceptualization,Methodology,Data curation,Writing -Reviewing and Editing;Dongdong Huang:Investigation,Software,Data curation;Yun Li:Data curation,Formal analysis;Changliang Yao,Jianqin Zhang,Wenlong Wei,Jiayuan Li,Zhenwei Li,andJingxian Zhang:Formal analysis;Shen JiandYurong Wang:Writing -Reviewing and Editing;De-an Guo:Supervision,Conceptualization,Project administration,Writing -Reviewing and Editing,Funding acquisition.
Declaration of competing interest
The authors declare that there are no conflicts of interest.
Acknowledgments
This work was financially supported by the Key Program of the National Natural Science Foundation of China (Grant No.:82130111);the National Natural Science Foundation of China(Grant No.:81803716);the Qi-Huang Chief Scientist Project of the National Administration of Traditional Chinese Medicine,China(2020);and the SIMM-SHUTCM Traditional Chinese Medicine Innovation Joint Research Program,China (Grant No.:E2G809H).
Appendix A.Supplementary data
Supplementary data to this article can be found online at https://doi.org/10.1016/j.jpha.2023.06.006.
 Journal of Pharmaceutical Analysis2023年9期
- Journal of Pharmaceutical Analysis的其它文章
- CLDN18.2-targeted molecular imaging and precision therapy of gastrointestinal tumors
- Applications and safety of gold nanoparticles as therapeutic devices in clinical trials
- Metabolomics: A useful tool for ischemic stroke research
- 1,8-cineole ameliorates colon injury by downregulating macrophage M1 polarization via inhibiting the HSP90-NLRP3-SGT1 complex
- Ginsenoside Rk2,a dehydroprotopanaxadiol saponin,alleviates alcoholic liver disease via regulating NLRP3 and NLRP6 inflammasome signaling pathways in mice
- Quantification of soluble epoxide hydrolase inhibitors in experimental and clinical samples using the nanobody-based ELISA