
Detection of healthy and pathological heartbeat dynamics in ECG signals using multivariate recurrence networks with multiple scale factors
2023-11-02 08:08LuMa马璐MeihuiChen陈梅辉AijunHe何爱军DeqiangCheng程德强andXiaodongYang杨小冬
Chinese Physics B 2023年10期
Lu Ma(马璐), Meihui Chen(陈梅辉), Aijun He(何爱军),Deqiang Cheng(程德强), and Xiaodong Yang(杨小冬),†
1School of Information and Control Engineering,China University of Mining and Technology,Xuzhou 221116,China
2Suzhou Vocational and Technical College,Suzhou 234000,China
3School of Computer Science and Technology,China University of Mining and Technology,Xuzhou 221116,China
4School of Electronic Science and Engineering,Nanjing University,Nanjing 210023,China
Keywords: electrocardiogram signals,multivariate recurrence networks,cross-clustering coefficient entropy,multiscale analysis
1.Introduction
The human cardiac system,as a typical complex system,has non-stationary and nonlinear characteristics.The electrocardiogram(ECG)is a non-invasive and efficient approach that has been adopted clinically to diagnose heart-related diseases.The analysis of traditional nonlinear time series has made great progress since the 1980s,[1]such as Lyapunov exponents,[2-4]entropy,[5-7]fractal dimensions,[8-10]etc.The transformation of a time series into a complex network has drawn much attention to its topological structure and the dynamic behavior of the system.[11]For instance, Zhang and Small[12]mapped the pseudo-periodic time series into a complex network,where each cycle represented a node of the network and the connectivity was determined by related parameters between periods,such as phase space distance,linear correlation coefficient,[13]etc.Xuet al.[14]proposed to apply the theory of phase space reconstruction to map the points in the phase space as nodes in the complex network,and the edge depended on the phase space distance of points.Lacasaet al.[15]declared that they combined visibility graphs with complex networks.On the basis of the recurrence plot,[16]Donneretal.[17]introduced the concept of the recurrence network.During the construction of the transition network taken by Sunet al.,[18]a class represented one node, and the weighted edge was determined by the transition probability between any two classes.
The recurrence plot is a versatile and reliable method that has been extensively used to graphically represent the recurrence dynamics in time series data, which characterizes the proximity of two states in the time-delay reconstructed state space of a dynamical system.Because the recurrence of trajectories in phase space is one of the most important fundamental features of dynamical systems, consequently, the recurrence network method has been successfully applied to evaluate the dynamic behavior of real systems, such as climate,[19,20]the cardiac system,[21,22]electroencephalogram signals,[23,24]etc.However, when the number of time series is greater than 2,the relationship between the time series cannot be portrayed.In order to overcome this issue, Gaoet al.[25]constructed a multivariate recurrence network to evaluate the dynamic characteristics of the two-phase flow.Gaoet al.[26]also mapped the multivariate time series to the multivariate multiscale recurrence network in order to further study the internal characteristics of the two-phase flow.In recent years,multivariate recurrence networks[27-29]have been adopted to explore the complex dynamic behavior of multivariate time series.Erogluet al.[30]put forward a different method to construct multivariate recurrence networks, which compare the similarities and differences between time series.Xuet al.[31]applied multivariate recurrence networks to analyze the information linkages between carbon and energy markets.
Coronary heart disease is a common heart system disease.Due to the spatial inhomogeneity of the heart tissue and the anisotropy of the electrical signal propagation in the heart, a single lead ECG signal cannot adequately characterize the entire cardiac system.Therefore, to fully investigate the effects of age and pathological heartbeat dynamics on the entire cardiac system,we propose a novel method to analyze multivariate time series based on multivariate recurrence networks.In the experiment, the multivariate time series, namely the synchronous 12-lead time series of healthy subjects and individuals diagnosed with coronary artery disease,are coarsely granularized and constructed as the corresponding multivariate recurrence network.Next,we calculate the cross-clustering coefficient entropy of multivariate recurrence networks and obtain the optimal scale by comparing the difference between different groups.The method of one-way analysis of variance(ANOVA) is adopted to explore the distinction between different groups at each lead on the optimal scale.Finally, to further investigate the structural changes and internal characteristics of ECG signals in healthy and coronary artery disease subjects,we construct weighted networks and calculate the parameters.Through setting the parameters as features of the SVM,the classification accuracy of the ECG signals recorded from healthy subjects and myocardial infarction is 94.1%and 95.58%on two datasets,respectively.
2.Theory
2.1.Recurrence networks and cross recurrence networks
Recurrence networks have been proposed by Donneret al.[17]to map recurrence plots to complex networks.The basic construction steps of a recurrence plot are as follows:First,take the time seriesx(t)(t=1,2,...,n)and transform it into a phase-space vectorx(t)using the embedding theory[32]
wheremrepresents the embedding dimension andτdenotes the delay time.Empirically,mandτare chosen as 2 and 1 in this paper.

Fig.1.Construction of a recurrence plot and a cross recurrence plot using a healthy elderly person’s ECG time series as an example: (a)the V1 lead time series,and the subgraph below(a)is the recurrence plot constructed by the V1 lead time series;(b)the V1 and the V2 lead time series,and the subgraph below(b)is the cross recurrence plot constructed by the V1 and V2 lead time series,where m=2,τ =1,and ε is set as 15%of the standard deviation of the time series.The black dots and yellow dots in the recurrence plot and cross recurrence plot represent recurrence and non-recurrence at the corresponding positions,respectively.
The phase-space distance of any two phase-space vectors is calculated in terms of the maximum norm.Compared to the Euclidean norm, the maximum norm is computationally faster and allows the study of some features of recurrence plots analytically.[16]
The recurrence plot is denoted by the recurrence matrix as follows:
whereΘ(·)is the Heaviside function,Θ(x)={1|x >0; 0|x ≤0}, andεis the threshold.The selection of the threshold is a critical operation that can easily affect the results.The core criterion for choosing a threshold is the power in signal detection that threshold yields.[33]Therefore, several threshold selection techniques have been proposed.[34-38]For the sake of consistency, we always use the standard deviation of the time series in this work.[16,37]It is worth pointing out that we set the threshold at 15%of the standard deviation of the time series in our study.
In contrast to recurrence plots, cross recurrence plots[39]measure the recurrence relationship between two different time series,and the cross recurrence matrix is represented as
wherey(b) represents the phase-space vector constructed by other time seriesy(t) (t=1,2,...,n).We use the methods provided in the tool[40]to obtain the recurrence plot and cross recurrence plot, which are shown in Fig.1.The recurrence plot is constructed from the V1 lead time series of a healthy elderly person and the cross recurrence plot is obtained from the V1 and V2 leads of the same person in Fig.1.
The adjacency matrixAof a recurrence network is obtained from the recurrence matrixRauto:
whereδa,bis the Kronecker delta function that is introduced to avoid artificial self-loops in the recurrence network (δa,b=1 ifa=b, otherwiseδa,b=0).The adjacency matrixAof the cross recurrence network is the cross recurrence matrixRcrossof the corresponding cross recurrence plot.
2.2.Multivariate recurrence networks

whereNpdenotes the number of nodes in the recurrence networkp.
In order to explore the intrinsic characteristics of the cardiac system,according to information entropy,we propose the novel concept of cross-clustering coefficient entropy,which is calculated by
where(i) denotes the local cross-clustering coefficient of nodei,andrepresents the cross-clustering coefficient entropy of recurrence networkpabout recurrence networkqBy calculating the cross-clustering coefficient entropy of the recurrence network in multivariate recurrence networks with different scale factors,the variation of the nonlinear dynamic characteristic of ECG signals between healthy subjects and patients is analyzed.
2.3.Weighted networks
The multivariate recurrence network not only quantifies the variation within time series but also explores the correlation between time series through adjacency matricesRM(Mdenotes the number of time series).In our study,we consider each time series as a node,and the weight of the edge between two nodes is the mean of the cross-clustering coefficient entropy of the recurrence network constructed by relevant time series.The formula is as follows:
where ¯Ep,qdenotes the weight of edge between nodesp,qTherefore, we get a fully connected and weighted network.The introduction of a weighted network[41]simplifies the description of the adjacency matrixRMintoM×M,which reduces the size of the matrix.Figure 2 shows the process of converting multivariate time series to a multivariate recurrence network and weighted network when the number of time series is 3.
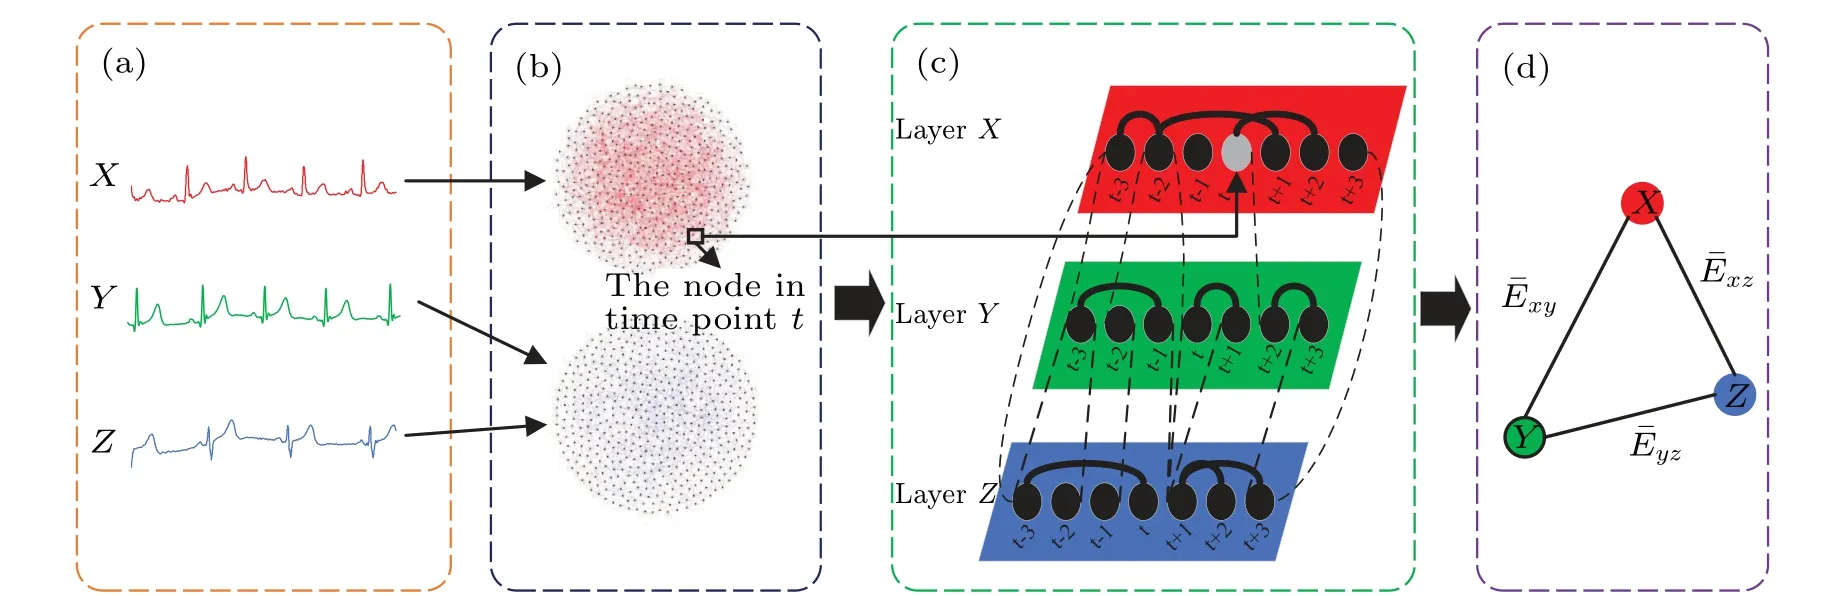
Fig.2.Illustration of the steps from a multivariate time series to a weighted network(the number of time series is 3,M=3).(a)Multivariate time series X,Y and Z,(b)recurrence network constructed by the time series X (upper)and cross recurrence network constructed by the time series Y and Z (lower), (c)multivariate recurrence network(take the nodes corresponding to time points near time point t),and(d)weighted network.In subplot(c),the solid lines indicate the intra-layer links and the dotted line represents the inter-layer connections.The node whose color is gray in layer X is the same node in time point t in the recurrence network in subplot(b).The connections between nodes near the time point t in the cross recurrence network in subplot(b)correspond to the connections between layer Y and layer Z in subplot(c).
In addition, the quantification of weighted networks is a well-established method.[42]In this paper, we adopt the average weighted path length(AWPL)and graph energy(GE)[43]to characterize the weighted networks.The equation for the AWPL is as follows:
whereMis the set of nodes (layers of the multivariate recurrence network) in the weighted network,nrepresents the number of nodes andd(α,β)represents the weighted shortest path length, defined as the minimum value of the sum of the weights among all the paths from nodeαto nodeβ.[44]The equation of the GE is as follows:
whereλidenotes the eigenvalues of the adjacency matrix of the weighted network, andnrepresents the number of eigenvalues.
3.Experiments
3.1.Dataset 1
The ECG data applied in this experiment were carefully obtained from the Cardiovascular Medicine Department of Shanghai Changzheng Hospital.[45]The experimental subjects include four groups, i.e., healthy young (HY), healthy old(HO), myocardial ischemia (IO), and myocardial infarction(MI).In order to exclude the effect of other diseases on the experimental results,patients only suffer from one single disease.Healthy old people have normal blood pressure and no history of heart disease,and healthy young people have sinus rhythm.Among them, there are 40 cases of healthy young people (mean age±standard deviation: 22.00±0.00 years),23 cases of healthy old people (mean age±standard deviation: 67.13±17.13 years), 42 cases of myocardial ischemia(mean age±standard deviation: 68.03±15.03 years),and 11 cases of myocardial infarction (mean age±standard deviation: 59.00±18.21 years).
The NHE-2000 multi-functional electrocardioworkstation developed by the Biomedical Electronics Research Institute of Nanjing University is adopted.This device is able to detect and display frequency components higher than 100 Hz (i.e., 0.1-2 kHz).Figure 3 depicts the 12-lead ECG waveform of a healthy elderly person captured by the NHE-2000 multi-functional electrocardio-workstation.As has been reported in some literature,[46,47]coronary artery disease is accurately identified by high-frequency ECG(HFECG,whose frequency components are 0.02 Hz-2 kHz compared to routine ECG(0.05-100 Hz)).The standard ECG displays waveforms within the 0.05-100 Hz portion of the spectrum.[48]The standard 12-lead ECG records potential differences between prescribed sites on the body surface that reflect differences in transmembrane voltages in myocardial cells that occur during depolarization and repolarization within each cycle.[49]ANSI/AAMI affirmed that the low-frequency cutoff is 0.05 Hz for standard 12-lead ECGs.[50]A high-frequency cutoff of 100 Hz was considered adequate by the AHA in 1975 to maintain diagnostic accuracy during visual inspection of direct-writing tracings by electrocardiographers.[51]In our equipment, the lowest frequency is 0.02 Hz and the highest frequency is 2 kHz.The similarity is that a 12-lead approach to signal acquisition is taken.
The detection system has features such as wide frequency response and high sensitivity.Each single datum is denoted by 2 bytes (the highest 4 bits are set to zero) and the resolution of the data is 12 bits.Before the data are collected, the subjects lie down in a completely relaxed body position for several minutes.The next step is to first amplify the ECG signals, which are then transmitted to a special AD sample card located in the workstation with 1 kHz sampling rate per channel.In a time duration of about 1 min, as with routine ECG,the data are acquired at 12 different positions of the subject’s body,with each lead corresponding to a different location and containing about 60000 data points.The first 1000 points of the data are deleted in order to reduce the influence of errors,and each lead selects 5000 points for subsequent calculations.
3.2.Dataset 2
On the other hand, we use the PTB Diagnostic ECG Database from Physionet[52]to validate the effectiveness of the method.In total, data from 231 subjects are applied in our analysis,52 of which are healthy(HC),and rest of which are from one of three diseases: bundle branch block (BBB,14),myocardial infarction(MI,148),or cardiomyopathy/heart failure(CF,17).Each record consists of mostly 60 s duration,sampled at 1000 Hz(60000 points),and 15 lead ECG signals.In our study, the remaining standard 12 leads of each record are selected except for theVx,VyandVzleads.Similarly,starting at the 1001st point,we choose 5000 points to analyze the difference.

Fig.3.The 12-lead signals collected by a high-frequency ECG from a healthy elderly person from dataset 1,where the number of every lead is 5000.The data have been normalized in this figure.
4.Analysis and results
4.1.Multiscale analysis
Coarse-grain processing of time series was proposed by Costaet al.[53]The original time series can be constructed as a shorter time series,and redundant information can be removed while extracting the basic time series features.For the given time series:x(t) (t=1,2,...,N) (Ndenotes the number of elements in the time series), new time series are obtained by coarse granulation at different scale factorse
whereerepresents the scale factor,1≤j ≤N/e.
To obtain new coarse-grained time series,the scale factors selected in this paper are from 1 to 20.Then multivariate recurrence networks are constituted and the cross-clustering coefficient entropy of the multivariate recurrence networks is calculated.Figure 4 shows the results,in which the D-value represents the difference in ACCE(average cross-clustering coefficient entropy)from two groups at the same scale.In Fig.4,we observe two different types of behaviors: (1) The ACCE measure for time series derived from HY and HO monotonically decreases.(2)The value of ACCE for time series derived from IO and MI decreases when the time scale varies from 1 to 10, then stabilizes at a constant value.Therefore, the optimal scale is obtained at scale 10.It is also found through experiments that the length of data has no effect on the selection of scale.From Fig.4(a), we find that for all time scales,a higher value of ACCE is assigned to time series from young subjects.From a physiological point of view, the nonlinear dynamic characteristics of the human heartbeat signal may decrease as people get older.The conclusion that age affects the dynamical characteristics of complex systems is verified.[54,55]The complexity of the cardiac system is at its lowest in MI patients because of coronary artery occlusion and interruption of blood flow in patients with coronary heart diseases,leading to necrosis of part of the myocardium due to severe and persistent ischemia.Therefore, we obtain the result that cardiovascular disease can have an impact on complexity dynamics.[56]
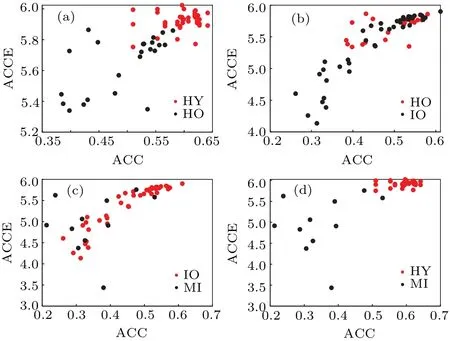
Fig.5.Joint distribution of ACC and ACCE at optimal scale factor 10.(a)Difference in ACCE of HY and HO subjects.(b)Difference in ACCE of HO and IO subjects.(c)Difference in ACCE of IO and MI individuals.(d)Difference between the ACCE of HY and MI individuals.
For further verification,we calculate the cross-clustering coefficient for four different groups in scale 10.As we can see, Fig.5 shows the joint distribution of the average crossclustering coefficient(ACC)and the ACCE with a scale factor of 10.IO cannot be well distinguished because their hearts are less damaged and are similar to those of healthy elderly people.At the same time, it can be seen that the crossclustering coefficient entropy is indeed capable of distinguishing between the HY and MI.
4.2.Multivariate recurrence networks
The 12-lead ECG signals of subjects are coarsely granulated at the optimal scale factor of 10 and first constructed to a multivariate recurrence network.In order to better demonstrate the changes of each lead under different physiological states, the cross-clustering coefficient entropy is calculated.Similarly,the above operations are performed for all samples in the four categories.
Tables 1 and 2 show the mean value and standard deviation of the cross-clustering coefficient entropy of the same channel between different persons.Statistically, the ACCE of all leads in patients with MI, a life-threatening condition,are at the lowest magnitudes.At the same time, the ACCE for each lead is slightly higher in HO than in patients with IO.This possibly suggests that,although myocardial ischemia may cause some functional degradation to the heartbeat system and reduce the nonlinear complexity of the ECG signal to some degree,it is still in an early stage and not serious enough to cause damage to the dynamical system or even change its structure physically.[57]HY has the highest values of all leads.
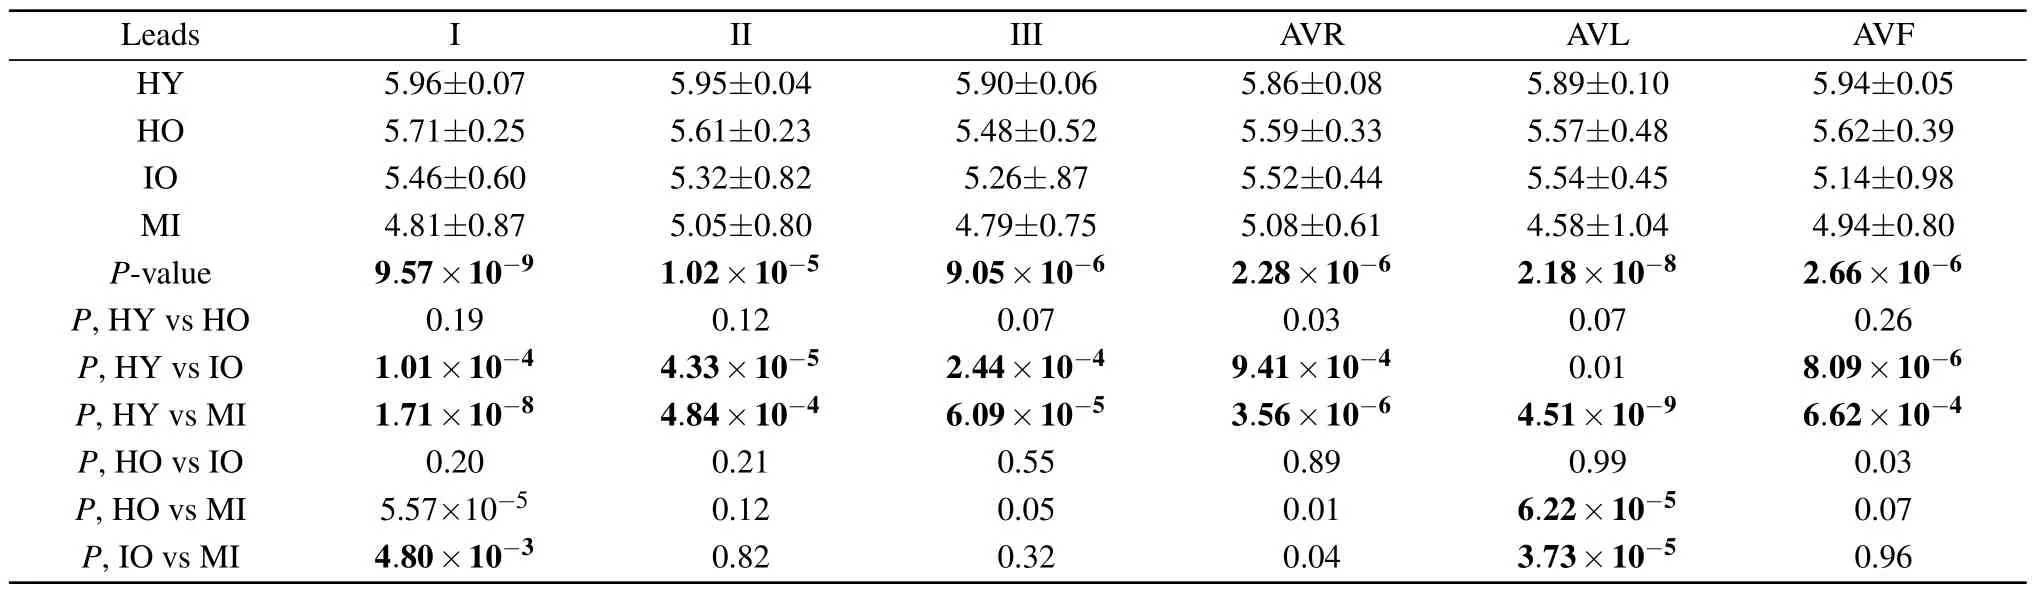
Table 1.Cross-clustering coefficient entropy for 12-lead of different groups(limb leads).

Table 2.Cross-clustering coefficient entropy for 12-lead of different groups(chest leads).
Moreover,ANOVA and post-hoc are applied to assess the statistical group differences in the topological characteristics of multivariate recurrence networks for four groups.ThePvalue is considered statistically significant if it is less than 8.33×10⁻³after Bonferroni correction.As we can see, thePvalue of ANOVA for all leads is far less than 8.33×10⁻³.This indicates that the cross-clustering coefficient entropy can effectively differentiate between healthy individuals and patients.From the post hoc results, compared to HY, the V2 chest leads in HO are affected.At the same time,we find that the distinction between HO and IO is not very effective.Moreover, compared with IO and HO, the I and AVL leads in the limb leads and the V4 and V5 leads in the chest leads of the MI produce relatively large changes.
After analyzing the adjacency matrix of the multivariate recurrence network, the weighted network is constructed.In Fig.6, we present the weighted networks of the HY subjects and MI subjects.In order to describe more clearly the changes in the status of the cardiac system in these four groups, the network parameters of the weighted network constituted by the four groups are calculated: the AWPL and GE.The results are shown in Fig.7.As we can see from Fig.7,the AWPL and GE of HY are at the highest values, while the HO group and patients with IO are in the middle due to age and cardiovascular disease,respectively.Patients with MI have the smallest values due to the severe damage to the myocardium and the possible alteration of the heart’s structure.

Fig.6.Fully connected, undirected, and weighted network of (a) HY subjects and(b)MI subjects.Each black circle represents a node, and each orange line indicates an edge.The width of the edge is proportional to the size of the weight of the edge.The I-AVF are the names of limb leads,and V1-V6 are the names of chest leads.
4.3.Comparison with other studies
The same steps are applied to dataset 2 to verify the validity of the method in this paper.We first need to calculate the cross-clustering coefficient entropy for multivariate recurrence networks with scales between 1 and 20,and compare the differences between the average cross-clustering coefficient entropy for any different pair of groups at each scale.If all the differences are the largest on the same scale,then the definite scale is the optimal scale.If the differences reach the maximum at different scales,the scale with the larger difference is chosen as much as possible.We calculate and compare to find the optimal scale 2 for dataset 2.Figure 8 shows the results of the AWPL and GE at a scale factor of 2.As we can see, two parameters,namely the AWPL and GE,are at their maximum for HC.Compared to healthy individuals,the subjects of BBB have lower AWPL and GE.The reason for this is that the information capacity of BBB ECG signals reduces,the complexity is reduced,and more physiological adaptations are lost to the lesser adaptive capacity inside and outside the heart.[58]
On the one hand, patients with BBB do not have other associated heart diseases.Patients with BBB, on the other hand, have slightly smaller parameters than healthy people.The type of BBB may be RBBB, which is generally considered benign.[59]As we can see,two parameters of patients diagnosed with MI or CF are in the lowest position.We consider that it is possible that alterations in cardiac structure have led to a reduction in the complexity and nonlinear dynamic characteristics of the cardiac system.

Table 3.Comparison between the accuracies of this method and the other published results between healthy and myocardial infarction.
The parameters of the weighted network serve as the input for the features of the SVM,[65]which are the AWPL and GE.It is a linear classification method.To solve the issues of overfitting and sample imbalance,we adopt stratified ten-fold cross-validation.This splits the data into ten folds,where the original ratio of samples is preserved.Each fold acts once as the test split,while the remaining data act as the training data.This allows the models to retain reliable estimates on unseen data.The accuracy of the classification of healthy people and MI is illustrated in Table 3.Compared with the method in the literature,[60]only two parameters are applied in our study.In contrast to other methods, our approach achieves high accuracy.
5.Conclusion and perspectives
The investigation of typical nonlinear complex systems like the heart system has been a hot topic of research.Combining recurrence phenomena in heartbeat dynamics with complex networks provides an idea for analyzing the nonlinear dynamical characteristics of the cardiac system.In this paper, we construct multivariate recurrence networks and perform multiscale analysis on them.Meanwhile,the concept of cross-clustering coefficient entropy is innovatively proposed to achieve a distinction between healthy subjects and coronary heart disease patients.The results show that the complexity of ECG signals decreases in elderly people compared with young people due to the weakening of cardiovascular functions with age.The conclusion that age affects the dynamical characteristics of complex systems is verified.[54,55]On the other hand, the ECG signals of subjects with myocardial ischemia and myocardial infarction have lower complexity due to the fact that patients may have narrowed or blocked coronary vessels.This is consistent with the literature.[57]At the same time,we get 94.1%and 95.58%accuracy in two datasets between healthy subjects and persons diagnosed as myocardial infarction.Therefore, this method can effectively detect changes in cardiac disease status,which can provide ideas for the diagnosis of heart-related diseases.
The multivariate time series describes the internal characteristics and state changes of the cardiac system more adequately than a single time series.By constructing multivariate recurrence networks, we can explore the nonlinear dynamic characteristics of the complex system, which can be applied to different fields in the real world,such as paleoclimatology,neuroscience, economics, etc., and provide new ideas to investigate the dynamical properties and different state transitions of the system.However, when the number of time series in the complex system being applied becomes large, the adjacency matrix corresponding to the multivariate recurrence network becomes too large and the computational complexity increases.In addition, gender may also be a factor affecting the cardiac system, and we will also explore the differences in the cardiac system between different genders in our future studies.
Acknowledgements
Project supported by the Xuzhou Key Research and Development Program (Social Development) (Grant No.KC21304) and the National Natural Science Foundation of China(Grant No.61876186).

- Chinese Physics B的其它文章
- Single-qubit quantum classifier based on gradient-free optimization algorithm
- Mode dynamics of Bose-Einstein condensates in a single-well potential
- A quantum algorithm for Toeplitz matrix-vector multiplication
- Non-Gaussian approach: Withstanding loss and noise of multi-scattering underwater channel for continuous-variable quantum teleportation
- Trajectory equation of a lump before and after collision with other waves for generalized Hirota-Satsuma-Ito equation
- Rucklidge-based memristive chaotic system:Dynamic analysis and image encryption