
3D fluid model analysis on the generation of negative hydrogen ions for negative ion source of NBI
2023-11-16 05:38SiyuXING邢思雨FeiGAO高飞YuruZHANG张钰如YingjieWANG王英杰GuangjiuLEI雷光玖andYounianWANG王友年
Plasma Science and Technology 2023年10期
Siyu XING(邢思雨),Fei GAO(高飞),∗,Yuru ZHANG(张钰如),Yingjie WANG(王英杰), Guangjiu LEI (雷光玖) and Younian WANG (王友年)
1 Key Laboratory of Materials Modification by Laser, Ion, and Electron Beams (Ministry of Education),School of Physics, Dalian University of Technology, Dalian 116024, People’s Republic of China
2 Southwestern Institute of Physics, Chengdu 610225, People’s Republic of China
Abstract
Keywords: negative hydrogen ion sources, China Fusion Engineering Test Reactor, threedimensional fluid model
1.Introduction
The raw materials for nuclear fusion are isotopes of hydrogen,i.e.deuterium and tritium, which have the largest reaction cross section and can release huge amounts of energy.Since ohmic heating cannot alone attain the temperature required for fusion, various auxiliary heating mechanisms, such as NBI(neutral beam injector)heating,are needed to heat the plasma to its ignition temperature [1].Obtaining an energetic neutral beam is important in an NBI system.At energies above 100 eV amu−1,the neutralization efficiency of positive ions is not sufficient [2, 3] and an RF NHIS (radio-frequency negative hydrogen ion source) has been adopted at the CFETR(China Fusion Engineering Test Reactor)to generate negative ion beams.
Over the past few years, significant progress has been achieved in the global modeling of RF NHIS[4-8].Gaboriau and Boeuf systematically investigated the evolutions of the particle density and temperature with power and pressure,and gas depletion was taken into account by resolving the H heating equation[4].Huh et al studied the density of H−and other species under different electron energy distributions,and they observed that the plasma properties exhibited good agreement with experimental measurements when employing a bi-Maxwellian distribution[5].Yang et al presented a fairly comprehensive benchmark to validate the Global Model for Negative Hydrogen Ion Sources [6] and then developed a reduced linear model that could perform the VDF(vibrational distribution function) with high computational efficiency [7].Recently,Zhang et al grouped the vibrationally excited states of hydrogen molecules in order to simplify the chemical reaction set and concluded that this strategy could greatly reduce the computational cost of producing highly accurate estimates of negative hydrogen ion density [8].
Since the spatial distributions of plasma properties are very important for a deeper understanding of an NHIS, fluid models are also necessary.Paunska et al employed 1D (onedimensional)and 2D(two-dimensional)fluid models to study the density distributions of charged particles and vibrational molecules in hydrogen discharges, and they found that when the radius of the reactor was small,negative ions accumulated considerably in the discharge center [9, 10].Hagelaar et al analyzed the evolution of the plasma parameters with discharge conditions by combining a 2D fluid model with an electromagnetic field solver and their results showed that the neutral gas temperature varied with power and pressure [11].By enriching the chemical processes involved, Boeuf et al revealed that plasma density gradually saturated as power increased [12].Subsequently, Boeuf et al compared the electron temperature obtained in cases with and without a magnetic filter and concluded that the introduction of a magnetic filter reduced the electron density and temperature in the expansion region [13, 14].In addition, Lishev et al pointed out that the magnetic field penetrating through the driver volume became stronger if the magnetic filter was moved upwards and away from the expansion region,and this resulted in significant plasma asymmetry[15,16].Wang et al employed a 3D (three-dimensional) fluid model to simulate hydrogen discharges in a reactor with a cylindrical driver region and a rectangular expansion region, and the effects of magnetic filter,pressure,power and magnetic shielding on the plasma properties were studied [17].
Despite the NHIS being examined through various models, there remain certain inadequacies that need to be addressed.In a single-driver NHIS prototype, the plasma is generated in a cylindrical driver region and then diffuses into a rectangular expansion region.In addition, a magnetic filter,which causes substantial asymmetry, is included in the expansion chamber.In this two-chamber structure, a 3D model is required to describe the discharge characteristics more accurately.However, due to the computational burden,multi-dimensional simulations of the NHIS are limited.In addition, the chemistry set is usually simplified in the fluid model and the H−ion reactions are usually excluded [17].Since the generation of H−ions is one of the key issues in an NHIS, it is necessary to establish a multi-dimensional fluid model with H−ions taken into account in a self-consistent manner.Therefore, to study the properties of an RF NHIS, a 3D fluid model has been described by using COMSOL(COMSOL Multiphysics) that includes the self-consistent calculation of H−ions based on the lumped-levels method[8].Given the high powers and low pressures at which an NHIS operates, this work incorporates ion mobility under a high field and the effective electron collision frequency to address these factors.In addition, due to the presence of the magnetic filter, the electron transport coefficients and plasma conductivity are in full tensor form.
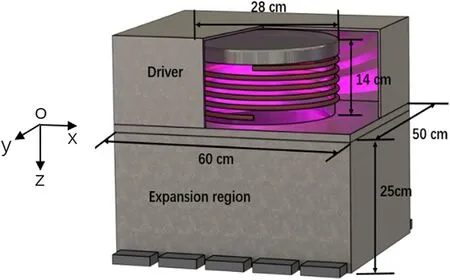
Figure 1.Schematic diagram of the RF NHIS.
2.Model description
Figure 1 shows the schematic diagram of the two-chamber RF NHIS used in this work.The small cylindrical chamber at the top,with an inner diameter of 28 cm and a height of 14 cm,is the driver region, which is externally wound with a five-turn coil.A 2 MHz RF power source is applied to the coil and then a time-varying azimuthal electric field is generated to partially ionize the working gas (H2) and maintain the discharge.The larger rectangular chamber in the lower part is the expansion region,with a length of 60 cm,a width of 50 cm and a height of 25 cm.Ten permanent magnets magnetized to a remanence of 2.1 T are arranged symmetrically along the x-direction on the side walls of the expansion region at 2 cm intervals to generate magnetic filter field in the −y-direction inside the chamber.The length, width and height of each permanent magnet are 9 cm, 5 cm and 2 cm respectively.The 3D fluid model is established within COMSOL and it includes fluid,plasma chemistry, electromagnetic field and static magnetic field modules, which are described in detail below.In the simulation, tetrahedral meshes are used.The minimum and maximum mesh sizes in the plasma region are 0.1 cm and 3 cm.To increase stability and calculation accuracy, several dozen boundary layers with thicknesses of less than 0.1 cm are adopted at the boundaries.
2.1.Fluid module
Although the temperature gradient, inertial term, nonlinear convection term and nonlinear Lorentz force term become obvious at high power and low frequency, the focus of this paper is on the self-consistent simulation of the H−ion generation by using a 3D fluid approach.In order to achieve fast 3D simulations,the above effects are temporarily ignored and the drift-diffusion equation is used for charged particles [33].
2.1.1.Electrons.For electrons, we solve the electron continuity and energy balance equations
whereneandare the electron and electron energy densities, respectively, andTerepresents the electron temperature.eΓ and Γεare the electron flux and electron energy flux,E is the electrostatic field, andPindis the inductive power deposition (see section 2.3 below).Rerepresents the electron generation and loss, andRεis the energy source term induced by inelastic collisions
wherenaandnbare the reactant number density,andεjis the threshold energy for reactionj.The rate coefficientkjfor reactionjis obtained according to the cross sectionσj
whereγis the coefficient,εeis the electron energy andfis the electron energy distribution function,which is assumed to be a Maxwellian distribution in this work.
In the simulation, the initial parameters are chosen to have values that could help to reach convergence over a shorter computational time.The initial densities for electrons,positive and negative ions are set to be 1×10¹⁷m−3,3.3×1016m−3and 1×10¹⁵m−3,respectively,the initial electron energy is 5 eV,and the initial molar fraction of various neutral particles is 1 × 10⁻².
2.1.2.Heavy particles.The transport of heavy particles, i.e.ions and neutrals, is described by the multicomponent equations:
wheremkis the ion mass,Nnis the neutral number density andkσis the cross section of the reaction between ions and neutrals.The ion-diffusion coefficientDkis calculated according to Einstein’s relation.The diffusion coefficient of a neutral particle is
whereDkjis the binary diffusion coefficient between specieskandj, andxjis the mole fraction for speciesj.
2.1.3.Boundary conditions.By ignoring the drift effect,secondary electron emission and thermal emission, the boundary conditions for electron flux and electron energy flow are
whereMkandckare the molar mass and molar concentration for species k.Note that the second term is only taken into account for ions.
2.2.Plasma chemistry
In this work, 23 species are considered, including electrons,H−, H+, H2+, H3+, hydrogen molecules and atoms in the ground state, H(n = 2) and H(n = 3) atoms in the excitedstate, and 14 hydrogen molecules in the vibrationally excited state (v= 1-14).These species collide with each other and the reactions are listed in table 1.
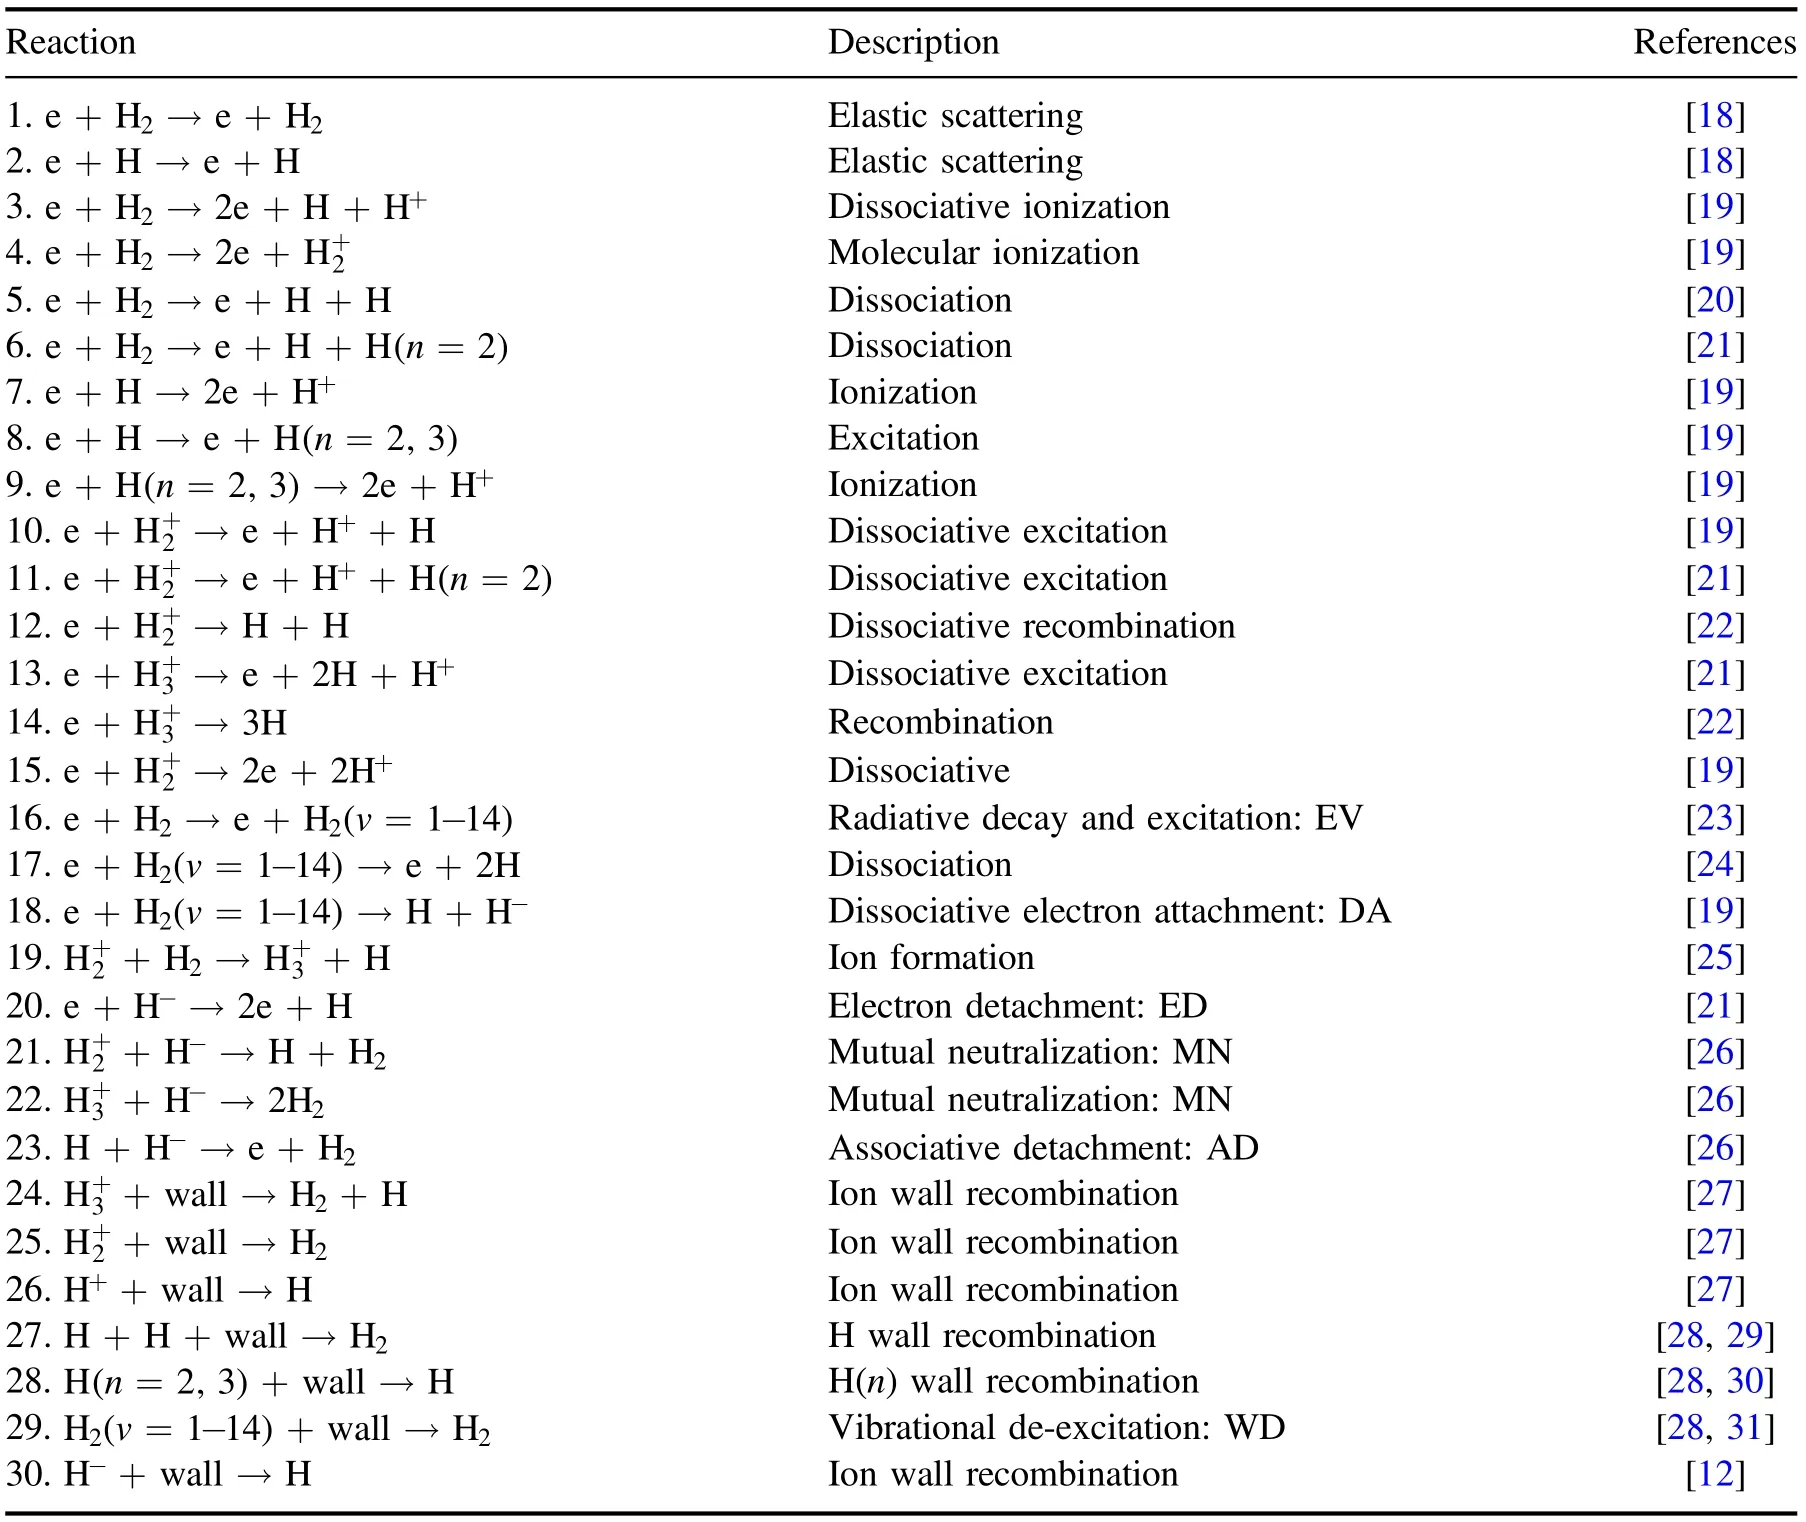
Table 1.Reactions included in this work.
In an NHIS, negative hydrogen ions H−are mainly produced by dissociative attachment (DA) reactions between low-energy electrons and vibrationally excited hydrogen molecules H2(v= 1-14).They are mainly lost through electron detachment (ED), mutual neutralization (MN) and associative detachment (AD) (see table 1).In order to reduce computational cost, the level-lumping method (i.e.grouping the vibrationally excited hydrogen levels) is adopted to simplify the chemistry set[34].According to the calculated VDF,the 14 vibrational levels are divided into three groups:v=1-4 is group 1(w=1),v= 5-9 is group 2(w=2)andv= 10-14 is group 3 (w = 3).Then, the reactions of the 14 vibrationally excited levels H2(v=1-14)are replaced by the reactions of the three groups, i.e.H2(w = 1-3).The number density for each group is calculated by the redefined particlebalance equation and the corresponding reaction rate coefficients are determined according to the internal partition function of these groups [8].The grouping method used in this work can not only accurately reproduce the plasma characteristics, but also reduce the number of equations to be solved in the model.Note that although H2(v= 1-14) are combined into four groups in [8], under the discharge conditions of this work,the three-group model can reproduce the plasma properties accurately, as will be illustrated in section 3.1 below.
2.3.Electromagnetic field module
The electromagnetic field is described by Maxwell’s equations.By introducing the magnetic vector potential and considering the harmonic approximation (A = A1eiωt),Maxwell’s equations yield
where A1is the amplitude value,iis the imaginary unit,ωis the angular frequency,εis the dielectric constant,is the unit tensor,Jcoilis the coil current density andμis the magnetic permeability.The plasma conductivityis expressed as

Figure 2.Distributions of the negative hydrogen ion density (a), electron density (b) and electron temperature (c) along the axial direction obtained by the models when the vibrationally excited molecules H2(v =1-14)are grouped(solid line)and considered individually(dashed line) at different pressures.
Since the NHIS works at low pressure,i.e.,0.3-2 Pa,stochastic heating, not ohmic heating, has a dominant influence.Therefore,the effective collision frequencyνeffis adopted,wherevenis the elastic collision frequency between electrons and neutral particles, andvstocis the stochastic heating frequency
here,δeffis abnormal skin depth
The inductive power deposition is
where the plasma current density can be written as
The electrostatic field is obtained by solving Poisson’s equation
whereρVis the charge density and0εis the vacuum permittivity.Since the bottom and side walls of the chamber are grounded, the boundary conditions for the electric potential isV=0.
2.4.Magnetostatic module
In the magnetostatic module, the magnetic field intensity is equal to the negative gradient of the magnetic scalar potentialVm
whereM is the magnetization intensity andμ0is the vacuum permeability.According to the magnetic insulation, we have= 0at the boundaries.
3.Results and discussion
In this work, negative hydrogen ion distributions are selfconsistently calculated by using a 3D fluid model at high power (40 kW), low pressure (0.3-2 Pa) and different magnetic filter positions(z=25,19,13 cm).In this model,the ion and neutral gas temperatures are assumed to be 600 K [16].First, the validity of the level-lumping method for the calculation of the NHIS is confirmed.Then, the evolution of negative hydrogen ion density in the x-z and x-y planes with pressure and magnetic filter position are presented,which can be understood on the basis of local (collisions) and non-local(transport) contributions.
3.1.Validity of the level-lumping method
In order to illustrate the validity of the level-lumping method,we have compared the plasma properties obtained when the vibrationally excited molecules H2(v= 1-14) are grouped and when they are considered individually by using a 2D axisymmetric model, in which the expansion region is assumed to be cylindrical with a radius of 25 cm.It can be seen from figure 2(a) that when the pressure is 0.3 Pa and 0.6 Pa, the axial distributions of the negative hydrogen ion density obtained with the level-lumping method agree well with those obtained when H2(v= 1-14) are treated individually.As the pressure increases to 1 Pa and 2 Pa, there is a slight difference in absolute values.This is because the deviation of the VDF obtained by the group model from that of the individual-levels model becomes obvious as pressure increases,especially for the second group(i.e.H2(v=5-9)),which contributes the most to the generation of negative hydrogen ions (see figure 3 below).In addition, the levellumping strategy barely affects the electron properties, which is clear from the electron density and electron temperature in figures 2(b)and(c).Therefore,we can conclude that applying the level-lumping method in the fluid model is feasible,which could help to simulate an NHIS accurately with a low computational cost.
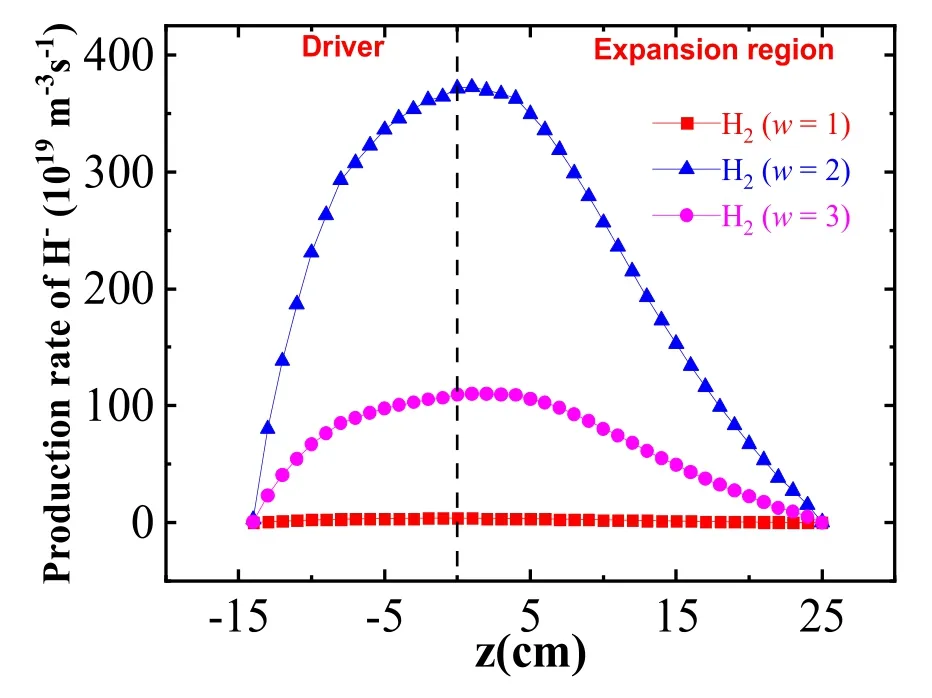
Figure 3.Distributions of the production rate of negative hydrogen ions yielded by different vibrationally excited groups H2 (w = 1-3)along the z-direction(x=30 cm,y=25 cm).The pressure is 0.6 Pa and the power is 40 kW.
In order to detect the influence of each group of vibrationally excited states H2(w = 1-3) on the generation of negative hydrogen ions, calculations are performed in the geometry of figure 1 and the production rate is plotted in figure 3.It can be clearly seen that the second group plays a dominant role and that the production rate is three times higher than that of the third group and even more than two orders of magnitude higher than the first group.Therefore,only the density distribution of the second group of vibrationally excited states (i.e.H2(w = 2)) is presented in the following discussion.
3.2.Effect of pressure
3.2.1.x-z plane.Figure 4 shows the spatial distributions of the negative hydrogen ion density at various pressures in the x-z plane(y=25 cm),with the power fixed at 40 kW and the magnetic filter located at the bottom of the expansion region(z=25 cm).It is clear that the negative hydrogen ion density has an asymmetric distribution at all of the investigated pressures due to the existence of the magnetic field.As the pressure increases, the peak of the negative hydrogen ion density moves horizontally along the x-direction(i.e.from the left of the symmetric axis to the right), with the maximum value rising monotonically.This is because both the electron density and H2(w = 1-3) density increase with pressure.Meanwhile, the electron temperature becomes lower, giving rise to enhanced H−generation.Note that the symmetric axis of the reactor is placed at x=30 cm,and‘left’(region where x<30 cm) and ‘right’ (region where x>30 cm) are absolutely determined.
In order to explain the evolution of the H−density with pressure in more detail, it is necessary to analyze the local(collisions) and non-local (transport) processes of negative hydrogen ions.The reactant density and the rate coefficient determine the source term through collisions,and the electric field determines the transport direction and coefficient.Asymmetric electron density, electron energy and potential distributions are formed because electrons are deflected by E×B drift and diamagnetic drift [16, 17], resulting in asymmetric collisions and transport (see below).

Figure 4.Spatial distributions of the negative hydrogen ion density in the x-z plane (y = 25 cm) at different pressures.
The color scale in the first row of figure 5 shows the source term of negative hydrogen ions RH−through collisions at different pressures, i.e.local process.The black and white contour lines represent the production rate (reaction 18) and destruction rate (reactions 20, 21, 22 and 23).Since the negative hydrogen ions are mainly generated by the second group of the vibrationally excited hydrogen molecules, H2(w =2) density is plotted in the second row.As the pressure increases, the maximum H2(w = 2) density becomes higher and moves closer to the left wall of the driver region.A second peak of H2(w = 2) density also appears at the right wall at 2 Pa (figure 5(h)) due to the increasing electron temperature there (not shown here) [17].
When the pressure is 0.3 Pa, the maximum production rate(black contour lines)appears at the right-hand side of the expansion chamber and gradually moves upwards to the left wall of the driver region as pressure increases.In the presence of a magnetic filter at 0.3 Pa,the E×B drift and diamagnetic drift result in an asymmetric distribution of electron temperature, i.e.the maximum electron temperature appears on the left-hand side of the wall [16, 17].Since negative hydrogen ions are mainly generated by low-energy electrons,production on the right-hand side is more pronounced.When the pressure becomes higher, on one hand, the electron temperature decreases and the asymmetry becomes less obvious.On the other hand, the density of reactants (i.e.electrons and vibrationally excited states) on the left-hand side of the driver region is higher and the discrepancy between the driver and expansion regions is more obvious[17], which is clear from the H2(w = 2) density.Moreover,the destruction rate in most areas of the driver region is greater than the production rate, leading to a negative source term.In contrast,the source term is greater than 0 in the lower part of the expansion region.
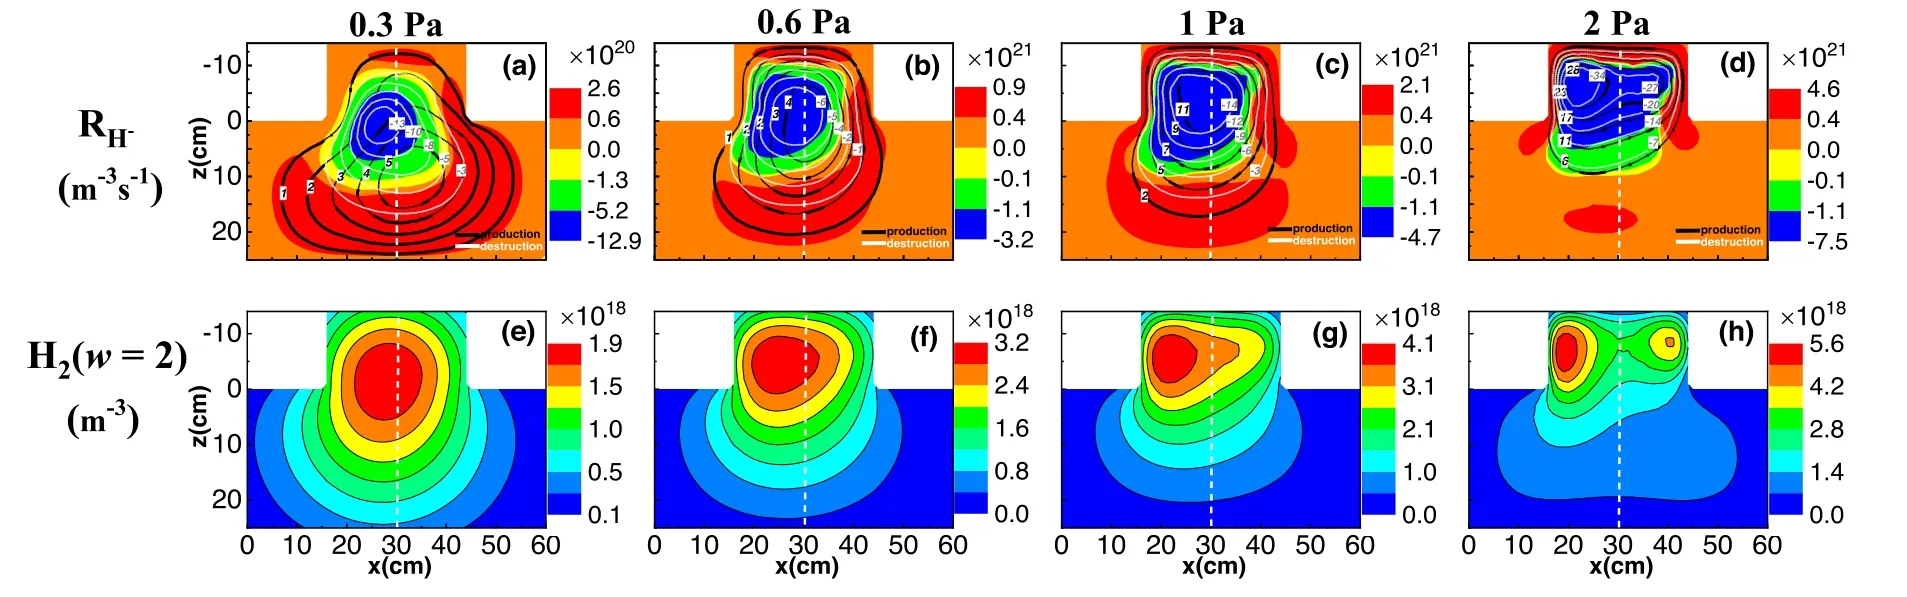
Figure 5.The source term of negative hydrogen ions(first row)and H2(w=2)density(second row)in the x-z plane(y=25 cm)at different pressures.The black and white contour lines in the first row represent the production and destruction rates of negative hydrogen ions.

Figure 6.The flux of negative hydrogen ions(first row)and plasma potential(second row)in the x-z plane(y=25 cm)at different pressures.The arrows in the first row represent the direction of flux.
The negative hydrogen ion density is not only affected by collisions, but also by transport, i.e.non-local processes.Therefore, the negative hydrogen ion flux ΓH−at different pressures are plotted in the first row of figure 6, where the arrows represent the direction of flux.The transport of ions is determined by both the drift caused by the electric field and the diffusion due to the density gradient.Within the studied discharge conditions in this work, since the diffusion flux is two orders of magnitude lower than the drift flux, ΓH−is mainly affected by the drift process.It can be seen from the second row of figure 6 that the maximum plasma potential appears on the left-hand side of the driver region, which is again caused by the movement of electrons due to E×B drift,and it drops sharply at the vessel wall, creating a strong electric field.Under this electric field force,although negative hydrogen ions are mainly generated on the right-hand side of the expansion chamber, the maximum density appears on the left (see figure 4(a) above).When the pressure increases, the plasma potential becomes lower,but with better homogeneity.Therefore,the negative hydrogen ion flux is directed from the wall towards the region with maximum plasma potential.
As a result, although negative hydrogen ions are mainly produced at the bottom of the expansion region, they drift upwards under the electric field force, with the maximum appearing at the junction of the driver and expansion regions.In the horizontal direction, maximum H−takes place on the left-hand side of the symmetric axis at 0.3 Pa,and it moves to the right-hand side at 2 Pa,indicating that transport dominates the H−density distribution at low pressures and collisions have a greater influence at high pressures.
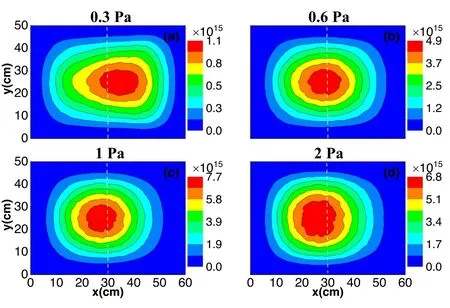
Figure 7.Distributions of negative hydrogen ion density in the x-y plane (z = 20 cm) at different pressures.
3.2.2.x-y plane.Figure 7 shows the distribution of H−density in the x-y plane (z = 20 cm), calculated under the same discharge conditions as figure 4.It can be seen that the negative hydrogen ion density increases and then decreases with pressure, and the maximum moves from the right-hand side of the symmetric axis to the left.
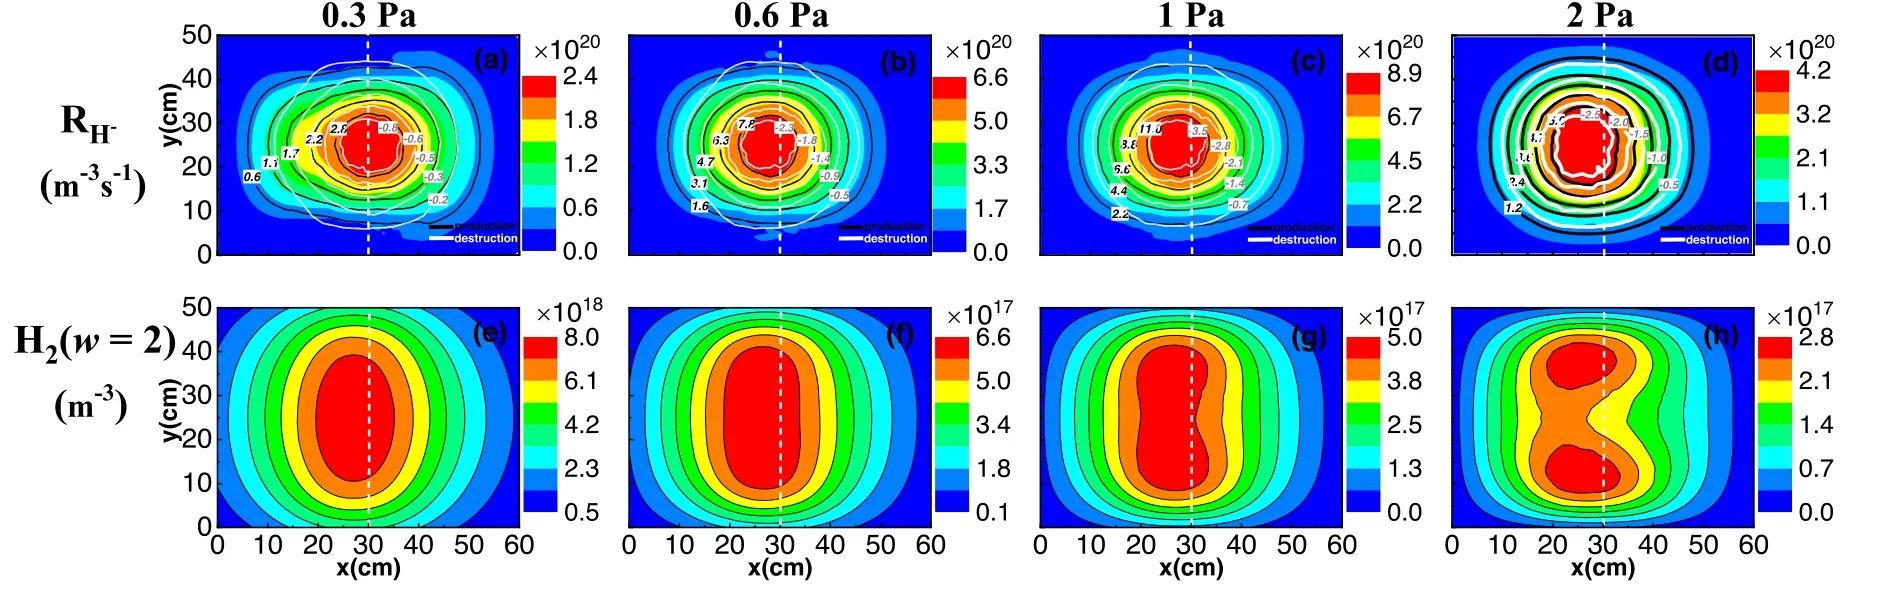
Figure 8.The source term of negative hydrogen ions(first row)and H2(w=2)density(second row)in the x-y plane(z=20 cm)at different pressures.The black and white contour lines in the first row represent the production and destruction rates of negative hydrogen ions.
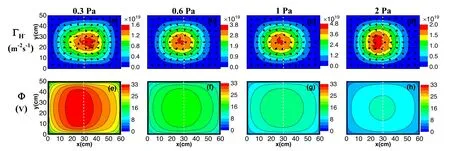
Figure 9.The flux of negative hydrogen ions(first row)and plasma potential(second row)in the x-y plane(z=20 cm)at different pressures.The arrows in the first row represent the direction of flux.

Figure 10.The magnetic field intensity at different magnetic filter positions.
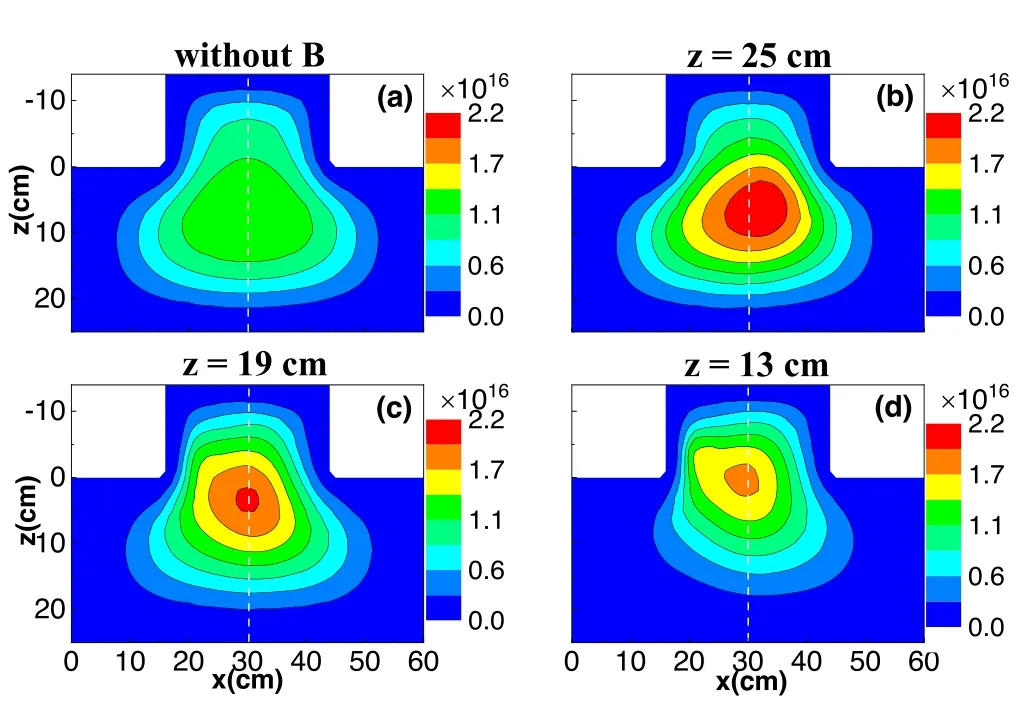
Figure 11.Distributions of negative hydrogen ion density in the x-z plane (y = 25 cm) without and with a magnetic filter placed at different positions.
The source term of negative hydrogen ions RH−at different pressures in the x-y plane is shown in the first row of figure 8.At all pressures investigated in this work, the production rate of negative hydrogen ions is greater than the destruction rate, giving rise to the positive source term.At 0.3 Pa, the source term on the right-hand side of the symmetric axis is larger than on the left, due to the lower electron temperature there.As pressure increases,the value at the left-hand side gradually exceeds that at the right due to less asymmetry in the electron temperature and the higher reactant density (i.e.electron and H2(w = 2) density) on the left-hand side, which can be seen in the second row of figure 8.Indeed,the reactant density plays a dominant role in the H−production rate at high pressures, due to the greater symmetric energy flow deposition.The H2(w = 2) density exhibits two maxima at 2 Pa (figure 8(h)) because the diffusion becomes less important and the discharge is more local at high pressure.
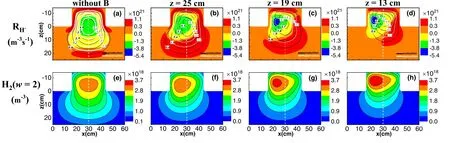
Figure 12.The source term of the negative hydrogen ions (first row) and H2 (w = 2) density (second row) in the x-z plane (y = 25 cm)without and with magnetic filter placed at different positions.The black and white contour lines in the first row represent the production and destruction rates of negative hydrogen ions.

Figure 13.The flux of negative hydrogen ions(first row)and plasma potential(second row)in the x-z plane(y=25 cm)without and with a magnetic filter placed at different positions.The arrows in the first row represent the direction of flux.
The first row of figure 9 shows the absolute value and direction of the negative hydrogen ion flux ΓH−at different pressures in the x-y plane.Again, the drift flux plays a dominant role,i.e.the value is one order of magnitude higher than the diffusion flux.Again,ΓH−in the x-y plane is directed from the vessel wall to the position with maximum plasma potential (the second row of figure 9).As the pressure increases, the flux first increases and then decreases.This is because although more negative ions are generated at high pressure, the transport along the z-axis is suppressed.Moreover, the maximum of the negative hydrogen ion density appears on the right-hand side at 0.3 Pa, indicating that the transport effect at the bottom of the expansion region is much weaker than the collisions.
3.3.Effect of magnetic filter position
In this section,the influence of the magnetic filter position on the negative hydrogen ion density is investigated at 40 kW and 0.6 Pa, with the magnetic filter located at 0 cm(z = 25 cm), 6 cm (z = 19 cm) and 12 cm (z = 13 cm) from the bottom of the expansion region, respectively.Figure 10 shows the distributions of the magnetic field strength along the z-direction (i.e.x = 30 cm, y = 25 cm) at different magnetic filter positions.It can be seen that by moving the magnet in the opposite direction of the z-axis, the magnetic field penetrating into the driver region becomes stronger.
3.3.1.x-z plane.Figure 11 shows the spatial profiles of the negative hydrogen ion density in the x-z plane without and with the magnetic filter placed at different positions.Compared with the case without the magnetic filter, there is a significant increase in H−density when the magnetic filter is placed at the bottom of the expansion region (z = 25 cm),with the maximum appearing on the right-hand side of the symmetric axis.As the magnet moves closer to the driver region, the H−density decreases, with the maximum shifting upwards and horizontally from the right-hand side of the symmetric axis to the left.
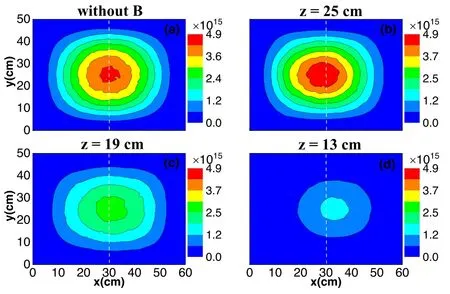
Figure 14.Distributions of negative hydrogen ion density in the x-y plane (z = 20 cm) without and with a magnetic filter placed at different positions.
In order to understand the negative hydrogen ion density distributions in the x-z plane for different magnetic filter positions, the local (collisions) and non-local (transport)processes are examined.The first row of figure 12 shows the distribution of the production and destruction rates of negative hydrogen ions.In the absence of the magnet, both the production and destruction rates are symmetrical.After introducing the magnet at z=25 cm, the maximum production rate moves to the right, while the maximum of destruction rate shifts to the left, due to the asymmetry of the electron temperature.Since electrons tend to rotate around magnetic field lines, the source term in the vicinity of the magnet exhibits a significant increase due to the lower electron temperature caused by the frequent collisions there.Under this condition, the positive source term mainly takes place on the right-hand side of the chamber.As the magnet moves to z=19 cm,the production rate continues to decrease and the destruction rate gets closer to the left wall[16].This is due to the fact that the stronger magnetic field in the driver region leads to a local increase in electron temperature,which limits the production of negative hydrogen ions.Moreover,the electron temperature gradient between the driver and expansion regions increases, which enhances the asymmetry.When the magnet is placed at z=13 cm,both the production and destruction rates in the driver region continue to increase.This is because the magnetic field is too strong, which suppresses the transport of electrons to the expansion region[32].Therefore, the electron density in the driver region becomes higher, as well as the production and destruction rates.The positive source term at the expansion region becomes less intense as the magnet moves upward [16].
In addition, the distribution of H2(w = 2) density is shown in the second row of figure 12.When the permanent magnet is introduced, the maximum H2(w = 2) density moves to the left wall of the driver region and the value near the bottom wall of the expansion region decreases.As the magnet moves towards the driver region,the peak H2(w=2)density becomes more intense with higher absolute values due to the higher electron temperature.
The first row of figure 13 shows the negative hydrogen ion flux, which is mainly determined by the drift under the electric field,as mentioned above.When the magnetic filter is introduced,the potential distribution becomes asymmetric,as can be seen in the second row of figure 13,and the asymmetry becomes more obvious as the magnet moves upwards.Therefore, the negative hydrogen ions transport towards the left wall of the driver region.
The distribution of negative hydrogen ion density is determined by the combined effect of collisions and transport.When the magnet is located at z = 25 cm, the source term exhibits a maximum in the expansion region.Due to the dominant influence of collisions, the maximum negative hydrogen ion density appears on the right-hand side of the symmetric axis.When the magnet moves to z=13 cm,the transport plays a more important role as the value of the source term decreases, so the peak negative hydrogen ion density moves to the left-hand side of the driver region.
3.3.2.x-y plane.Figure 14 shows the spatial profiles of the negative hydrogen ion density in the x-y plane (z = 20 cm)without and with the magnetic filter at different positions.When the magnetic filter is applied at z=25 cm,the negative hydrogen ion density is slightly higher than that in the case without the magnet.As the magnet moves towards the driver region, the density decreases monotonically and the symmetry becomes worse, with the maximum shifting from the left-hand side of the symmetric axis to the right.
Moreover, as can be seen in the first row of figure 15,when the magnet is placed at z = 25 cm, the source term in the x-y plane is greater than 0, i.e.the production rate is higher than the destruction rate.As the magnet shifts upwards, both the production and destruction rates reduce,with the maximum moving to the right.Since excited hydrogen molecules H2(w = 2) play an important role in the production of negative hydrogen ions, their density is presented in the second row of figure 15.It is clear that the maximum H2(w=2) density appears on the left and decreases monotonically with the upward movement of the magnet.However, due to the dominant influence of the electron temperature,the maximum generation rate appears at the right-hand side as the magnet moves upwards.

Figure 15.The source term of negative hydrogen ions(first row)and H2(w=2)density(second row)in the x-y plane(z=20 cm)without and with a magnetic filter placed at different positions.The black and white contour lines in the first row represent the production anddestruction rates of negative hydrogen ions.
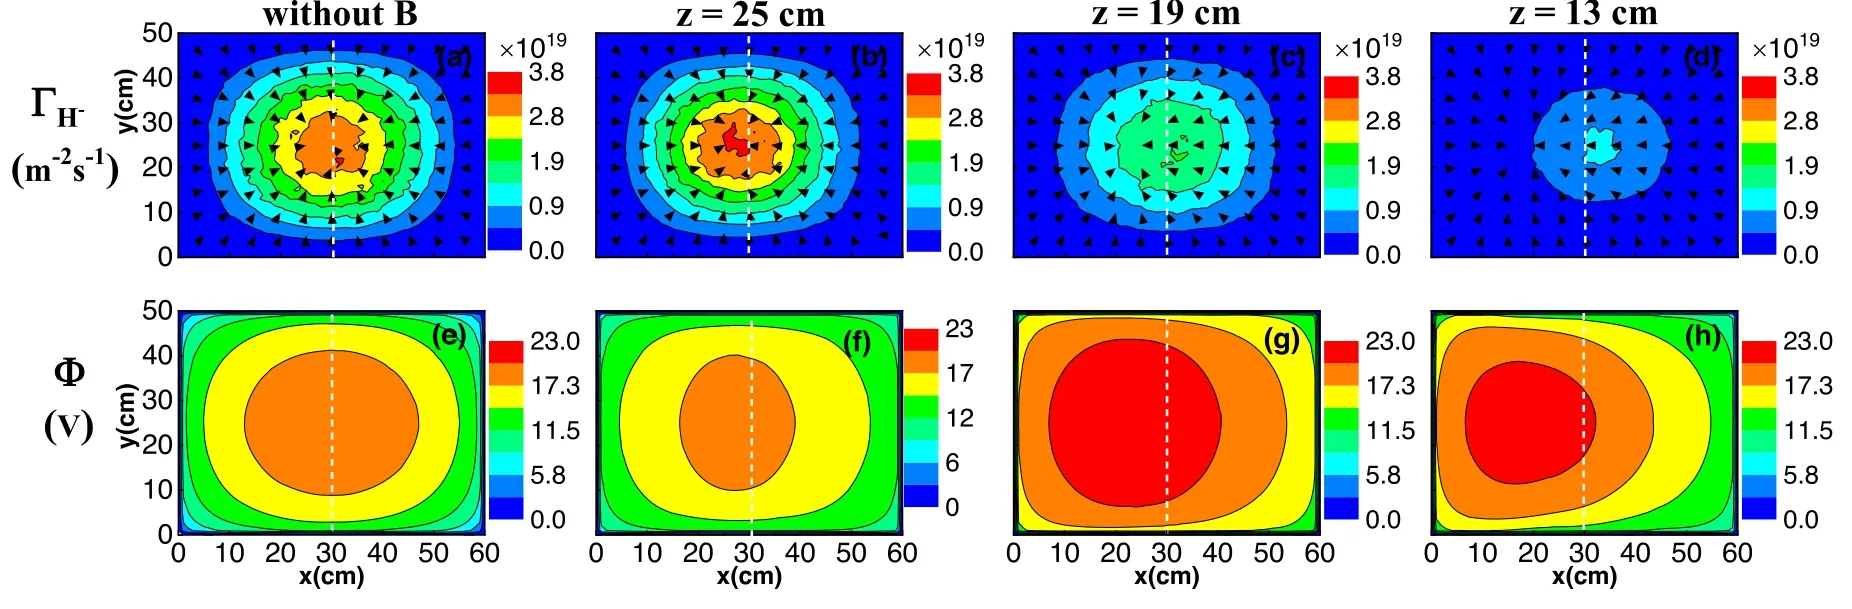
Figure 16.The flux of negative hydrogen ions(first row)and plasma potential(second row)in the x-y plane(z=20 cm)without and with a magnetic filter placed at different positions.The arrows in the first row represent the direction of flux.
From figure 16, it is clear that the negative hydrogen ion flux gradually decreases as the magnet moves upwards.Since collisions instead of transport play a dominant role at the bottom of the expansion region,the distribution of the negative hydrogen ion density is consistent with the source term.
4.Conclusion
In this paper, a 3D self-consistent fluid model with a levellumping strategy is employed to investigate an RF NHIS under various discharge conditions, with the volume production of H−ions taken into account self-consistently.First,the influence of the pressure on the negative hydrogen ion density is investigated.As pressure increases, the negative hydrogen ion density in the x-z plane increases, with the maximum moving from the left-hand side of the symmetric axis to the right.The evolution of the negative hydrogen ion density can be explained by the combined effect of local and non-local processes.Indeed, as pressure increases, collisions instead of transport play a dominant role.In the x-y plane,the negative hydrogen ion density first increases with pressure and then decreases, indicating that the transport from the driver region to the expansion region is suppressed at high pressure.In addition, when a magnetic filter is placed at the bottom of the expansion region, the negative hydrogen ion density in the x-z plane increases significantly and the asymmetry becomes obvious.As the magnet moves upward,the negative hydrogen ion density decreases, with the maximum shifting upwards to the left-hand side of the driver region.This can be explained by transport becoming dominant as the magnet moves upward.In the x-y plane,the source term is greater than 0 and the negative hydrogen ion density distribution is mainly determined by collisions.Both the density and symmetry of the negative ions at the bottom of the expansion chamber are reduced during the process of changing the magnet’s position toward the driver region.
The results show that the volume production of negative hydrogen ions could be optimized (i.e.higher density and better symmetry) at 1 Pa when the magnetic filter is placed away from the driver region under the conditions used in this work.
Acknowledgments
This work was supported by the National Key R&D Program of China (No.2017YFE0300106), National Natural Science Foundation of China(Nos.11935005 and 12075049)and the Fundamental Research Funds for the Central Universities(Nos.DUT21TD104 and DUT21LAB110).
猜你喜欢
Plasma Science and Technology(2022年5期)2022-06-01
Plasma Science and Technology(2022年5期)2022-06-01
快乐作文(1.2年级)(2022年2期)2022-04-15
Plasma Science and Technology(2022年2期)2022-03-10
Plasma Science and Technology(2021年11期)2021-11-30
Chinese Physics B(2021年11期)2021-11-23
Chinese Physics B(2021年4期)2021-05-06
Chinese Physics B(2021年3期)2021-03-19
科学导报·学术(2020年49期)2020-12-06
 Plasma Science and Technology2023年10期
- Plasma Science and Technology的其它文章
- A laser-produced plasma source based on thin-film Gd targets for next-generation extreme ultraviolet lithography
- The effect of pulse voltage rise rate on the polypropylene surface hydrophilic modification by ns pulsed nitrogen DBD
- Comparative study on the degradation of phenol by a high-voltage pulsed discharge above a liquid surface and under a liquid surface
- Room-temperature degradation of o-xylene in simulated air using an online-regenerable plasma-catalysis reactor with low amounts of nanosized noble metals on Co3O4
- Enhanced surface-insulating performance of EP composites by doping plasmafluorinated ZnO nanofiller
- Endurance-test and theoretical prediction of a rare earth nanocathode for the applied field magnetoplasmadynamic thruster