
Computational and experimental investigations of a microfluidic mixer for efficient iodine extraction using carbon tetrachloride enhanced with gas bubbles
2023-12-02 09:22SiddiqueMuhammadKashifSunLin孙林andLiSongjing李松晶
Chinese Physics B 2023年11期
Siddique Muhammad Kashif, Sun Lin(孙林), and Li Songjing(李松晶)
Department of Fluid Control and Automation,School of Mechatronics Engineering,Harbin Institute of Technology,Harbin 150001,China
Keywords: microfluidic mixer,iodine extraction,CFD simulation,micro-mixing properties
1.Introduction
Microfluidics is a rapidly growing field that manipulates and controls fluid flow on a micro-scale.[1,2]The application of microfluidics in biochemistry has led to several advances in the field, providing new opportunities for research and discovery.[3–5]From the study of cells and cell behavior to the analysis of chemical and biological fluids,the development of new assays,and the creation of novel therapeutic strategies,microfluidics is a versatile technology that is helping to advance our understanding of chemistry and biology.[6,7]
The essential step in using microfluidic technology for biochemical analysis is mixing samples in a microfluidic chip.[8]Micromixers are devices used in microfluidics to mix small volumes of fluids in a controlled, and efficient manner.[9]Microfluidic mixing is critical in many microfluidic applications, such as chemical synthesis, biochemical analysis,and drug delivery.[9,10]Micromixers are designed to work on a microscale, with channels and mixing elements less than a millimeter in size.[11]There are several different types of micromixers used in microfluidic chip-based mixing techniques.Electrokinetic mixers use electric fields to drive fluid flow and mix fluid streams.Hydrodynamic mixers are based on pressure-driven flow to mix fluids.[12]Acoustic mixers apply sound waves to generate fluid motion and mix fluid streams.[13,14]Optofluidic mixers use light to generate fluid motion, and mix fluid streams.[15]Each category of micromixer has its benefits and shortcomings,and the mixer selection varies on the application’s precise needs.
The generation of gas bubbles is essential in various fields, such as microfluidics, biomedicine, and drug delivery processes.There are different methods for generating gas bubbles.One method is gas injection, which allows for precise control over the size of bubbles but has limitations in continuous production.[16]Another method is optothermal bubble generation, which uses localized heating for precise manipulation.[17]Moreover,acoustic bubble generation driven by ultrasonic waves is crucial for continuous production in biomedical applications such as drug delivery and ultrasound imaging.[18]Each technique has its advantages and disadvantages.Gas injection offers meticulous control but lacks continuity.Optothermal methods excel in spatial and temporal control for microfluidics,while acoustic techniques prove vital for continuous bubble production in biomedical applications.
Gas bubble micromixing is a method of mixing small volumes of fluids in microfluidic systems using inert gas bubbles.[14]In this method, gas bubbles are introduced into a fluid stream, causing the fluid to become agitated and mixed.[19]The size and frequency of the gas bubbles can be controlled to achieve the desired level of mixing, making gas bubble micro mixing a highly tunable and customizable mixing technique.[20]Gas bubble micromixing is a versatile and effective mixing technique in various microfluidic applications,including chemical synthesis,biochemical analysis,and drug delivery.[21]One of the critical advantages of gas bubble micromixing is a non-invasive process that is important for delicate or sensitive samples.[22]The mechanism of gas bubble micromixing is based on the rapid expansion and collapse of gas bubbles in the fluid stream.[23,24]As the gas bubbles expand and collapse,they create turbulence and fluid motion,leading to mixing.[25]
In drug delivery, microfluidics-based iodine extraction has gained attention and offers several advantages.Iodine extraction is utilized in drug delivery to control the release of iodine from pharmaceutical formulations.[26]Microfluidic systems utilize small-scale channels and chambers to precisely manipulate fluids,allowing for controlled and efficient extraction processes.[8,27]Iodine also produces photographic film and synthesizes synthetic organic compounds, such as dyes and pigments.[26]It also works as a tracer element to study ocean currents, detect leaks in oil wells, and purify water in areas where clean drinking water is not readily available.[28]A rapid microfluidic mixer-based elemental iodine extraction,used at the micro level in drug delivery, holds great promise due to its versatility and ability to improve diagnostic imaging and targeted drug delivery accuracy.[28–30]The microfluidic gas bubble mixing technique has numerous advantages over conventional methods.It offers improved control, reduced sample volume, quicker mixing, high throughput capacity,minimized contamination risks,compatibility with automation,and cost-effectiveness.These benefits make it a potent and promising instrument for various applications, from basic research to industrial processes.[31]
This study introduces a novel approach in microfluidic mixer-based micro-mixing by utilizing gas bubbles to induce turbulence and micro-vortices,ensuring uniform sample mixing.The bubble formation rate and volume variation are analyzed, highlighting their distinction from previous gas bubble magnetophoresis based micromixing and flow stabilization studies.[8,27]The gas bubble mixing process offers precise control over microscale biochemical sample mixing, which is crucial for clinical diagnostics and drug discovery.It enables efficient mixing, extraction, and quantification of lowconcentration biochemical samples.Experimental results are validated through comparison with computational fluid dynamics (CFD) simulations.In this study, we used gas bubble micromixing for elemental iodine extraction, demonstrating effective uniform mixing within a microfluidic chip.These findings advance microfluidic chip-based mixing techniques,holding promise for diverse biomedical applications.
2.Material and methods
2.1.Fabrication of microfluidic chip

The microfluidic chip is manufactured in two layers of polymethyl methacrylate (PMMA).PMMA layers are fabricated using the JingYan4030 CNC machine, as shown in Fig.1(a).Silicone(medical and food-grade,used to make human prosthetics)based seal plugs are manufactured,which are designed in-house by HIT fluid and flow group,and fabricated by JingYan4030 CNC machine,as indicated in Fig.1(b).The silicone injection mold is annealed in an oven at 80◦C for 3 h to become solidified,as displayed in Fig.1(c).The microfluidic chip is assembled by combining the PMMA layers and fitting the seal plugs.The assembled microfluidic chip is depicted in Fig.1(d).The microfluidic chip fabrication process is carried out in a clean room(class 1000).The microfluidic chip dimensions utilized in this study are 50 mm×30 mm,incorporating various components.It comprises a sample entrance,three reagent entry inlets,a gas exhaust outlet,and a gas inlet at the top of the microfluidic chip.These inlets have diameters of 3 mm,2 mm,and 3 mm,respectively,as shown in Fig.1(d).Two outlets for sample extraction with a diameter of 3 mm are situated at the bottom of the chip.Within the microcavity is a gas bubble injecting opening depicted in Fig.1(d),which measures 1 mm in size.
2.2.Working principle
The bubble mixing technique in microfluidics mixer can extract elemental iodine or other elements from fluid for drug delivery and biochemical analysis.Iodine is used to produce printing inks and dyes and formulate a few medications.Carbon tetrachloride is used to extort elemental iodine from the iodine solvent.Iodine extraction often plays a key role in many processes, including medication extraction systems, vitamin encapsulation, artificial flavor addition in edibles, and trace extraction in medicines.In this study,iodine is extracted using carbon tetrachloride through liquid-liquid extraction.Iodine is dissolved in the iodine suspension liquid,and carbon tetrachloride is added to the mixture.Iodine is more soluble in carbon tetrachloride than in the iodine suspension liquid.It moves from the liquid suspension phase to the carbon tetrachloride phase using the mixing method,allowing extraction.The two liquids are then separated,and the iodine is recovered from the carbon tetrachloride phase.[32,33]
2.3.Gas bubble mixing simulation
ICEM 15.0 tool is used for meshing, geometry preparation, and visualization.The two-dimensional (2D) modeling is used to simulate the formation of bubbles inside the microfluidic chip for analysis.The simulation results mainly focus on studying gas bubble formation and generated microvortices.Volume distribution, pressure, and velocity distribution results have been simulated using the 2D model.[34]ICEM offers meshing with a size function in grid generating systems to concentrate on the small fragments and swift processing.The simulation’s step size has been selected to be as small as possible due to the significant size difference between the gas input and the fluid crater, and the intricate nature of bubble origination.[35,36]This study uses triangular meshes to investigate grid independence in CFD simulations for bubble mixing in microcavities.Two sets of triangular grids(mesh 1 and mesh 2)with varying densities are employed as shown in Fig.2, and grid quality is maintained above 0.7 to ensure accurate results.Small-sized triangular grids are used in the inlet regions to capture intricate flow details,while very small grids near the boundaries enhance precision.The results demonstrate the effectiveness of this triangular mesh configuration in accurately simulating bubble mixing phenomena within microcavities.
The boundary conditions for microfluidics chip-based gas bubble mixer inlet pressure is 4 kPa.The symmetry boundary is adjusted on the symmetry plane.Two modelsK–Ω andK–∊were employed in the simulation,indicating a negligible difference between them.The simulation employed the phasefield method to track the bubble interface.
2.3.1.Governing equation and solving method
The Navier–Stokes(NS)equations are used to predict the behavior of fluids and gases inside the microfluidic chip.Mass conservation and momentum principles are used to obtain the balance between forces acting on the fluid and its momentum change rate, respectively.The governing equations provide liquid velocity, pressure, and density change.They are expressed as partial differential equations and can be written in vector form,representing fluid flow behavior,including velocity and pressure.External forces such as gravity or buoyancy can also affect the fluid’s behavior.[37,38]
wherevis the fluid velocity,ρis the fluid density,tis time,∇is the gradient operator,pfis fluid pressure,τis the stress tensor,andfdis any external force acting on the fluid.These equations are highly nonlinear and difficult to solve analytically,so numerical methods are often used to approximate solutions.The volume of fluid (VOF) model has been used to analyze gas bubble mixing inside the microfluidic chip.
Micro-vortices are formed due to the flow of gas bubbles within a fluid.The phenomena occur when a gas bubble rises in the microcavity of a microfluidic chip, creating fluid flow around the bubble.When the gas bubble moves at a sufficient velocity,the flow of fluid around the bubble will become unstable and form vortices.In addition, the motion of multiple bubbles in a fluid interacts and creates complex flow patterns, including micro-vortices.The NS equation considers the effects of gas bubbles on the fluid flow,including the buoyancy and drag force factors on the bubbles and the interaction between fluid flow and the bubbles.Micro-vortices’ behavior due to gas bubbles has important implications for various physical and engineering systems,such as heat transfer,mass transfer,and fluid mixing.[39]
2.3.2.Simulation result
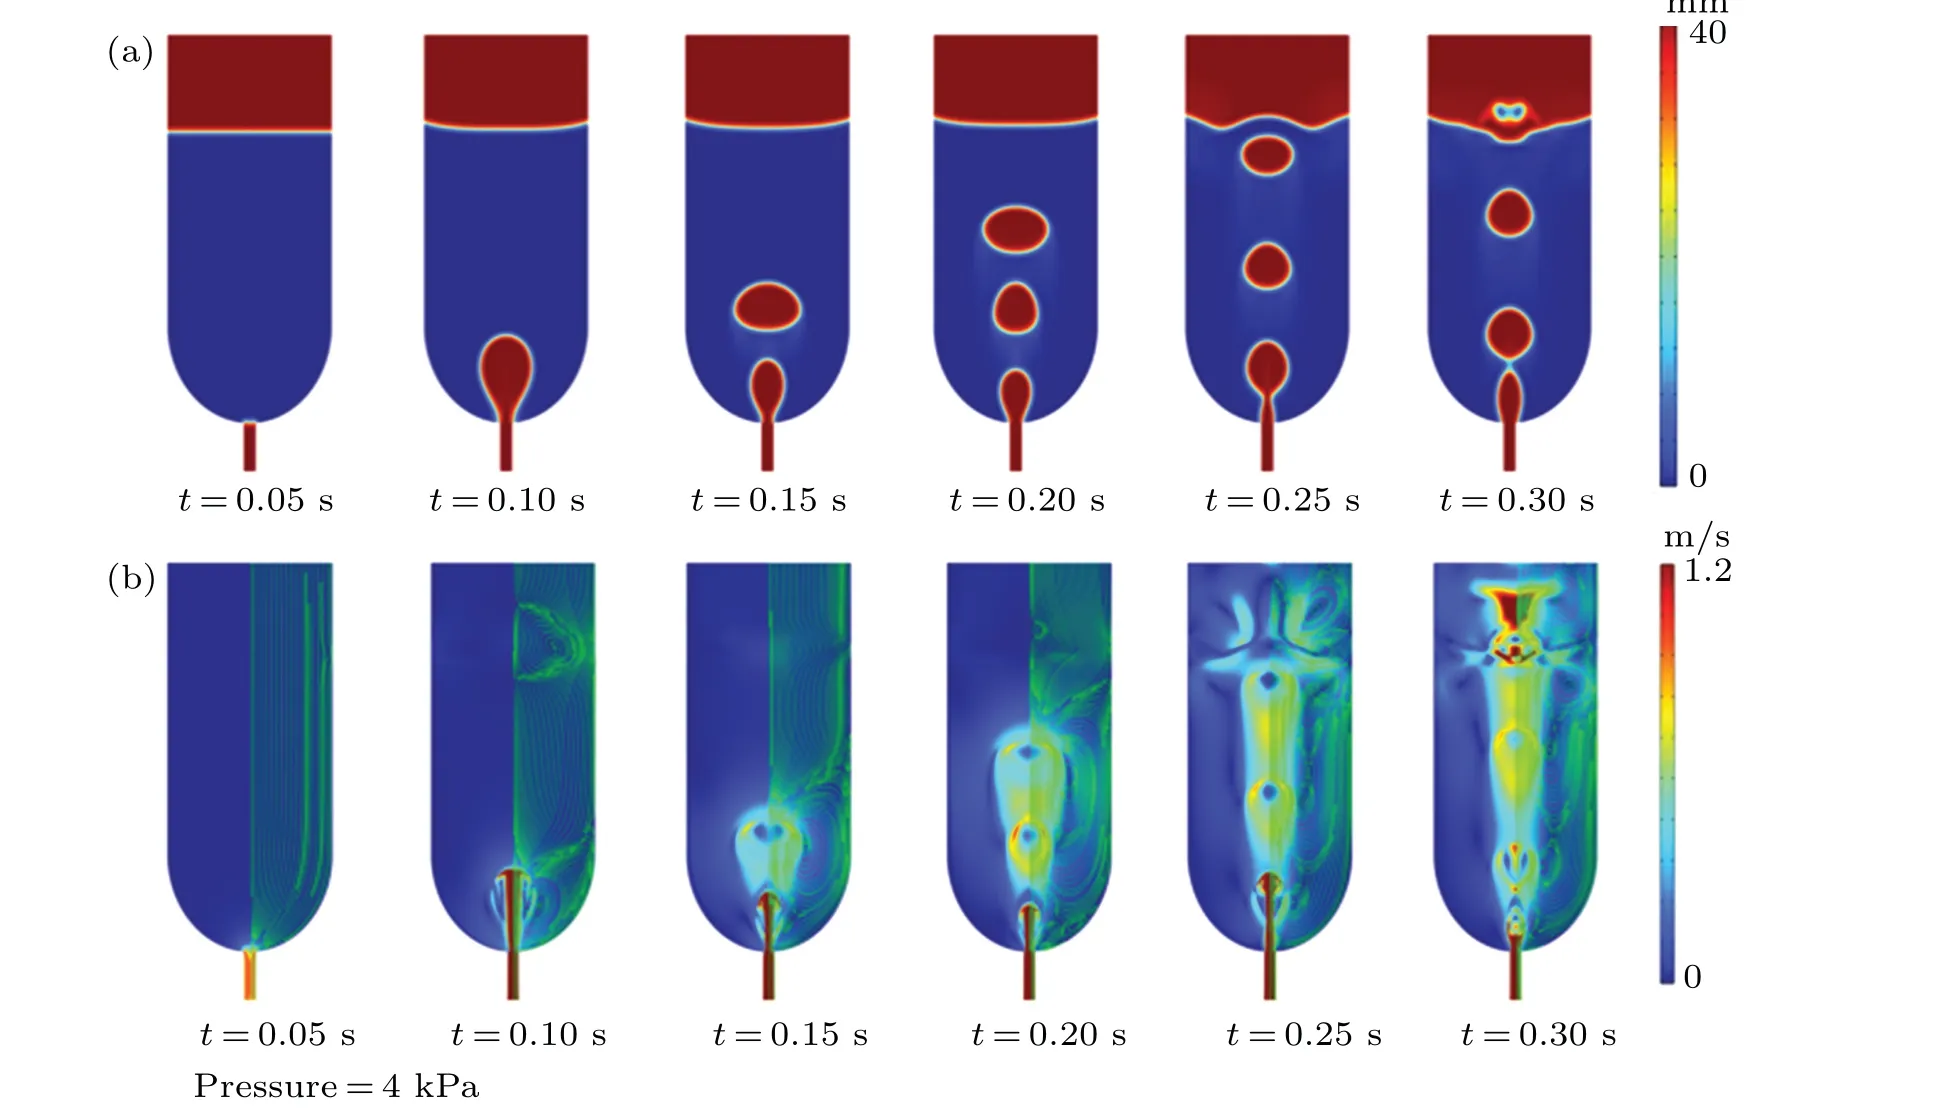
The simulated gas bubble rising progression along with the micro-vertices formation is shown in Fig.3 at a pressure supply of 4 kPa.The volume distribution fractional simulation results are shown in Fig.3(a).initially, at 0.05 s, inert gas is supplied to the bottom inlet of the microfluidic chip.The gas bubble diameter is about 3.25 mm at a time of 0.1 s,as shown in Fig.3(a).The second bubble begins to form at 0.15 s,while the first bubble’s breadth totals 4.25 mm.The first bubble’s dimension range expands to 4.81 mm at 0.20 s,while the second bubble is around 3.14 mm.At 0.20 s, the initial bubble attains a diameter of 5.77 mm, whereas the width of the subsequent bubble is approximately 3.52 mm.Simultaneously,a third bubble commences its formation.At 0.25 s, the first two bubbles come together to form a solitary, wider bubble that attains a diameter of approximately 9.25 mm, while the width of the third bubble is 3.27 mm.At 0.30 s,the width of the third bubble increases to 3.60 mm, and a bottom bubble emerges.The bubble formation and ascent process continues beyond 0.30 s.As the bubbles rise and grow during the formation process,they generate vortices.With the increase in bubble formation rate, sizeable vortices will arise on either side of the bubble’s path of ascent,resulting in a persistent disturbance in the water.The bubble-creation process and associated flow field changes are shown in the simulated velocity distribution results and the pressure distribution in Fig.3(b).At first,bubbles develop,become more significant,and push the fluid around them.The solitary bubble then begins to ascend from the chip’s base.A micro-vortex is created when some lower liquids are trapped in the wake.The subsequent formation and ascent of the many bubbles cause them to merge into two more giant bubbles at the liquid level.The bubbles generated at low pressure do not merge with each other during the rising process.The bubbles coalescence takes place at the liquid level.Inside the microfluidic mixer.
2.4.Experimental setup
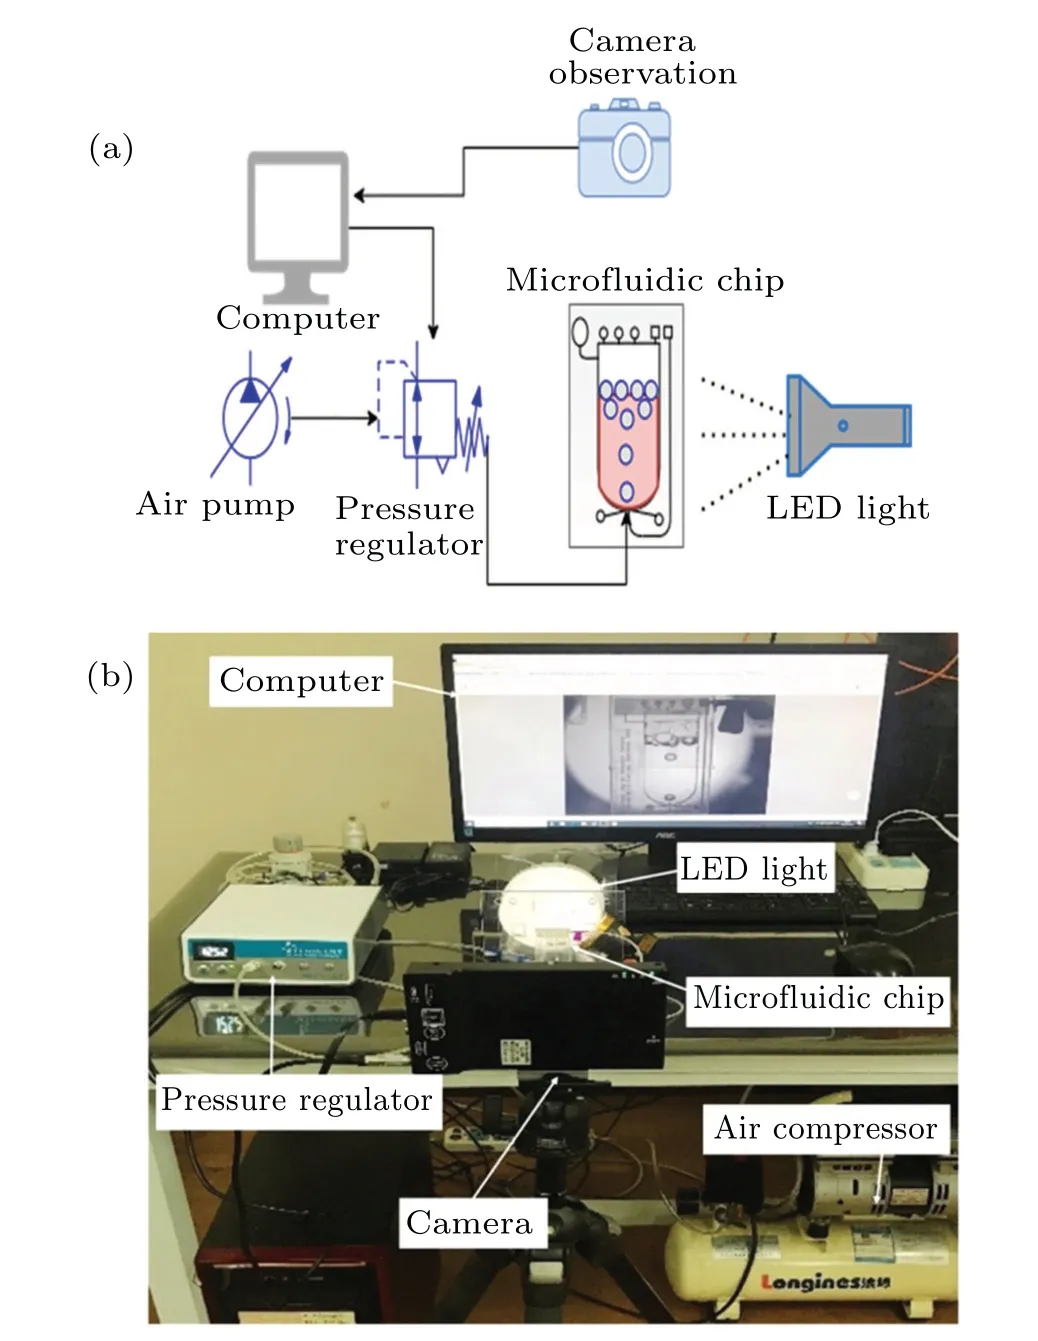
The experimental bubble mixing setup aims to measure variations in mixing efficiency brought on by driven pressure oscillations.The bubble mixing experimental approach is shown schematically in Fig.4(a), along with an actual setup image, which includes a high-resolution camera, computer,air pump,and digital pressure regulator injecting the inert gas bubble at the gas inlet of the microfluidic chip,LED light,and a microfluidic chip as shown in Fig.4(b).The digitally controlled accurate pressure regulator can eliminate the instability of the flow rates from the pump and provide a continuous,precise, and stable pressure supply to the experimental system.It is used for our bubble mixing system experiments as the pressure source of the microfluidic bubble mixing system.A high-resolution camera is utilized to record photos of bubble creation and expansion.
3.Results and discussion
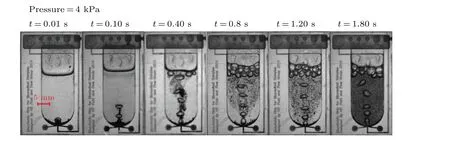
The expansion,deformation,and ascent of the bubbles in the water demonstrate that bubble mixing is a dynamic process closely following the simulation’s predicted mechanism.Initially,4 kPa of pressure is applied to inject inert gas into the base of the microfluidic chip.Figure 5 shows the photographs captured during the experiment.The formation of a bubble in a liquid begins at the bottom of the microcavity at 0.01 s.At 0.10 s,the rising bubble creates a second bubble,leaving a fluid trail from the lower layer.During the time between 0.40 s and 1.8 s,entrainment lifts the particles and moves them to the liquid level inside the microfluidic chip.Experimental results show that the ascending particles are primarily dispersed along the bubble’s wake rather than driven upward by the next bubble.At 1.8 s,the particles are evenly spread and mixed inside the microfluidic chip.when the gas bubbles are too small,the ascended particles will descend to the bottom layer, and the gas bubble will keep moving upward without entrainment.
The predicted distribution of the flow field’s volume fraction and velocity during bubble mixing are shown in Fig.6.Figure 6(a)displays gas bubbles developing and rising as the lower fluid travels into the bubbles’wake once the fluid around the bubble is disrupted.Then,two opposite micro vortices develop on either side of the gas bubble’s upward stream.The procedure results in the upward movement of fluid from the bottom layer.The continuous production and expansion of bubbles produce micro-vortices that merge to form powerful vortices, leading to strong fluid flow within the chip.This results in the efficient mixing of the liquid, as depicted in Fig.6(b).The bubbles rise and create vortices as they develop during the bubble forming process.Therefore, the collective effects of bubble formation and ascent result in the bubble mixing outcome.Figures 6(c) and 6(d) demonstrate the predicted and observable vortex formations while the gas bubble generation and the merging of vortices at 4-kPa pressures.

The effect of pressure on the angular velocity of vortices carries significant implications for fluid mixing.Figure 7 shows the simulation results of pressure distribution inside the microfluidic mixer.Different factors influencing this interaction govern the relationship between pressure and vortex dynamics.Bernoulli’s fundamental principle in fluid mechanics asserts an inverse relationship between fluid pressure and velocity.Consequently, an increase in pressure tends to decelerate the rotational motion of vortices, thereby disturbing their angular velocity.Further,viscosity produces shear stress within the vortices due to pressure gradients.The effects on vortex strength and angular velocity are dependent upon the specific fluid viscosity and the intricate physical properties of the vortices.Moreover, flow confinement significantly influences the behavior of vortices.When pressure variations arise from the surrounding boundaries, the vortex structure and stability are transformed,eventually impacting the angular velocity.[40]
Changes in the driving pressure also lead to changes in the bubble formation rate,which is also one of the factors affecting mixing efficiency.We used the image processing method to obtain the variation of bubble formation rate with driving pressure;the results are displayed in Fig.8(a).It is evident that the experimental driven pressure ranges from 2 kPa to 10 kPa;with the driven pressure increase, the bubble formation rate initially increases and then later on decreases,reaching a maximum of 60 bubbles per second at 4 kPa.As the bubbles in front rise, they will create a low-pressure zone behind them.The bubbles in the back use this low-pressure zone to reduce the resistance significantly during the rising process, just like the principle of geese flying in line.When the driving pressure exceeds 5 kPa,the catch-up effect is formed,and the velocity of the below bubble is higher than the above bubble, which will coalesce at last.The wake fluid field of the bubbles above acts directly on the bubbles below.Affected by the drag force of the bubbles’ wakefield, the bubbles’ speed below accelerates,and a catch-up effect is formed between the two bubbles,and finally,coalescence occurs.The merged bubbles are a superposition of the previous two bubbles, larger, rising faster,and mixing better.
According to experimental results, the gas inside is under the same pressure as the water surrounding it; hence, the balance of forces dictates that the volume of the bubble will change as it ascends.The gas pressure ranges from 2 kPa to 10 kPa,and the expansion of bubbles at the liquid level during the bubble-rising process can be considered negligible.The study looks at the effect of the driving force on the size of the bubble at various input pressures within the chip,even though the change in bubble volume induced by changing driven pressure is evident.To gain more in-depth insights,the size of the bubble was measured at three distinct liquid statures.The research findings unveil the variations in the size of the bubble as it pertains to the driving pressure discovered through numerical simulation and data gathered from the study at several distinct heights.Simulation and experimental data show bubbles enlarge as gas pressure rises and the mixing effect intensifies.The bubble’s volume ranges from 14 mm3to 121 mm3when the input pressure shifts from 2 kPa to 10 kPa,as shown in Fig.8(b).The downward trend of the bubble in the lower level of the microfluidic chip is evident;however,the volume of the bubble measured in the upper levels (liquid level and half liquid level)is relatively similar.

The analysis of gas bubble micro-mixing efficiency involved studying the volume of both the total fluid volume and gas volume using image processing.Initially, att=0.01 s,there was no noticeable change in the total fluid volume or gas bubble volume as the bubbles began ascending.However,betweent=0.1 s and 0.4 s, multiple bubbles started emerging from the bottom of the microfluidic chip, causing the total fluid volume to expand.A significant volume change of approximately 7% was observed during this period while the bubbles gathered at the liquid surface.Simultaneously,the gas bubble volume exhibited changes ranging from 3%to 11%.Att=0.8 s, as the bubbles expanded and moved upward, there was an evident change in the total volume, with an approximate 16%increase.The gas bubble volume also experienced a substantial change of around 20%.Subsequently, betweent=0.8 s and 1.2 s, the total volume change became minimal due to the bursting of large bubbles, resulting in minor variations of approximately 1%.The microstructure inside the microfluidic chip facilitated the bursting of these large bubbles.Figure 9(a) provides a visual representation of the analysis,depicting the changes in total volume and gas bubble volume over time.
In Fig.9(b), the relationship between the volume of gas bubbles and the total fluid volume in the microfluidic chip is depicted,along with the interpolated results.The analysis indicated that initially, betweent=0.01 s and 0.8 s, there was a linear increase in the ratio of gas bubble volume to total volume, reaching its peak at 0.25.Subsequently, aftert=0.8 s,when the larger bubbles burst, the ratio decreased and stabilized at 0.22.The ratio exhibited minimal variations during the period from 1.2 s to 1.8 s, remaining relatively constant.Subsequently,as the volume of gas bubbles increased,the vortex within the chip intensified, resulting in improved mixing efficiency and enhancing the overall mixing process.
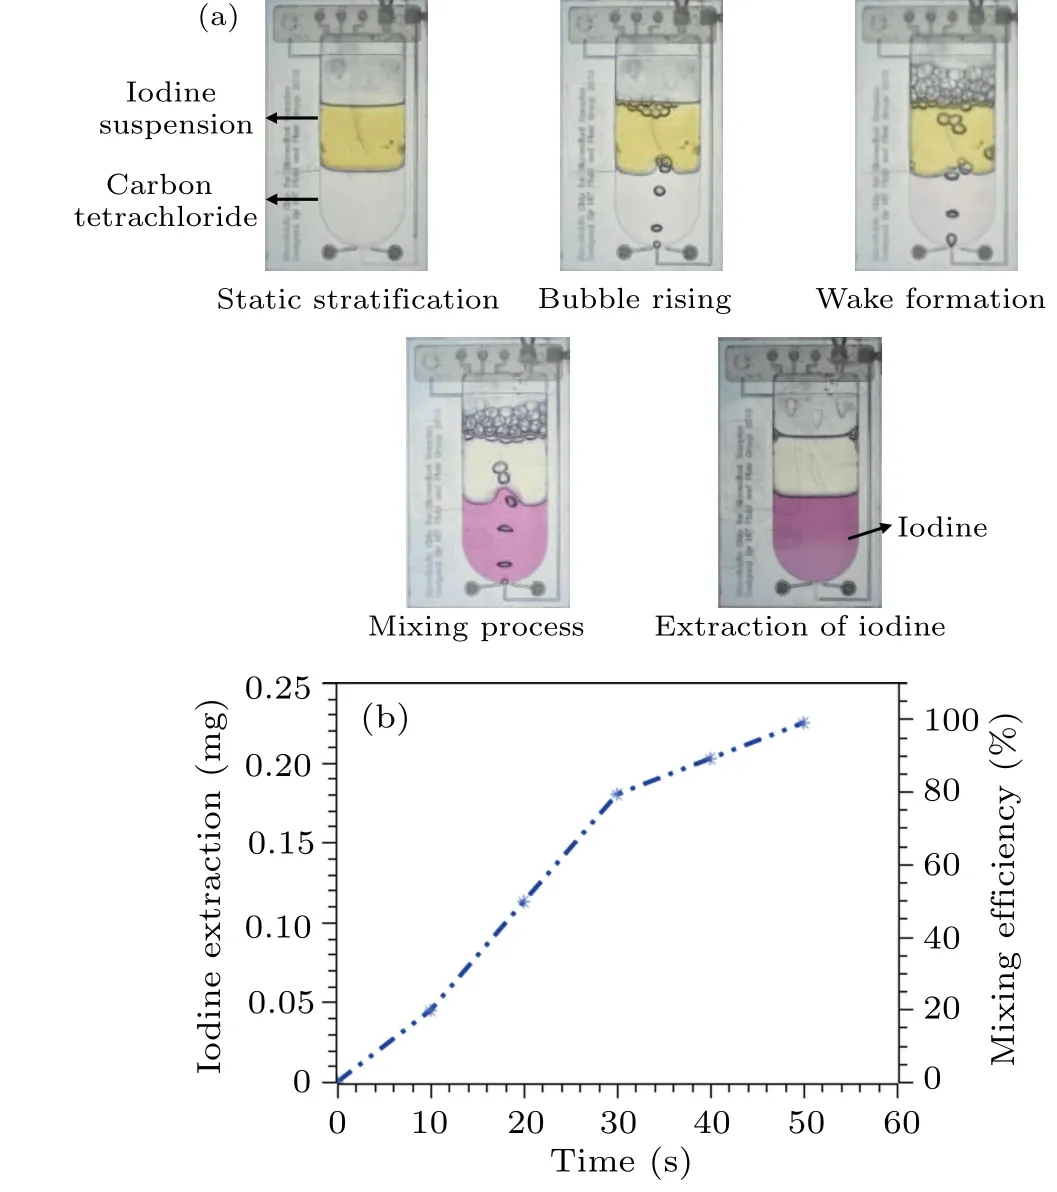
Iodine suspension liquid with a 0.35-g/liter concentration is used as an extraction sample at ambient temperature.0.75 ml sample is added inside the microfluidic chip to extract elemental iodine using carbon tetrachloride.After adding both solvents,two visibly different layers of liquid are formed inside the microcavity, as shown in Fig.10(a).The digital pressure regulator provided the precise pressure of 4 kPa at the bottom inlet of the microfluidics chip to generate the gas bubbles inside the microcavity.At the beginning of the gas bubble generation (t= 0.5 s), gas bubble formation started and rose towards the top of the microcavity,mixing both layers of liquid.While moving upward, bubbles generated a wake behind,and heavy particles of carbon tetrachloride also moved up following the wake of bubbles.Subsequently, carbon tetrachloride comes down along with elemental iodine particles.Due to continuous bubble generation inside the microcavity, the two liquid layers are disturbed.Within ten seconds of the gas bubble mixing, about 20%–25% elemental iodine moved in the lower layer, which can be observed in the color change.This color change was detected and analyzed using image processing techniques.The colour analysis methods utilized in image processing involved extracting quantitative information from the images to assess the colour change.Initially, image quality was enhanced using noise reduction and colour calibration.The colour thresholding can segment the image, isolating the regions corresponding to the iodine containing layers.The colour features were extracted from the segmented regions of interest (ROIs) to quantify the colour change.Comparing colour histograms before and after mixing provides a quantifiable measure of colour distribution changes,assessing the efficiency of iodine extraction.The extracted colour features were then analyzed to quantify the iodine extraction efficiency.After 30 s, it appeared that most of the iodine had moved to a lower layer which can be noted during the color change analysis.Based on these observations and the subsequent analysis, the iodine extraction efficiency within the microfluidic chip was measured using data analysis and image processing to determine the color change and quantify the iodine extraction efficiency.The complete color change from transparent to purple took almost 50 s under continuous bubble generation.The iodine extraction efficiency inside the microfluidic chip is shown in Fig.10(b).
4.Conclusion
The study demonstrates bubble mixing properties employing a microfluidic mixer for elemental iodine extraction using carbon tetrachloride.The microfluidic mixer possesses a distinctive edge for regulating the process of micro-mixing and extraction using precisely controlled gas bubbles.This trait makes it highly valuable for delivering automated processes.It is rapidly suitable for numerous biomedical and chemical analyses,such as gene detection,point-of-care diagnostics and drug delivery.Hence,microfluidic mixers save significant time and cost by minimizing laboratory processes and enhancing their portability and accessibility.The microfluidic mixers may also be used for chemical processes requiring gaseous molecules to function as catalysts.According to the simulation and experimental results, gas bubble mixing is an active process where the impact of the bubbles on mixing is evident from the liquid’s volume increase, deformation, and ascent.The results also quantitatively demonstrate the characteristics between pressure and bubble formation rate.It is observed that the rate of bubble formation initially increases with the rise of intake pressure and subsequently decreases as intake pressure increase, creating a low-pressure zone behind them.Like geese flying formation,the gas bubbles in the back exploit this area of low pressure to minimize resistance during ascent considerably.Furthermore,microfluidic chip-based micro-mixing of a regulated gas bubble is accomplished by liquid-liquid extraction of elemental iodine.Because of the potential for samples to overflow inside the microfluidic chip due to the rapidly moving bubbles caused by the increased pressure,precautions should be taken.In conclusion,gas bubble micro-mixing is a powerful and versatile mixing technique for microfluidic systems, offering non-invasive and effective mixing for various biochemical applications.Likewise,investigations should be conducted to study viscosities’ effect on bubble mixing in various biochemical analyses.
Acknowledgements
Project supported by the National Natural Science Foundation of China (Grant No.51175101).The authors would also like to acknowledge the help from other HIT Fluid and Flow Group members.

- Chinese Physics B的其它文章
- Optimal zero-crossing group selection method of the absolute gravimeter based on improved auto-regressive moving average model
- Deterministic remote preparation of multi-qubit equatorial states through dissipative channels
- Direct measurement of nonlocal quantum states without approximation
- Fast and perfect state transfer in superconducting circuit with tunable coupler
- A discrete Boltzmann model with symmetric velocity discretization for compressible flow
- Dynamic modelling and chaos control for a thin plate oscillator using Bubnov–Galerkin integral method