
Quantitative Detection of Corrosion State of Concrete Internal Reinforcement Based on Metal Magnetic Memory
2023-12-11 11:25ZhongguoTangHaijinZhuoBeianLiXiaotaoMaSiyuZhaoandKaiTong
Zhongguo Tang ,Haijin Zhuo ,Beian Li ,Xiaotao Ma ,Siyu Zhao and Kai Tong,★
1Guangxi Xinxiang Expressway Co.,Ltd.,Nanning,530000,China
2College of Civil Engineering,Chongqing Jiaotong University,Chongqing,400074,China
ABSTRACT Corrosion can be very harmful to the service life and several properties of reinforced concrete structures.The metal magnetic memory (MMM) method,as a newly developed spontaneous magnetic flux leakage (SMFL)non-destructive testing (NDT) technique,is considered a potentially viable method for detecting corrosion damage in reinforced concrete members.To this end,in this paper,the indoor electrochemical method was employed to accelerate the corrosion of outsourced concrete specimens with different steel bar diameters,and the normal components Bz and its gradient of the SMFL fields on the specimen surfaces were investigated based on the metal magnetic memory (MMM) method.The experimental results showed that the SMFL experimental Bz curves are consistent with the analytical results of the theoretical model.Furthermore,the crest-to-trough behavior on the Bz signal curve and its zero-point gradient spacing can more accurately indicate the corroded area’s extent.Then,a magnetic characteristic parameter W based on a large amount of experimental data was established to characterize the degree of corrosion of the steel bars.The magnetic characteristic parameter W is linearly related to the maximum cross-sectional area loss rate η of the corroded reinforcement.This paper will lay the foundation for future research on corrosion detection of reinforced concrete structures based on the MMM method and provide a feasible way for non-destructive detection of corrosion independent of the influence of reinforcement diameter and magnetization history.
KEYWORDS Reinforcing steel;metal magnetic memory (MMM) method;spontaneous magnetic flux leakage (SMFL);nondestructive testing;local corrosion
1 Introduction
Reinforced concrete structures are widely used in civil engineering because of their strength,durability,good moldability,fire resistance,steel saving,low cost,etc.However,the problem of corrosion of reinforcing bars causes premature failure of reinforced concrete structures,which seriously affects the service life of reinforced concrete structures [1].Studies have shown that the corrosion of reinforcing bars leads to the attenuation of structural seismic capacity [2],the deterioration of the mechanical properties of reinforcement [3],the deterioration of bond strength between reinforcement and concrete [4],the cracking and spalling of the concrete protective layer and the reduction of effective area of reinforcement [5].As a result,reinforcement corrosion becomes an important factor affecting the safety and durability of reinforced concrete structures.The literature [6] showed that since reinforcement corrosion also significantly reduces the load-carrying capacity of beams and ultimately affects the service performance of RC structures,detecting reinforcement corrosion inside concrete has become an important task.Researchers often use several NDT methods between electrochemical,physical,and analytical methods.These NDT methods mainly include the half-cell potential method [7],ultrasonic waveguide method [8],X-ray tomography[9-11],infrared thermography [12],Acoustic Emission [13],Eddy current detection [14],metal magnetic memory(MMM) [15],etc.
The metal magnetic memory(MMM)method,proposed by Russian scholar Dubov in 1997,is based on the phenomenon of irreversible changes of magnetic domains in ferromagnetic materials in the region of stress,deformation,and dislocation concentration under the action of a geomagnetic field.It does not need an artificial external magnetic field and is pollution-free and easy to operate.It is rapidly developing because of its advantage of detecting both macroscopic defects and microscopic damage caused by stress concentration [16].Therefore,based on the SMFL effect of the MMM method,scholars have conducted essential studies on the detection of steel corrosion.Qiu et al.[17] investigated the correlation between spontaneous magnetic flux leakage (SMFL) and the bending strength of corroded RC beams.The experimental results were consistent with those predicted by theory.They showed the semi-quantitative correlation that NBP(x) was related to NBS exponentially (without stirrups) or approximately linearly(with stirrups).Therefore,the bending strength can be estimated semi-quantitatively via the SMFL curves.Zhao et al.[18] based on the spontaneous magnetic flux leakage detection technique,the linear rate of change of the tangential component curve of the leakage signal generated by the corrosion of reinforcing bars is investigated and compared with the “rust-magnetic fluctuation parameter” for reinforcement clad concrete samples of different reinforcement diameters.A new data processing method is provided for the non-destructive testing of steel corrosion using the spontaneous magnetic flux leakage effect,which can effectively reduce the influence of steel bar diameter on magnetic flux leakage signal and improve the precision of non-destructive testing technology of steel bar corrosion using the metal magnetic memory effect.Zhang et al.[19] proposed a new principle for judging buried steel bar corrosion tests based on spontaneous magnetic flux leakage.The results showed that the elevation height associated with the reversal point could be used as a judgment criterion to assess steel bars’ corrosion degree and corrosion area.To solve the problem of quantitative detection of corroded reinforced concrete of different sizes,Yang conducted a quantitative detection test on reinforced concrete samples based on SMFL [20].The results show that the thickness of the concrete cover influences the magnetic indicator by affecting the lifting height z.The effect of rebar diameter on the quantitative detection can be eliminated by describing the degree of corrosion and the average section loss rate α.The effect of rebar length on quantitative detection is unclear.Yang et al.[21] based on the test data,an index “K” was established,and the test index “K” was linearly related to the corrosion degree of the reinforcement.Xia et al.[22] proposed a new calculation method to determine the corrosion of steel strands quantitatively and non-destructively by analyzing the SMFL signal of steel strands.Su et al.[23] conducted HCF tests with local corrosion for the Q345qD bridge steel sheet specimens.The experimental results show that the mutational crest (or trough) and the crest-trough (or trough-crest) behavior on the curves of the H-SF(y)signal and its gradient K can accurately indicate the range of corroded region and locate fatigue crack position.Xia et al.[24] proposed a probability evaluation method for the cable corrosion degree in association with the Bayesian model.the evaluation index ‘X’ was expressed based on the magnetic dipole model of self-magnetic flux leakage (SMFL),and corrosion detection experiments were carried out on both steel strands and wires.The positive correlation between ‘X’ and the cross-sectional loss ‘a’ was quantified by four different levels.In turn,the evaluation criteria for the corrosion degree of cable structures were obtained.Zhou et al.[25] proposed a non-destructive testing method to evaluate the residual bending strength of corroded reinforced concrete beams by analyzing the SMFL signal.HS(z)can be used to determine the location and degree of reinforcement corrosion qualitatively,and the gradient K of HS(z) is approximately linearly related to the loss rate S of bending strength,which can be used to evaluate the residual bending strength of corroded reinforced concrete beams.Qiu et al.[26] based on the dynamic linkage mechanism of the induced magnetic field and SMFL field of the reinforcement,a nondestructive quantification method of the local corrosion cross-sectional area of the reinforcement is proposed.Verified by experimental and finite element simulation data,the quantification method can eliminate the adverse effect of the difference in magnetic properties of the reinforcement.The results show that different quantitative indices for corrosion evaluation can be created based on the method.The indices created by two transformations with the same geometrical characteristics have better quantitative capabilities.
At present,SMFL technology is mainly used for qualitative and quantitative detection of a steel bar of a certain diameter.However,in actual components,the steel bars in the concrete often have different diameters,and the diameter change of the steel bars will affect the quantitative corrosion of reinforced concrete.Therefore,to realize the quantitative detection of corrosion of different steel bar diameters,the influence law of steel bar diameter changes on corrosion and spontaneous flux leakage signals should be studied.
2 Experimental Overviews
2.1 Test Materials
HRB400 hot-rolled deformed bars and C30-strength concrete were selected to prepare wrapped concrete specimens with different reinforcement diameters in this experiment.As shown in Fig.1,all the specimens are square cross-sections,the concrete protective layer thickness is 25 mm,the reinforcement length is 500 mm,and the encapsulated concrete length is 300 mm.The test-selected reinforcement diameters are 12,16,18,20,and 25 mm,divided into five groups,each group of 10.Five group reinforcementencapsulated concrete specimens are numbered as follows in Table 1.

Figure 1:Reinforced concrete specimens:(a) Illustration of the dimensions of reinforced concrete specimens;(b)Specimen casting;(c) Finished specimens

Table 1:The diameter of the reinforcement and the number of the specimen
2.2 Specimen Rusting Process
The laboratory adopted the method of electrochemistry accelerating corrosion [27] to obtain different corrosion loss qualities of reinforced concrete specimens according to the magnitude and duration of the current flowing inside the reinforcement.Fig.2 shows the electrochemical corrosion setup,where the positive terminal of the DC power supply is connected to the reinforcement at one end of the concrete specimen,and the negative terminal is connected to the carbon rod during the corrosion process.A towel moistened with 5% NaCl solution was wrapped around the middle 10 cm area of the carbon rod and the reinforced concrete specimen to form a closed circuit as the rusting area,which was used to accelerate the rusting by local electrochemistry and to facilitate the comparison of the rusting degree between different steel bars.

Figure 2:Electrochemical corrosion device:(a) Schematic diagram of corrosion connection;(b) Physical drawing of corrosion device
The test specimens of 5 groups of different steel bar diameters,ten specimens of each group were set with different increases of rust degree,i.e.,all 50 specimens of the test were preset with different rust degree targets,the rust current I of all specimens was set to 1.09 A DC,and different rust degrees were controlled by different rust times only,the relevant rust parameters are shown in Appendix.T is the preset specimen rust the required duration,Δm is the rust loss mass/g,and the formula shown in Eq.(1) is the calculation formula.
where I is the average current intensity/A,T is the rust duration/s,F is the Faraday constant,F=96484(C/mol),M is the initial rebar mass,and n is the valence of the metal.
2.3 Spontaneous Magnetic Flux Leakage Intensity Detection Process
The spontaneous magnetic flux leakage intensity acquisition device used in this research is shown in Fig.3.The device is divided into three parts:a three-axis mechanical displacement system,a control cabinet,and a control computer.The three-axis mechanical system is divided into X,Y,and Z directions to realize the movement of the HMR2300 magnetic probe,and the displacement accuracy of each direction is 0.1 mm.The range of the HMR2300 magnetic probe is ±2 Gs,and the detection accuracy is 67 μGs.The control cabinet contains a serial server connecting the three-axis mechanical displacement system and the control computer.The control computer outputs the operation command flow and saves the spontaneous magnetic flux leakage intensity data.This way,the accurate acquisition of spontaneous magnetic flux leakage signal can be realized.

Figure 3:Spontaneous magnetic flux leakage intensity acquisition device
After each reinforced concrete specimen reached the target of corrosion degree,spontaneous magnetic flux leakage intensity scanning was carried out using the above device.The scanning path direction is along the length of the reinforcement,and the area is 500 mm longitudinal length of the specimen.The scanning position is above the center line of the longitudinal axis of the specimen.Five lifting heights(LFH)are set,50,100,150,200,and 250 mm.The scanning speed is 400 mm/min,and the spontaneous magnetic flux leakage intensity acquisition path is shown in Fig.4,where the X-axis is the longitudinal direction of the specimen.
According to the literature survey,it is found that the tangential component Bxand the normal component Bzof the spontaneous magnetic flux leakage of the corroded steel bar show a good change rule along the axis (X-axis).Therefore,the normal component Bzis selected for analysis in this paper.

Figure 4:Path diagram of test spontaneous magnetic flux leakage intensity acquisition
3 Analysis of Experimental Results
3.1 Analysis of Rust Experimental Results
3.1.1 Area of Rust Spots on Outsourced Concrete Specimens
Since 50 outsourced concrete specimens showed the same pattern in the rusting process,specimen 12-2#was selected as a representative for analysis and illustration.As Fig.5 shows,comparing the four surfaces of specimen 12-2#,it is found that the area of rust spots on the left and right sides is more obvious,while the area of rust spots on the upper and lower surfaces is less.

Figure 5:Surface corrosion of specimen 12-2#:(a)Upper surface;(b)Lower side;(c)Left side;(d)Right side
This is because NaCl solution infiltration of reinforced concrete specimens is a slow-acting process,and the concentration of NaCl solution on the upper surface of the outsourced concrete specimens is the largest,the resistivity is the lowest,and the corrosion of the reinforcement is the most serious.The farther away from the negative pole,the greater the resistivity of the reinforcement and the lower the degree of rusting.The rust swelling cracks mainly appeared on the concrete specimen’s left and right sides.With the extension of the cracks,the rust swelling products slowly overflowed and accumulated from the cracks,resulting in many rust spots on the two sides of the final specimen.
According to the difference in rust time of the specimens in the experimental process,the outsourced concrete specimens produce different degrees of rust area,as shown in Fig.6,the specimens of outsourced concrete with the same diameter reinforcement:25-5#,25-7#,and 25-10# were selected for comparison.As the number of specimens changes from 5,7 to 10,the rust spot area also develops from less to more.And 25-7# specimens showed obvious rust expansion cracks compared to 25-5# specimens,while the width of rust expansion cracks became larger for 25-10#specimens.

Figure 6:Surface rust spots of specimens with different rusting times:(a) 25-1#;(b)25-5#;(c) 25-10#
It can be seen from Fig.6 that with the increase of corrosion degree,the rust spot area also increases,which shows the apparent correspondence between the internal reinforcement corrosion and the change of the rust spot area on the outer surface of the specimen.The actual corrosion degree of the three specimens corresponding to the internal reinforcement is slight,medium,and severe.
3.1.2 Internal Steel Bar Corrosion Degree
To further observe and analyze the actual corrosion of the internal reinforcement,the specimens were broken,and the internal reinforcement was removed after the corrosion of reinforced concrete wrapped specimens were completed,and the natural corrosion products on the surface of the reinforcement were removed with dilute oxalic acid solution and dried.As Fig.7 shows,the internal reinforcement corrosion of the five groups of specimens is demonstrated.From Fig.7,almost all specimens’ surfaces showed traces of rusting.Still,from the ends of the rebar in the 25 mm rebar diameter specimen group,almost no or very little rusting occurred compared to the other four groups of rebar.The diameter of the reinforcement at the location of corrosion in each group decreased gradually with the increase of the number of specimens,i.e.,the increase of the corrosion time and the corrosion defects showed more and more pronounced “V” shape,and the 12-10# reinforcement broke due to severe corrosion.Similarly,compared with the other four reinforcement groups,the corrosion position of 25-10 # reinforcement with the highest degree of corrosion in the 25 mm reinforcement group shows apparent “V-shaped” corrosion damage.

Figure 7:Five groups of specimens’ internal reinforcement corrosion
It can be seen from Fig.7 that with the increase of the corrosion time,the corrosion degree of the reinforcement increases,making the diameter of the reinforcement in the corrosion area gradually decrease.However,due to the local electrochemical accelerated corrosion method,the corrosion area of the reinforcement is mainly concentrated in the middle area of the reinforcement covered by the moist towel.The higher the resistance of the reinforcement farther away from the negative pole in the specimen[21].The NaCl solution needs to be infiltrated for a longer time in the corrosion process,which makes the corrosion degree of the reinforcement far away from the negative pole smaller.Then the “V”-shaped rust defects are formed and extend from the middle to the ends of the bars.The intuitive rust defects of the 25 mm rebar group were not prominent compared to the other four groups,indicating that the larger the original diameter of the rebar,the smaller the relative change in rebar diameter due to rusting.
To quantitatively characterize the degree of corrosion of the reinforcement,the diameter at the smallest section of the corrosion area of each reinforcement was examined.Fig.8 shows the distribution of diameter changes of the five groups of rebar specimens at different corrosion stages.The graph indicates that as the corrosion duration increases,the rebar’s corrosion degree increases,and the damage to the corroded area of the rebar increases,which visually shows the decrease in the diameter of the rebar.And it is found that,for example,in the 12mm rebar group,12-10#is smaller than half of the minimum cross-sectional diameter of 12-1#rebar,while 25-10#in the 25 mm rebar group is only slightly smaller than the minimum cross-sectional diameter of 25-1# rebar.This indicates that the smaller the original diameter of the rebar,the greater the damage caused by rust.

Figure 8:Distribution of diameter of the corroded area of reinforcement
To quantitatively characterize the corrosion damage of the reinforcement,the maximum cross-sectional area loss rate η of corrosion is introduced to reflect the actual corrosion of the reinforcement specimen and is defined in Eq.(2)as follows:where D is the diameter of the specimen before rusting(mm)and d is the diameter of the smallest section of the specimen after rusting(mm).
Fig.9 is the variation curve of the maximum cross-sectional area loss rate η for different diameters of reinforcing steel specimens,and the horizontal coordinates are the specimen number.From Fig.9,overall,the η values of reinforcing bars increase with the increase of specimen number.The smaller the reinforcement diameter,the greater the variation of η value and the greater the variation of corrosion degree.It can also be seen from Fig.9 that the overall corrosion degree of reinforced concrete specimens in the 12,16,and 18 mm diameter groups is higher,and the corrosion degree of 20 and 25 mm reinforced concrete specimens is smaller.

Figure 9:Change curve of maximum cross-sectional area loss rate η of 5 groups of specimens
This is because the rust oxide produced by the reinforcement’s corrosion will squeeze the concrete’s outer layer,resulting in cracking or even damage to the concrete specimen.Larger diameter rebar is more likely to cause cracking of the outer layer of concrete due to the relatively large surface area and the wide distribution of the corrosion oxide produced.However,the larger the diameter of the reinforcement,the lower the rate of local rust damage produced in the radial direction of the reinforcement,so the reinforced concrete specimens with diameters of 20 and 25 mm designed in this test have less corrosion degree.
3.2 Analysis of Spontaneous Magnetic Flux Leakage Test Results
3.2.1 Spontaneous Magnetic Flux Leakage Intensity Variation Law on the Surface of the Specimen before Rusting
Due to the inevitable residual stress in the production and transportation of steel bars,coupled with the long-term action of the geomagnetic field,the steel bars will spontaneously magnetize and show magnetic properties,even if there is a certain weak magnetic field in and around the steel bars (called Demagnetization field),the magnetic field lines of the demagnetization field point from the north pole to the south pole in the air,and from the south pole to the north pole inside the steel bar,thus forming a complete closed curve.However,for a corroded steel bar,a gap is formed at the corroded place due to the reduction of the cross-sectional area,and the magnetic permeability at the gap changes from the high magnetic permeability of the original iron to a low air magnetic field.The discontinuity of the rate leads to the formation of a leakage magnetic field at the gap,and the direction of the leakage magnetic field is opposite to the direction of the demagnetization field,as shown in Fig.10.
The SMFL is affected by the magnetization history and the initial magnetization state,so to visually and accurately study the variation of the SMFL signal,the following Bzsignals are after subtracting the background magnetic field.To better represent the effect of corrosion on the spontaneous leakage magnetic field,we unified the direction of the X-Bzcurve so that the left side is all positive field strength,and the right side is all negative field strength.As Fig.11 shows,in the five steel bar specimens before rusting X-Bzvariation curves,the horizontal coordinate X denotes the scanning distance along the length direction of the specimen,and the graph includes the curves at five detection lifting heights.It can be obtained from Fig.11 that the specimens with different steel bar diameters obtained from the X-Bzcurves have a consistent variation pattern.As the value of X increases,the Bzvalue gradually decreases,and the X-Bzcurves show a monotonically decreasing variation pattern.Moreover,the curves of the same specimen with different lifting heights intersected at a point,and the intersection point was located approximately near the midpoint of the specimen.X-BzWith the increasing lifting height,the variation range of the left and right ends of the curve gradually decreases,and the curve shows a counterclockwise rotation.

Figure 10:Schematic diagram of magnetic field distribution of corroded and non-corroded rebars

Figure 11:X-Bz curves of uncorroded specimens:(a)-(e) X-Bz curves before rusting for five diameters of representative specimens
Due to the difference in initial magnetization intensity between different steel bar specimens,there is a difference in the area of variation of values of Bzin Figs.11a-11e.The uniformity of the change law of X-Bzcurves shows that the diameter of the rebar specimen does not strongly influence the spontaneous magnetic flux leakage intensity.The magnetic induction curve on the surface of the rebar specimen is a closed curve leading from one end to the other.The closer to the surface of the rebar,the denser the magnetic induction curve is,and the greater the detected spontaneous magnetic flux leakage intensity is.Moreover,among the spontaneous magnetic flux leakage intensity at both ends of the rebar,the vector Z-direction Bzis the largest,and the one at the midpoint of the rebar Bzis the smallest,so the X-Bzcurve forms a monotonically decreasing trend in which the absolute value of Bzat the midpoint is the smallest.
3.2.2 The Change Law of Spontaneous Magnetic Flux Leakage Intensity on the Surface of the Specimen after Rusting
As Fig.12 shows,the post-corrosion X-Bzcurves of the specimens with different rust times for the 18 mm steel bar diameter group are shown.The rusted X-Bzcurve is also processed uniformly in the direction of positive field strength at the left end and negative field strength at the right end.All the curves in Fig.12 show a similar law,and the Bzvalue of curves obtained for specimens with different rust times still shows an overall decreasing trend as the X value increases.The apparent change compared with the curve before rusting is that the curve has a trough at the left end and a crest at the right end in the rusting area (X=400~500 mm),i.e.,the “trough-crest (or crest-trough)” phenomenon.And the“trough-crest (or crest-trough)” phenomenon is most obvious when the lifting height is 50 mm.With the increasing lifting height,the crest-trough phenomenon becomes weaker and weaker.
Compared with the uncorroded curve,after corrosion,the“trough-crest(or crest-trough)”phenomenon appears in the corroded area,indicating that the area between the “trough-crest (or crest-trough)” is the corroded area of the internal reinforcement.Since the intensity of the leakage magnetic field decreases with the increase of the Z value in the corrosion area of the reinforcement,the higher the lifting height,the less the influence of the leakage magnetic field,the “trough-crest (or crest-trough)” phenomenon is also weaker.In addition,due to the difference in initial magnetization between different reinforcement specimens,there is a difference in Bzvalue amplitude in Figs.12a-12f.
As Fig.13 shows the post-corrosion X-Bzcurves of the specimens with different rust times for the 20 mm steel bar group.The curves for the 20 mm group have a similar law to that of the 18 mm group,i.e.,the curve also shows the “trough-crest (or crest-trough)” phenomenon at the rusting location.Similarly,all the X-Bzcurves for LFH=50 mm have a maximum or minimum value near the end of the reinforcement.This is due to the irreversible effect of the residual stresses formed during the cutting process on the SMFL of the reinforcement [23].
As shown in Fig.14,the X-Bzcurves of representative specimens with slight and moderate rust are taken from five groups of specimens with different steel bar diameters.From Fig.14,the rusting X-Bzcurves of specimens with different diameters and degrees of corrosion show the phenomenon of “trough-crest (or crest-trough)” in the corrosion area,but the magnitude is different.
The“trough-crest(or crest-trough)”behavior appears in the corrosion areas of the curves for different steel bar diameters of the specimens,indicating that the“trough-crest(or crest-trough)”behavior can be used to determine the corrosion location of the internal reinforcement and cannot be affected by the diameter of the rebar.In addition,because the initial magnetization intensity and magnetization history of different rebar specimens are different,their corresponding Bzcurve amplitudes are also different.
4 Discussion
4.1 Validation of V-Shaped Magnetic Dipole Model
After the corrosion of steel bars,corroded notches will appear on the surface.When they are subjected to the geomagnetic field,their internal part will also generate a uniform induced magnetic field due to selfmagnetization.However,due to the change of geometry,the magnetic permeability of the corroded notch will jump,the magnetic field strength will be distorted,and the magnetic field will “leak out” at the notch,which is the so-called spontaneous magnetic leakage phenomenon[28].
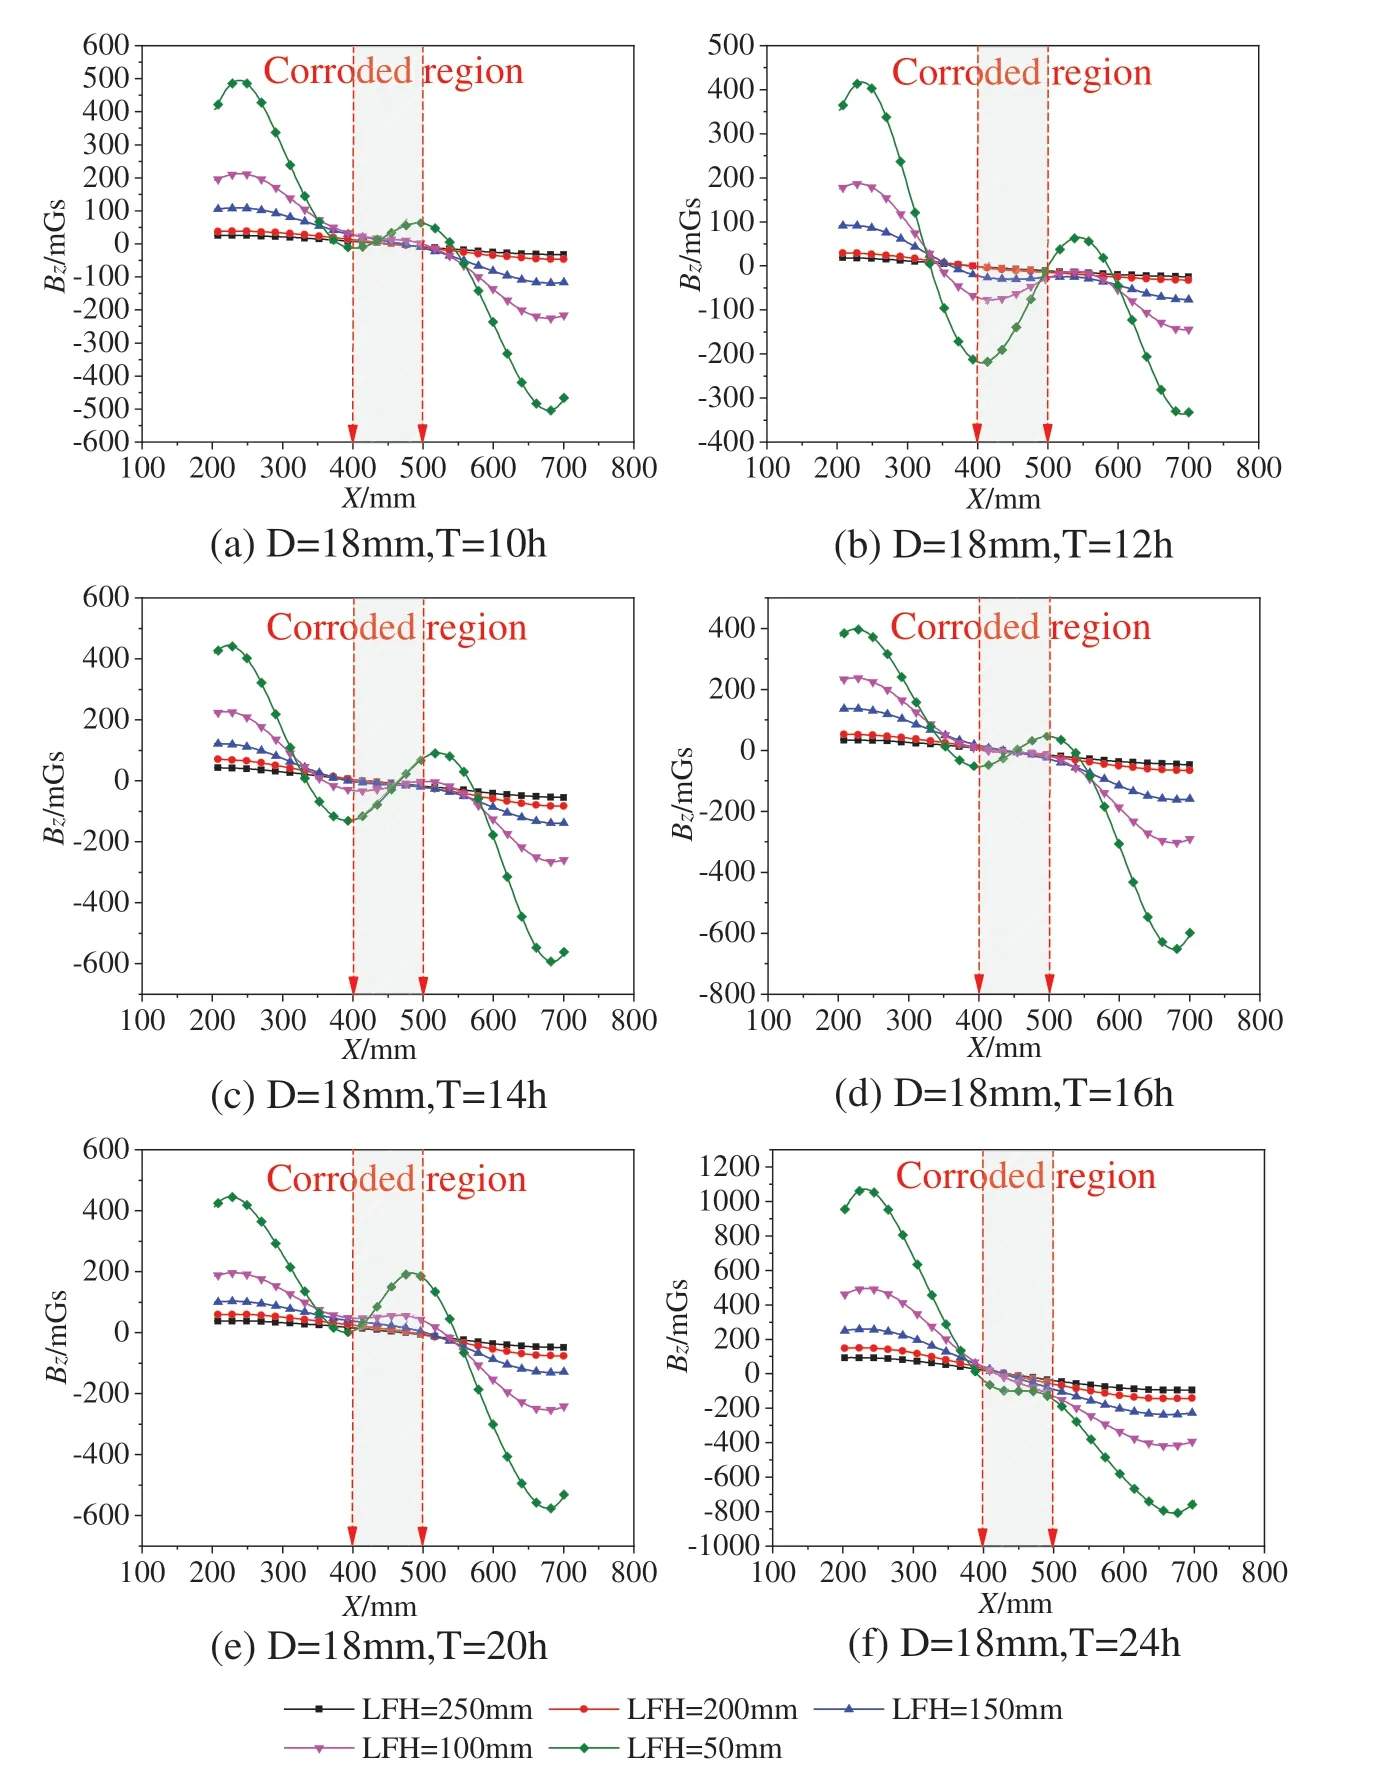
Figure 12:Bz curve of corroded specimens:Bz signal after rusting of representative 18 mm diameter specimens’ curve
The corrosion defect caused by electrochemical corrosion is different from natural corrosion in that the resistance of the reinforcement is higher the farther away from the negative pole in the specimen.Therefore,the NaCl solution needs to be infiltrated for a longer period in the corrosion process,which makes the corrosion degree of the reinforcement far from the negative pole smaller.Therefore,the rust defect approximates a “V-shaped groove” with a size of 2b × h,and the mechanism diagram of the “V-shaped”notch is shown in Fig.15.
A magnetic dipole is a magnetic system consisting of a pair of heterogeneous equivalent point charges.When a defect such as a pit or a cavity exists on the surface of a magnetized ferromagnetic component,a leaking magnetic line of force is generated on both sides of the defect,which leaves one side of the defect and reaches the other side of the defect to form a small-scale magnetic pole.This small magnetic pole can be approximated as a pair of equal magnetic charges of opposite polarity,which can be simulated by the equivalent magnetic dipole model to simulate.
Fig.16 is a magnetic dipole model of a two-dimensional V-shaped corrosion defect shape.It is assumed that magnetization makes the two sides of the V-shaped groove form two magnetic charge surfaces.It is assumed that the surface magnetic charge with opposite polarity and equal density is uniformly distributed on the magnetic charge surface,and it is assumed that there is no magnetic charge distribution at the notch and other parts.According to the magnetic charge theory of electromagnetic field,the magnetic charge density ρscan be expressed as:
where M denotes the magnetization intensity vector,µrdenotes the relative permeability,and HmLdenotes the effective magnetic field for spontaneous magnetization of the ferromagnetic member.

Figure 14:Bz curve of corroded specimens:Bz signal curve of representative specimens after rusting of different diameters

Figure 16:Magnetic dipole model of two-dimensional V-shaped rust defect shape
The internal material of the reinforcement bar is uniform,and the magnetic charge density ρ=-∇·M=0 in the uniform magnetic medium at the non-corroded defect part.Then the magnetic field at any point P (x,z) in the space is generated by the surface magnetic charge with depth η as the center,width dη,and magnetic charge density ρson the groove walls on the left and right sides,which is[29]:
The magnetic field intensity components Hxand Hzcan be integrated for dHx=dH1x+dH2xand dHz=dH1z+dH2z,along with the depth of the rust defect as follows:
where:ρsis the magnetic charge density,dsis the surface element on the boundary of the rust defect,µ0=1.0 is the vacuum permeability,b is half the width of the rust defect,and h is the depth of the rust defect.
Since the magnetic signal Bzcollected after corrosion is the coupled magnetic field strength of the geomagnetic field,the induced magnetic field,and the leakage magnetic field.The magnetic signal collected before corrosion is the coupled magnetic field strength of the geomagnetic field and the induced magnetic field.During the test of spontaneous magnetic flux leakage signal acquisition,the background magnetic field can be considered constant by keeping the surrounding environment unchanged.So,for the same specimen,using the post-rusting Bzmagnetic signal after rusting minus the magnetic signal before rusting Bzmagnetic signal to obtain the leakage magnetic field strength Bz′.As shown in Fig.17a shows a plot of the paraxial variation of the leakage magnetic field strength of specimens 12-10# (X-Bz′ curve).At the same time,to verify whether the test results match the theoretical results,according to Eq.(6),the normalized curve of the theoretical normal leakage flux density Hzis obtained,as shown in Fig.17b.

Figure 17:Normal leakage magnetic intensity curve:(a) Bz′ curve of specimen 12-10#;(b) Theoretical normalized Hz curve
Comparison Fig.16 the experimental and theoretical X-Bz′ curves show similar curve shapes.Both curves show the phenomenon of “trough-crest (or crest-trough),” i.e.,the maximum and minimum Bz′values of magnetic signal appear in the corroded area (X=400~500 mm),while there is no similar phenomenon in the uncorroded area.In addition,there is a difference between the two.The two sides of the experimental X-Bz′curve did not converge to zero.
The appearance of the magnetic signal maximum and minimum Bz′values of the steel bar corrosion area indicate that there is an inevitable connection between the magnetic leakage signal and the corrosion of the reinforcement.The two sides of the experimental X-Bz′curve do not converge to zero,which the end effect of the steel bar may cause.The similar trend of the theoretical X-Bz′curve obtained from the V-shaped magnetic dipole model and the experimental X-Bz′ curves proves that the magnetic dipole model for V-shaped rust defects is reliable.
4.2 Finite Element Simulation Analysis
4.2.1 Build the Model
The numerical simulation analysis of the magnetic flux leakage signal detection under different corrosion depths of corroded steel bars is carried out by using COMSOL finite element software.First,select “Magnetic Field No Current” under the AC/DC module as an interface,preset a steady-state study of physical field variables that do not change with time,and establish a 3D model with a model length of 50 cm.Next,set the ambient magnetic field to 600 mGs,which is 48 A/m.The established simulation model is a V-shaped corroded steel bar model,and an air domain of 1 m × 0.4 m × 0.8 m is established at the V-shaped groove gap of the steel bar to limit the solution range of the leakage magnetic field,as shown in Fig.18.
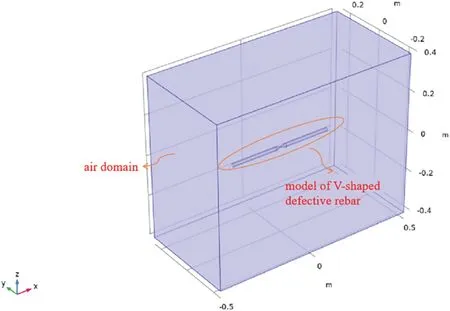
Figure 18:Rebar model and air domain for V-shaped corrosion defect
Since the calculation results of the simulation models of steel bars with different diameters are very similar,this paper only shows the corrosion simulation model of the bare steel bar with a diameter of 20 mm,and the maximum corrosion depth is set to 0.8 cm.The geometric parameters of the model are shown in Table 2,and the model is shown in Fig.19.
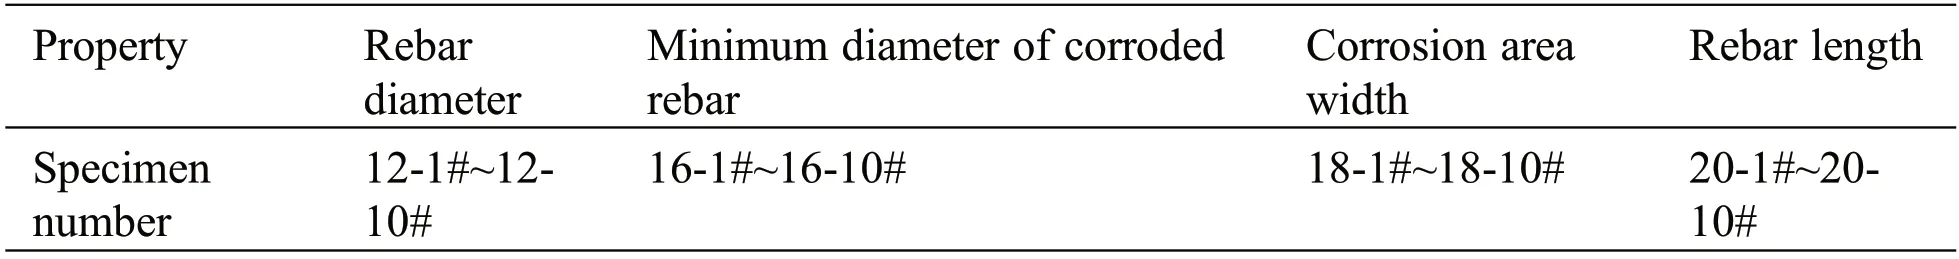
Table 2:Geometric parameters of the model
4.2.2 Analysis of Simulation Results
The steel corrosion depth h is set as the only variable,and the rest of the geometric parameters of the model remain unchanged.Set 5 lift-off heights of 50,100,150,200,and 250 mm.All paths are projected on the x-y plane and coincide with the X axis (y coordinate values are all zero),x ∈[-0.5,0.5 m].The Bzcurves corresponding to different rust depths h are shown in Fig.20.

Figure 19:Model and grid distribution of V-shaped corroded rebar
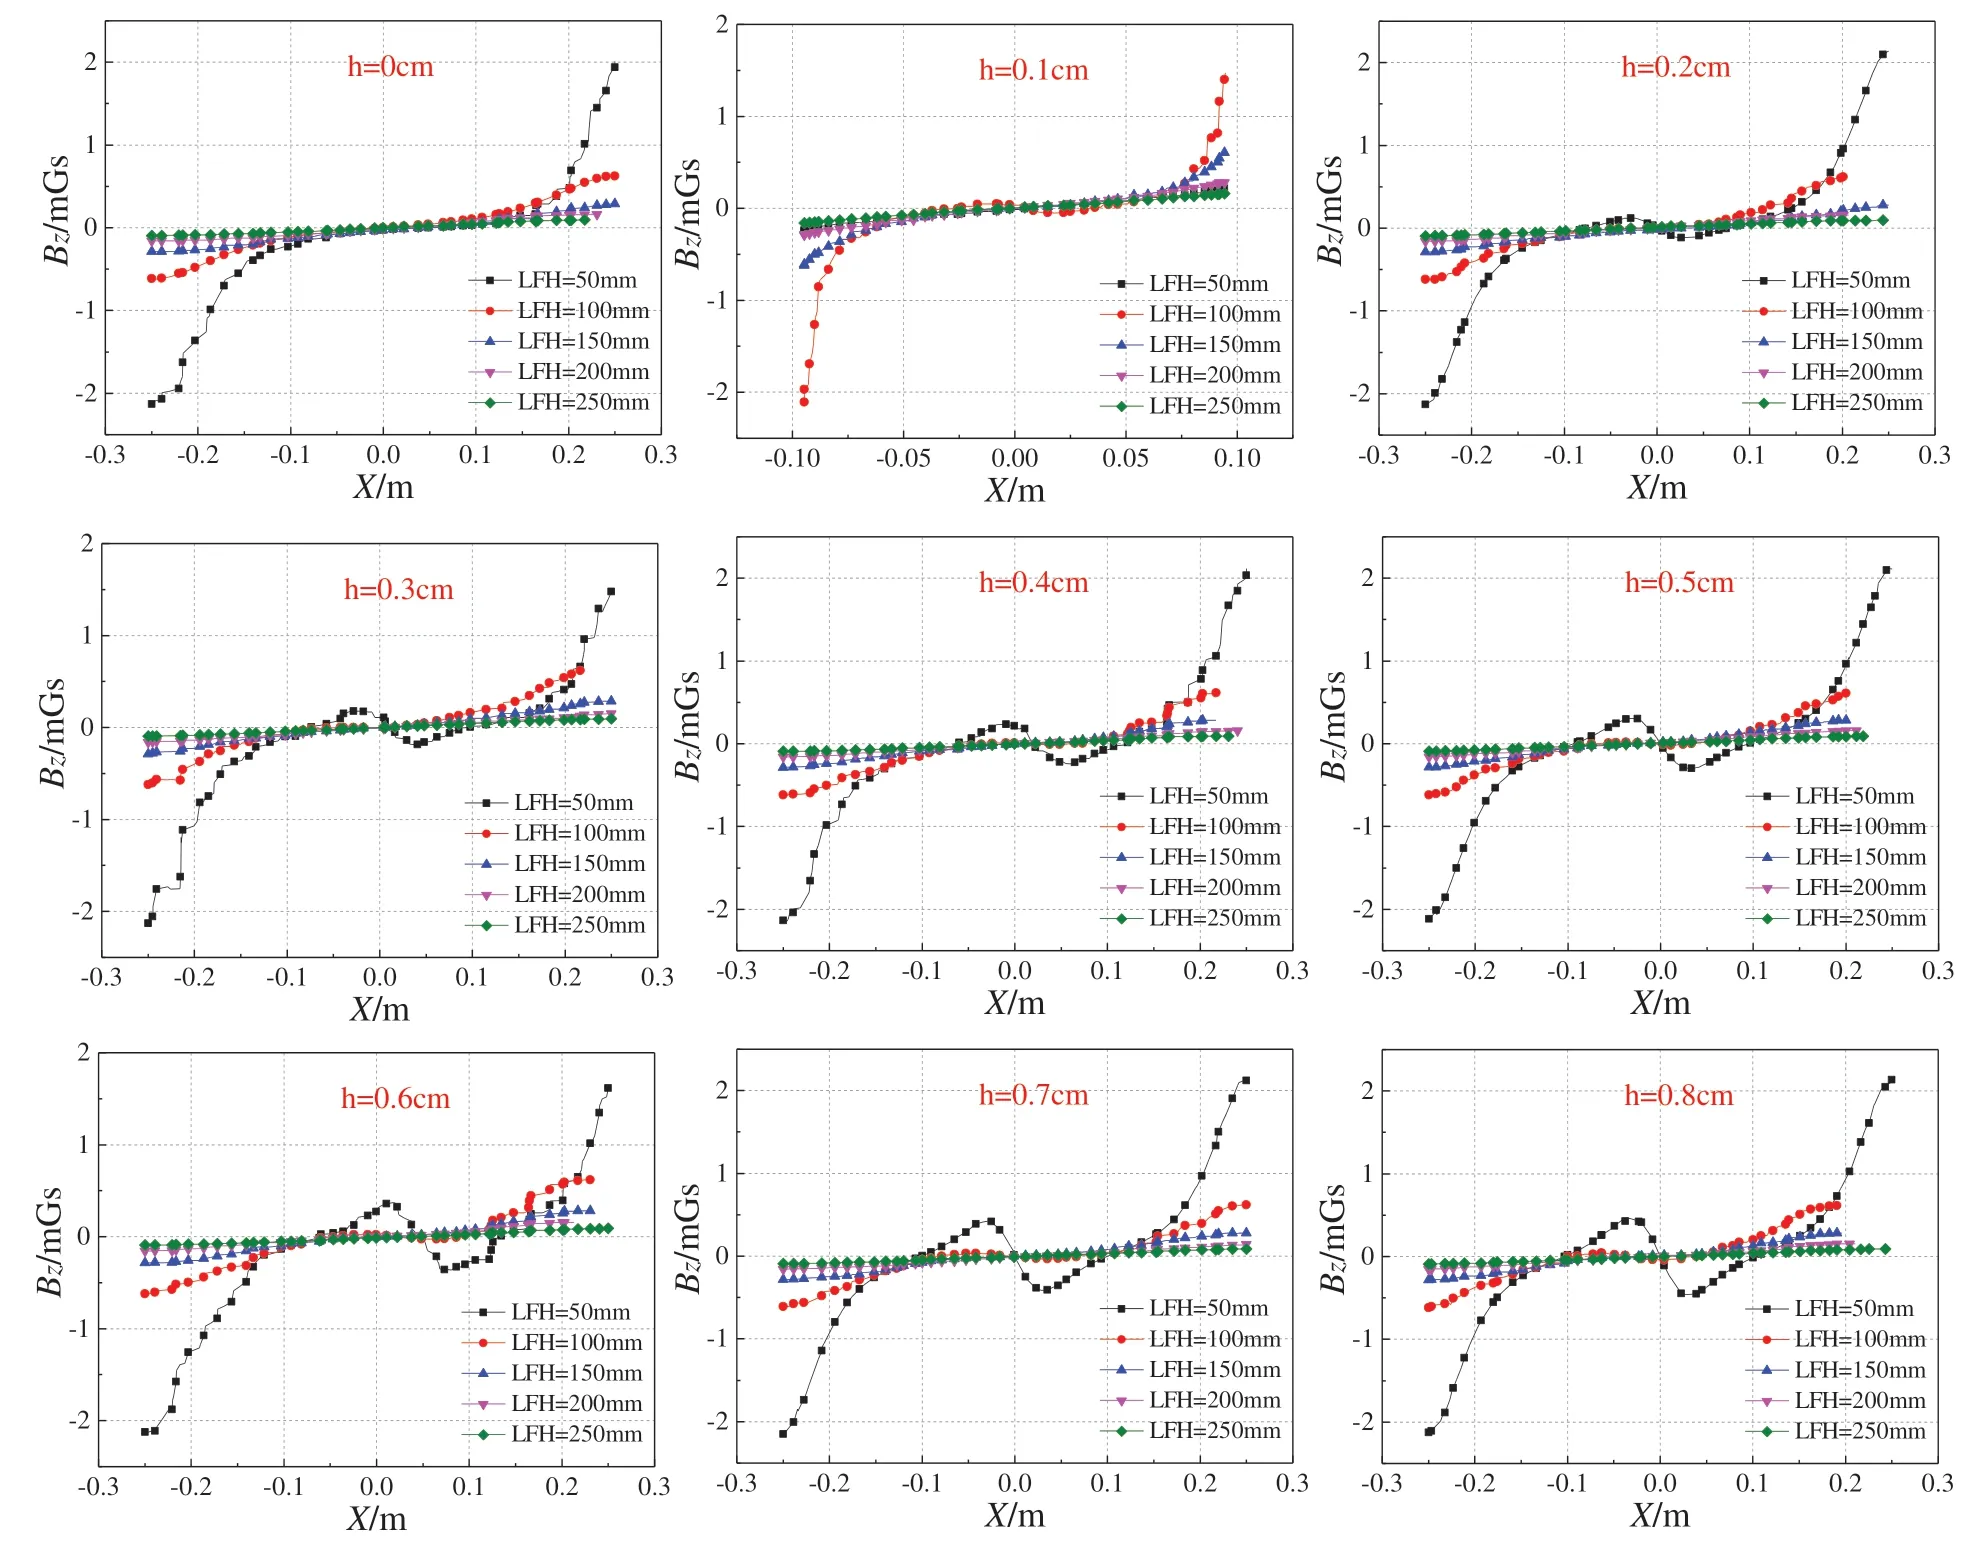
Figure 20:The curve of Bz changing with corrosion depth(M=48 A/m)
It can be seen from Fig.20 that the Bzmagnetic signal changes with the increase of the rust depth,and the change mainly occurs in the rusted area.The slope of the crest-to-trough connecting line of the Bzmagnetic signal in the rusted area shows a gradually increasing obvious trend with the increase of the rusted depth.In addition,the curve becomes flattered as the lift-off height increases.The relationship between the slope Ksof the line connecting the crest and trough and the corrosion depth h is shown in Fig.21.Ksand h show a good positive correlation.

Figure 21:The relationship between Ks and h
4.3 Correlation between Characteristic Magnetic Parameters and Corrosion Degree
Fig.22 shows the gradient K curve obtained by selecting a representative Bzcurve with LFH=50 mm from each of the five groups of specimens.As shown in Fig.22a,the gradient K curve of the uncorroded specimen is Both ends extend upward,and the rusted area of the curve is below the straight-line K=0.As shown in Fig.22b,the gradient K curve of the rusted specimen has a crest in the rusted area of the specimen (X=400~500 mm),and a trough appears on both sides.And the crest passes through K=0,forming two zero point.The area between these two zero point roughly coincides with the rusted area,so the area between the two zero point formed by the crests of the gradient K curve can also be used to indicate the rusted area.

Figure 22:Gradient K curves of Bz signals of representative specimens of 5 diameters:(a)Before corrosion;(b)After corrosion
It can be seen from Fig.21 that the slope Ks of the crest-to-trough connection line of the Bzcurve analyzed by the simulation shows a good positive correlation with the corrosion depth h.To reflect the relationship more intuitively between the two,the normalized Hzcurve of the theoretical normal leakage flux density of different corrosion depths can be obtained from Eq.(6),as shown in Fig.23.The Hzcurves at different h are basically the same.As the corrosion depth h increases,the amplitude of the Hzcurve also increases gradually.In addition,as the corrosion depth h increases,the slope at the midpoint of the corrosion area also increases,and there is a significant positive correlation between the two.

Figure 23:Hz diagram of theoretical normalized normal flux leakage signal under different corrosion depths
To characterize the quantitative relationship between the normal flux leakage signal Bz′and corrosion,the gradient K′ of the normal spontaneous flux leakage signal Bz′is defined as follows:
where Bz(x)i+1is the Bz′signal of the i+1-st measurement point,Bz(x)iis the Bz′signal of the i-st measurement point,Δl is the distance between adjacent measurement points,which is equal to 2.6 mm.
To further determine the relationship between the degree of corrosion and the gradient of the Bz′curve,the maximum absolute value of the K′curve with LFH=50 mm in the corrosion area is taken and defined as K′1,as shown in Fig.24b.Fig.24a is a graph of theoretical K′curves under different rust depths.

Figure 24:The gradient K′ curve:(a) Theoretical diagrams at different rust depths;(b) Specimen 12-6#experimental diagram
Since different specimens have different initial and historical magnetizations,a dimensionless parameter is proposed to quantify the flux leakage signal of reinforced concrete specimens to avoid this effect.First,define the spontaneous flux leakage quantization parameter W,as Eq.(8) shows:
Among them,K′1is the maximum absolute value of the gradient K′curve of the Bz′curve of the rusted area(X=400~500 mm)of the rusted specimen,and K0is the absolute value of the average slope of the Bzcurve in the rusted area of the uncorroded specimen.Both are the corresponding values when the lift-off height is 50 mm,and Fig.25 is a schematic diagram of the two.

Figure 25:Schematic diagram of parameters K1′and K0
The W of the 50 specimens was obtained,and the relationship between W and the maximum crosssectional area loss rate η of the corrosion specimen was established.As shown in Fig.26b.

Figure 26:W-η relationship graph:(a) Theoretical value diagram;(b) Experimental value diagram of 50 specimens
It can be seen from Fig.26b that the quantization parameter W shows a good monotonous increasing law with the increase of η.The scatter plot is linearly fitted,and the corresponding relationship between W and η is obtained as W=0.024η+0.65,and the variance R2is 0.946.Fig.26a shows the theoretical value of W.The theoretical and experimental graphs are in good agreement.Therefore,the quantitative correlation between W and η shows that the characteristic parameter W of spontaneous magnetic flux leakage defined by Eq.(8)can effectively evaluate the corrosion degree of reinforced concrete members without considering the different magnetization states of each steel bar.
5 Conclusions
In this paper,SMFL tests were carried out on reinforced concrete specimens with different steel bar diameters and different corrosion degrees.The test results show that the corrosion area of the steel bar can be determined by the Bzcurve and its gradient K curve on the upper surface of the specimen.The relationship between the magnetic flux leakage index and the degree of corrosion is mainly discussed.The specific conclusions are as follows:
1.The corrosion conditions of the internal steel bars were analyzed for the five groups of steel bar diameter corrosion specimens.It was found that the smaller the original diameter of the steel bars,the greater the corrosion maximum cross-sectional area loss rate η under a similar corrosion time.
2.The magnetic induction intensity component Bzof the rusted specimen and the Bz′after deducting the initial magnetic signal of the corresponding specimen are analyzed.It shows that at a moderately small liftoff height (for example,50 mm),the “trough-crest (or crest-trough)” behavior of the Bzcurve of a single corroded reinforced concrete specimen and the zero-point spacing of its gradient K curve is related to the actual corrosion of the rebar,and apply to reinforced concrete specimens with different diameters.
3.The relationship between the degree of corrosion and the characteristic magnetic index under five groups of rebar diameters is analyzed.The conclusion is that the smaller the lift-off height is,the stronger the magnetic flux leakage signal is.The influence of reinforcement diameter on the quantification parameter W of spontaneous magnetic flux leakage is small,and the corrosion loss rate η of the maximum section of reinforced concrete members and W increases approximately linearly.
In summary,this study proposes quantitative magnetic characteristic parameters for the corrosion of steel bars with different diameters.Due to the following factors,these research results are not sufficient for practical engineering:the electrochemical accelerated corrosion process is different from the actual natural corrosion,and the applicability of the characteristic magnetic parameters in the presence of multilayer steel bars and stirrups has not been studied,and the sample data is limited.However,this study can be improved by eliminating the adverse effects of the aforementioned factors.In the future,the SMFL technique will be applied to reinforced concrete beams in a naturally corroded state.
Appendix

Table A1:Rusting arrangement table for 50 reinforced concrete specimens
(Continued)

Table A1 (continued)
Acknowledgement:None.
Funding Statement:The authors received no specific funding for this study.
Author Contributions:The authors confirm contribution to the paper as follows:study conception and design:Zhongguo Tang,Haijin Zhuo,Beian Li;data collection:Xiaotao Ma,Siyu Zhao,Kai Tong;analysis and interpretation of results:Zhongguo Tang,Haijin Zhuo,Beian Li;draft manuscript preparation:Zhongguo Tang,Haijin Zhuo,Beian Li.All authors reviewed the results and approved the final version of the manuscript.
Availability of Data and Materials:The authors confirm that the data supporting the findings of this study are available within the article.
Conflicts of Interest:The authors declare that they have no conflicts of interest to report regarding the present study.
 Structural Durability&Health Monitoiing2023年5期
- Structural Durability&Health Monitoiing的其它文章
- An Overview of Seismic Risk Management for Italian Architectural Heritage
- Ensemble 1D DenseNet Damage Identification Method Based on Vibration Acceleration
- A Noise Reduction Method for Multiple Signals Combining Computed Order Tracking Based on Chirplet Path Pursuit and Distributed Compressed Sensing
- Predicting Reliability and Remaining Useful Life of Rolling Bearings Based on Optimized Neural Networks