
Detection of Residual Yarn in Bobbin Based on Odd Partial Gabor Filter and Multi-Color Space Hierarchical Clustering
2023-12-28 09:11ZHANGJinZHANGTuanshan张团善SHENGXiaochao盛晓超HUYANPengfei呼延鹏飞
关键词:鹏飞
ZHANG Jin(张 瑾),ZHANG Tuanshan(张团善),SHENG Xiaochao(盛晓超), HUYAN Pengfei(呼延鹏飞)
1 School of Textile Science and Engineering, Xi’an Polytechnic University, Xi’an 710048, China
2 School of Mechanical and Electrical Engineering, Xi’an Polytechnic University, Xi’an 710048, China
Abstract:In an automatic bobbin management system that simultaneously detects bobbin color and residual yarn, a composite texture segmentation and recognition operation based on an odd partial Gabor filter and multi-color space hierarchical clustering are proposed. Firstly, the parameter-optimized odd partial Gabor filter is used to distinguish bobbin and yarn texture, to explore Garbor parameters for yarn bobbins, and to accurately discriminate frequency characteristics of yarns and texture. Secondly, multi-color clustering segmentation using color spaces such as red, green, blue (RGB) and CIELUV (LUV) solves the problems of over-segmentation and segmentation errors, which are caused by the difficulty of accurately representing the complex and variable color information of yarns in a single-color space and the low contrast between the target and background. Finally, the segmented bobbin is combined with the odd partial Gabor’s edge recognition operator to further distinguish bobbin texture from yarn texture and locate the position and size of the residual yarn. Experimental results show that the method is robust in identifying complex texture, damaged and dyed bobbins, and multi-color yarns. Residual yarn identification can distinguish texture features and residual yarns well and it can be transferred to the detection and differentiation of complex texture, which is significantly better than traditional methods.
Key words:residual yarn detection; Gabor filter; image segmentation; multi-color space hierarchical clustering
0 Introduction
Winding is the final step in the ring-spinning process, which transfers the spun yarns from the spinning bobbin into a large package form containing a considerable length of yarns for weaving and knitting. Since the bobbins may not be completely withdrawn from the winder, it is necessary to detect the amount of residual yarn and classify the bobbin according to the results. Currently, textile companies have the following three problems with the handling of bobbins. Firstly, there are many types of bobbins and the sorting situation is complicated. Secondly, manual sorting is inefficient and costly. Finally, the intermixing of yarns and yarn-free bobbins makes sorting difficult. How to effectively sort out these mixed bobbins is an urgent problem for textile companies today. The residual yarn inspection technology combined with machine vision not only excels in line inspection efficiency, but also has an irreplaceable position in terms of inspection accuracy and precision, and it has become the mainstream product line inspection technology today. Figure 1 shows bobbins in the factory application process.
Non-contact methods of residual yarn detection have emerged, the data is mainly collected using a color sensor or camera to detect the color of the bobbin. By comparing the same type of the empty bobbin with the preset value, and using a support vector machine or neural network to segment the color, the yarn region is extracted. These solutions rely more on the color difference between the bobbin and the yarn. They are easily misidentified when two colors are close together and are not ideal for detection with very small amounts of yarns. In addition, the large variety of yarns and bobbins and their complex combination of colors, texture, and shapes make it difficult to detect the number of residual yarns on the bobbin using simple image techniques.
Texture image segmentation is an important tool to solve this problem and is one of the main research hotspots in graphics and computer vision processing. There are many algorithms for texture image segmentation. These algorithms first use the strategy of extracting the texture features of the image and then performing image segmentation. The commonly used algorithms can be divided into three categories. (1) The use of filter-based algorithms represented by Gabor filter[1]and wavelet filter[2], if combined with the level set algorithms for energy functions, can get good results. (2) Algorithm based on cluster analysis[3-5]is represented by the fusion of Gabor, Steer and other filters and color information, which firstly extract texture features with filters and then fuse the color information to finally achieve the segmentation of texture images. (3) The level set algorithm based on energy function is represented by the regional model[6]to build the segmentation model and texture features. The third algorithm firstly establishes segmentation models, then extracts texture features based on local binary patterns (LBPs)[7], local ternary patterns (LTPs)[8], Gabor filter, structure tensor[9], local Chan-Vese (LCV) method based on extended structure tensor[10], combined with a tensor structure consisting of multiple features[11], local similarity factor (RLSF)[12], and finally segments the texture images. All the above methods are for medical and remote sensing images, which are too complex and poorly robust for application in real-time systems.
As a linear filter, the frequency and direction representation of Gabor filter is very close to the banding ability and directivity of the human visual system, and is widely used in edge detection[13], texture segmentation[14], defect detection[15-17]and other fields. Considering the color difference between the bobbin and yarns as well as the difference in surface texture, a parameter-optimized multi-directional and multi-scale filter bank is designed to filter the two-dimensional image signal, extract the edges of the wrapped yarn, and perform preliminary calculation and segmentation of the residual yarn by using the antisymmetry of the odd part of the Gabor filter.
Texture segmentation starts with color segmentation, and there are two main problems in color image segmentation: choosing a suitable color space; choosing a suitable segmentation method. The choice of the color feature space depends on the specific image and segmentation method. Currently, no one color space can replace other color spaces and is suitable for the segmentation of all color images[18]. Many scholars have used more complex feature selection and clustering techniques and then improved the final segmentation results with sophisticated optimization methods. Several segmentation techniques that combine specific theories, methods, and tools have emerged, such as graph theory-based method[19-20], wavelet domain hidden the Markov model[21], mean shift[22], and other information fusion strategies that have been used for image segmentation.
Combining the same segmentation method or different segmentation methods for the segmentation of multi-color and multi-feature space can effectively solve the two main problems of color image segmentation mentioned above and improve the segmentation effect. The combined method is simple and does not require complex segmentation theories and models. The authors[23-24]verified the feasibility and effectiveness of this strategy in medical image segmentation, remote sensing image segmentation, and natural scene image segmentation. However, there are relatively few research results on feature fusion in image segmentation due to the particular difficulties associated with features[25-26].
In this paper, we use multi-color spaces for clustering, each dealing with its linear part, and then synthesize the segmentation results. In terms of color space selection, there are six color spaces to choose from: red, green and blue (RGB); hue-saturation-value (HSV); brightness, in-phase, quadrature-phase (BIQ); XYZ (an international standard); CIELAB (LAB) (luminosity,a,b) and LUV (to further improve and unify color evaluation methods, the International Commission on Illumination proposed a unified LUV color space, where L represents the luminance of an object, U and V are chromaticities). Firstly, through experiments, we select two color spaces, RGB and LUV, and use the clustering method to initially segment the enhanced images of RGB and LUV. Secondly, we use the second clustering method to fuse the two initial segmentation results to obtain the fused segmented images. Finally, the segmentation results are obtained by region merging, which effectively solves the over-segmentation and mis-segmentation problems in natural image segmentation.
The overall structure of this paper is as follows. Section 1 introduces the experimental software and hardware configuration. Section 2 is the detection algorithm, which is divided into three processes: bobbin image acquisition and extraction of main regions; the specific method of yarn edge extraction and segmentation based on Gabor filter; the color space fusion algorithm based on multi-color space hierarchical clustering and segmentation that combines Gabor edge detection to achieve residual yarn detection. Section 3 is a summary of the proposed method and experiments.
1 Experimental Device
The experimental system contains the following equipment. A charge coupled device(CCD) camera MV-GED500C-T (Shenzhen Minvision, China) is used with 2 448×2 048 dots per inch (DPI), 9 frames per second, and an ethernet interface, which can meet the needs of the experiment and actual production applications. For the lens, an industrial lens with a focal length of 25 mm (Zhejiang Dahua Technology CO., LTD., China) is adopted. The illumination source (Hangzhou Hikvision Digital Technology Co., LTD., China) is a downward-inclined white LED positive light source with a color temperature of 6 500 K. The experimental platform is shown in Fig.2. The computer operating system is Windows 7, the processor is i5-2500k@3.3GHz, the memory is 4 GB, and the graphics card is GeForce GTX 750. The framework is Visual Studio, and the OpenCV version is 3.4.3.
According to the process of bobbin inspection, the whole system can be divided into a bobbin transfer module in the first stage, the bobbin online inspection module in the middle stage and the bobbin management module in the last stage. In the first stage, the messy bobbin needs to be pre-sorted, so that the bobbin can be placed more neatly before entering the online inspection in the middle stage to improve the inspection efficiency. The bobbin online inspection module is the core part of the pipeline management system, and the inspection result is directly related to the effect of the later bobbin management module. The bobbin online inspection module mainly realizes the detection of the bobbin with yarns and the color classification detection of the bobbin without yarns.
Among them, yarn-containing bobbin detection precedes yarn-free bobbin color classification detection, and yarn-containing bobbin detection includes broken bobbin detection, end detection and yarn-containing detection. The color classification detection of yarn-free bobbins requires classification based on the head and body color of the bobbin. The bobbin online inspection system analyzes each bobbin image captured from the conveyor belt by the corresponding image processing algorithm to calculate the pixel length, end pixel width, edge detection, and color classification process of the bobbin. According to the results of calculation and analysis, communication and interaction with the embedded computer master is carried out to separate the broken end, inverted end and yarn-containing yarn barrel from the conveyor belt and send them from the plate to the corresponding box. If it is a qualified yarn barrel, then it can be processed for color analysis and move on to the next module. The process diagram is shown in Fig.3.
Since the system is based on a fixed color background, in order to effectively preserve the target area, it is necessary to remove the support frame, background and other factors, and it is necessary to pixel mask each read image to obtain a binary image containing only 0 and 1 values. In the initially segmented binary image, each pixel with a value of 0 is judged to be within the similarity threshold. If it is within this range, the pixel range is reset according to the processing relationship, and the desired color image is obtained. The whole process is depicted in Figs. 4-6.
The bobbin is positioned according to the optical band to effectively cut the experimental map and get the region of interest. The bilateral filtering can effectively filter out the noise in the image, make the contour of the bobbin clearer, effectively retain the details of the image, and extract the region of interest (ROI).
2 Gabor Detection Algorithm
2.1 Image acquisition of bobbin
As shown in Fig.7(a), the camera captures an image of the bobbin spool directly. Horizontal correction of the image is needed to crop the main area of the bobbin spool. First, the smallest outer rectangle of the bobbin axis region is drawn with OpenCV, then using the built-in function of OpenCV. The angle of the bobbin is
(1)

2.2 Gabor filter feature extraction
2.2.1ExtractionofyarnedgesusingoddpartialGaborfilter
Gabor filter features have been widely used as effective texture feature descriptor for target detection and recognition. In the spatial domain, two-dimensional Gabor filter is usually obtained by multiplying a sinusoidal plane wave and a Gaussian kernel function. The properties of Gabor filter are self-similar. That is, any Gabor filter can be obtained by extending and rotating the mother wavelet. In practice, Gabor filter can extract relevant features from images with different orientations and different scales in the frequency domain. For a Gabor filter with a two-dimensional digital part, the functional expression is
(2)
where (x,y) is the pixel coordinate;x′=xcosθ+ysinθ;y′=-xsinθ+ycosθ;θdenotes the direction of the parallel stripes of the Gabor function, taking values from 0° to 360°;ωis the central frequency;σis the variance of the Gaussian distribution;ψis the phase of the sinusoidal function, and in general,ψ= 0;γis the aspect ratio,i.e., the spatial aspect ratio, which determines the ellipticity of the Gabor function. Whenγ= 1, the shape is circular, and whenγ<1, the shape is elongated in the direction of parallel stripes.σcannot be set directly. It varies with the bandwidth of the filter’s half-response spatial frequency (defined asb). The relationship between them is
(3)
whereσandλdetermine the wave form of the odd partial of the Gabor filter. When the product of the two is constant, the center frequency only affects the effective response region, while the waveform remains constant. Depending on the number of pixels occupied by a single veil in the image, a filter bank consisting of filters with the same center frequency is designed, and each bank contains filters with different orientations. In the experiments,σ/λis set to 1.2, the horizontal direction is ±90°, the number of groups is 3, and the center frequencies are 4.8, 5.6 and 6.4 Hz, respectively. The filter banks are convolved for each RGB channel component separately. The maximum value is taken from different directions of the same center frequency, and the minimum value is taken between different center frequencies to form the filter output. The processing effect of the filter is shown in Fig.8. After parameter optimization, the filter can suppress the texture of the cylinder wall and enhance the gray gradient of the bobbin at the same time.
2.2.2Filterwaveformoptimization
The waveform and output response of two-dimensional Gabor filter vary withσ,ω,θ,etc. Due to the bandpass characteristics of two-dimensional Gabor filter, it is necessary to use a multi-center frequency and multi-direction filter bank, and process the input signal according to fineness, so that the filter produces a greater response to the edge of the cylinder, while suppressing other texture. To enhance the edge detection of the odd part Gabor filter, it is necessary to make its waveform have a more pronounced step feature at axisx= 0. This step also gives a larger output response of filterG(x,y). LetEbe the integral of the response on the central axis side ofG(x,y).
(4)
After the integral operation, we can get
(5)
whereI(·) represents the imaginary part of the function;L(·) represents the error function. Equation (5) shows that ifσis known, thenEhas a Dawson distribution withωx(frequency atx). The inflection point of the Dawson integral occurs at approximately 0.924 14. It can be seen that whenEis the maximum value, the following equation can be obtained.
(6)
Figure 9 shows the filter output response curves withλ/σfor the test images. It can be seen that the actual peak occurs aroundλ/σ=6.4 and the actual output value is consistent with the theoretical output value.
2.2.3Filterangleselection
Figure 10 shows the ideal variation curve of the output response of the filter in the surprise section withθ. The maximum response of the filter was obtained whenθ= 90°. To prove the theoretical results, a total of five filters were selected to filter the test images in the range of 0° to 180° with 45° intervals. It can be seen that the filters filter best when the axes of the filters coincide with the step edge lines. Whenθis 90° and the centrosymmetric angle is 270°, these two angles can produce the ideal filtering effect. For a vertical bobbin, too many filters in different directions can reduce the operating efficiency and increase the noise.
2.2.4Filtercenterfrequencyselection

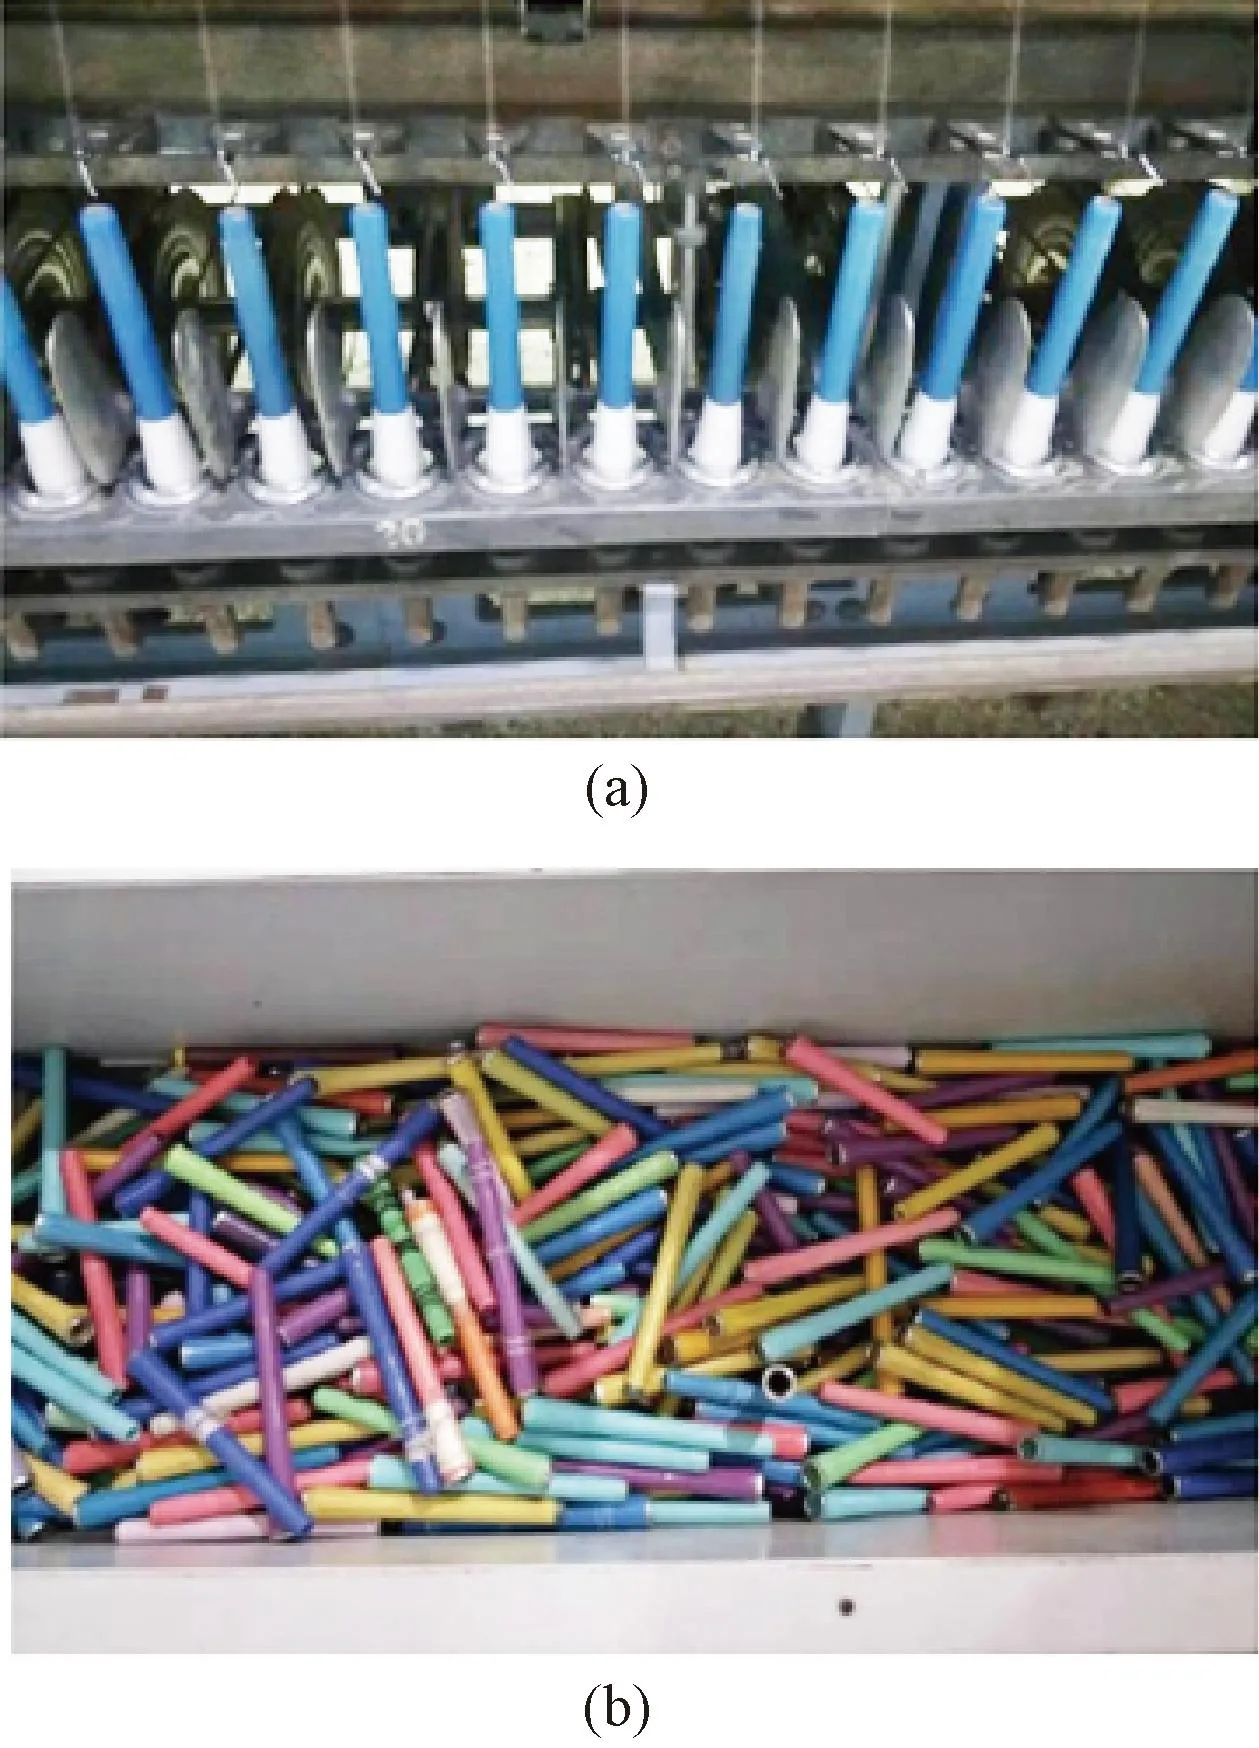
Fig.1 Bobbins in factory: (a) yarn bobbins in textile mills; (b) multi-color and yarn-containing bobbins that require sorting
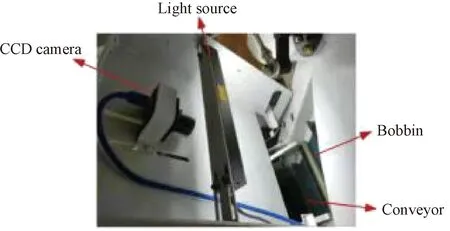
Fig.2 Experimental platform

Fig.3 Process diagram : (a) yarn identification and detection system; (b) image acquisition device

Fig.4 Image of bobbin
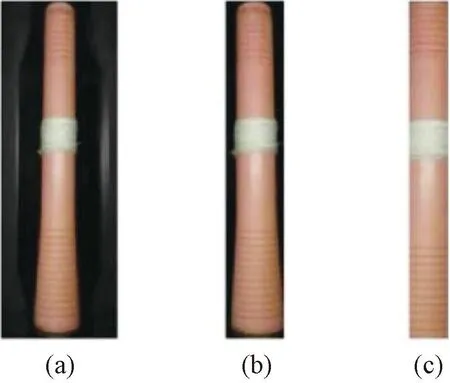
Fig.7 Region of interest automatic process of image: (a) bobbin image; (b) main area of the extraction; (c) main area of bobbin

Fig.8 Gabor rendering: (a) bobbin backbone area; (b) Gabor filtering effect of odd part
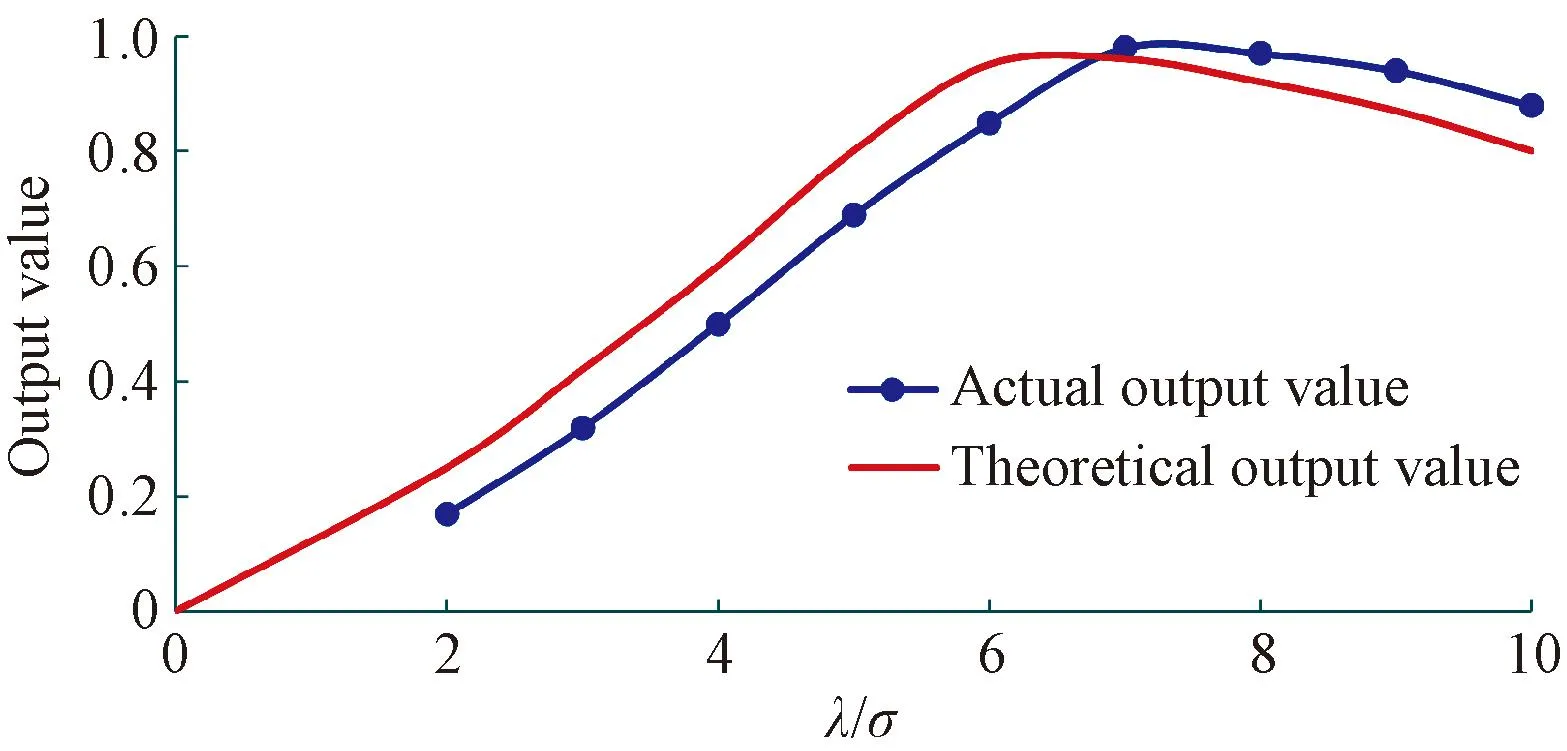
Fig.9 Output response curve with λ/σ

Fig.10 Output response curve with θ

Fig.11 Theoretical output curve with respect to σ/d
2.3 Fusion segmentation of multi-color spaces
RGB model is the most common and basic color model in digital image processing. In the RGB color space, any color can be represented as a weighted mixture of different components of the three primary colors red, green and blue. The RGB color space, also known as the additive mixed color space, is characterized by poor color uniformity. This color space model is shown in Fig.12(a). For general images, the luminance ranges from 1 to 100, and the values of U and V are between -100 and 100. +U is red, -U is green, +V is yellow, and -V is blue. The LUV color space model is shown in Fig.12(b).
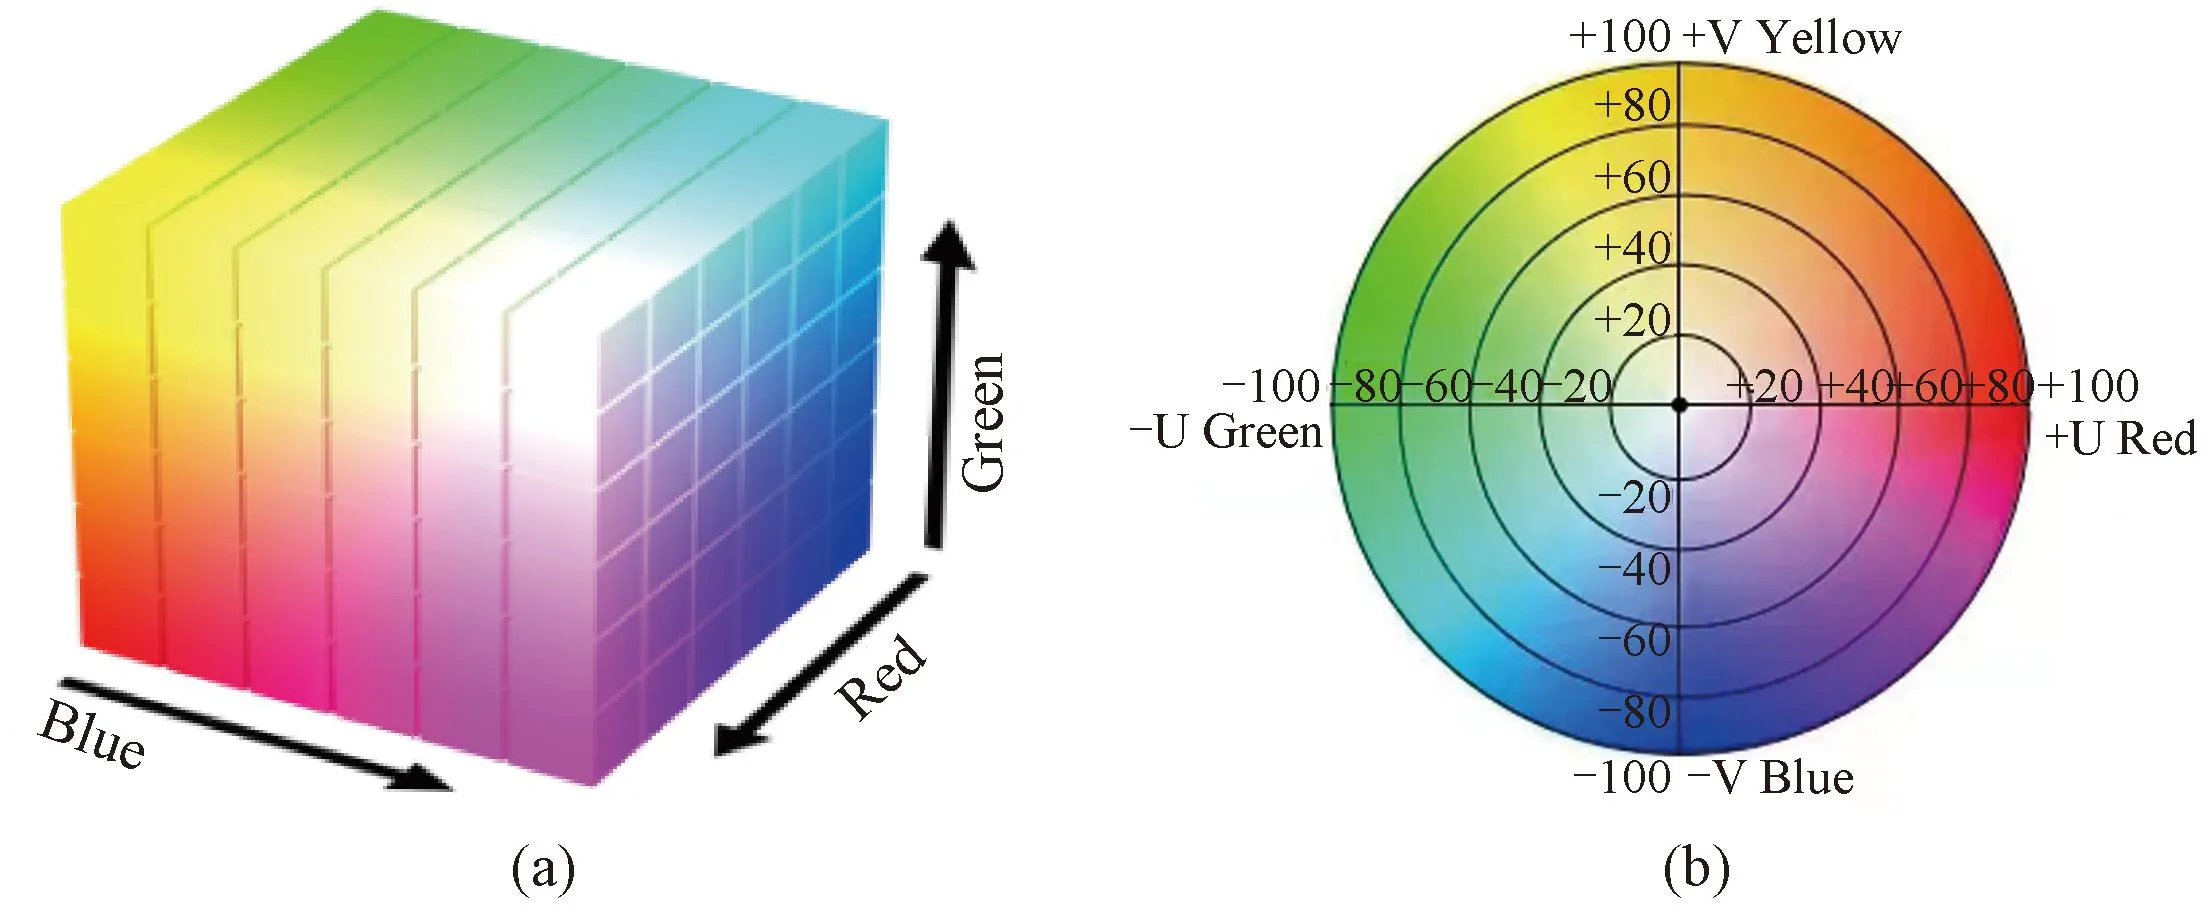
Fig.12 Different color spaces: (a) RGB color space; (b) LUV color space
The calculation formula is obtained by XYZ through nonlinear calculation. The specific equation is
(7)
(8)
whereYnis 1.0;u′ andv′ describe the test color stimulus.
The proposed method of fusion and segmentation of multi-color space based on hierarchical clustering is shown in Fig.13.
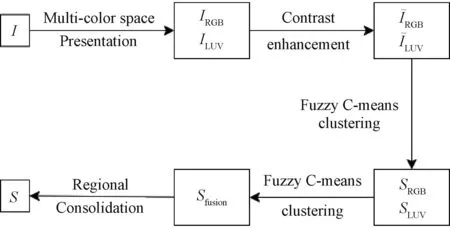
Fig.13 Multi-color space fusion and segmentation method flow
The specific steps are as follows.


3)The local class labeled histogram features ofRRGBandRLUVare extracted and serialized into a fusion feature vector, and then the second fuzzyC-means clustering is performed to obtain a fusion segmentation resultSfusion.
4)Conduct region merging onSfusionto obtain the final segmentation resultS.
2.3.1Fusionandsegmentationmethodflowbasedonhierarchicalclustering
In color image segmentation, choosing an appropriate color space is a difficult problem because it is difficult to represent complex natural scene images in a single-color space. Different color space representations can be seen as images with different channels provided by different sensors. An information fusion strategy combining complementary information from multi-color spaces is an effective way to improve the segmentation effect. Through the segmentation experiment of multiple groups of natural scene images, two color spaces, RGB and LUV, are selected to represent the segmented image and perform fusion segmentation. Image enhancement can highlight the light and dark changes in the image, and enhance the contrast between the background and the target, thereby effectively improving the segmentation effect of grayscale images. It is found that color image segmentation after enhancement processing can highlight the contours of the original image, reduce the number of segmentation blocks and improve the segmentation effect. The mathematical morphology image enhancement method is a simple and effective image enhancement method that can obtain a description of the structural features of an image by the influence of structural elements on the image.
(9)
2.3.2InitialsegmentationbasedonfuzzyC-meansclustering
In general, the color histogram has a high degree of freedom. Taking RGB color space as an example, the color histogram has a high degree of freedom of 2563. Here, each color component is uniformly quantized to levelP, and the color histogram has a degree of freedom ofP3. For any pixelXin the image, the normalized local color histogramh1in a windowRcentered onXis computed.
(10)

2.3.3Fusionoftheinitialsegmentationofmulti-colorspace
The fuzzyC-means clustering method is used to fuse the two initial segmentation results ofK1category, and the fusion segmentation results ofK2different categories are obtained bySfusion.
For the two initial segmentation results, the feature vectors of the local class-labeled histograms centered on pixelxare extracted respectively, and the class-labeled histogramsh2are calculated in the windowRx.
(11)
wherenjis the number of pixels in the window labeled as (j+1);Nwrepresents the number of images corresponding to the bobbin. Then, two local class labeling histograms are concatenated and normalized to obtain the fused local class labeling histogramh2(Rx) with vector dimensions ofK1andK2.
2.3.4Regionalconsolidation
Since the clustering results are pixel-based, it is necessary to perform region merging onSfusionto achieve a more complete description of the target. In the segmentation results, the distance between a regionRand an adjacent regionRois denoted asDmerging(R,Ro),
(12)
whereC= {RGB, LUV};h(R) represents the normalized local color histogram of theRregion;h(Rx) represents the normalized local color histogram of a pixelxin the neighborhoodRo;DB[h(R),h(Rx)] represents the Batacaria distance of the histogram;h(i,R) andh(i,Rx) represent the occurrence frequency of the bin in the histograms ofRandRxrespectively;Nbrepresents the number of bins in the histogram. By calculating the distance betweenRand all adjacent regions ofR, the minimum adjacent regionRminis obtained. If the distance betweenRandRminisDmerging(R,Rmin) and less than the thresholdT, thenRis merged intoRmin. In the experiment of this paper, the segmentation of three different yarn volume fractions has achieved a very good segmentation effect, which can effectively restrain the texture of the bobbin and eliminate the influence of reflection. The experimental results are shown in Fig.14.

Fig.14 Segmentation effect: (a) unsegmented image; (b)segmentation result image
3 Experiment and Analysis
In this study, we select 150 bobbins as the test image set, as shown in Fig.15. We test them according to LUV color space, and generally use chromaticity, saturation, and luminance according to the judgment rules of human eyes. For the sake of simplicity, we use saturation as the variable, so it is divided into four cases. For the first one, the saturation and luminance of the bobbin and yarns are completely distinguished. For the second one, the saturation of the bobbin and yarns is similar, but the hue is different. For the third one, the hue of the bobbin and yarns is similar, but with different saturation. For the fourth one, the bobbin and yarns are with little difference in hue saturation, which is the industry phenomenon of “the same bobbin and the same yarn”. In these four cases, the bobbin texture, slight stains,etc. should be considered. From the classification point of view, bobbin texture belongs to the fourth category.

Fig.15 Images for testing
Regarding the clustering, theoretically, two clusters are enough, one is the color of the bobbin itself and the other is the color of the yarn, but in practice, the bobbin is reflective and the bright band counts as a cluster. The bobbin texture counts as a cluster, so there are four clusters in total, but this increases the burden on the computer and is not suitable for low-cost situations. Thus three clusters are considered. Garbo filter is used for texture processing. The idea is that at the boundary of the cluster, the Garbo binarized image is checked. If the yarn shape is satisfied and the width is greater than that of the texture, it is the yarn. If both are texture, further clustering of texture is performed.
An experimental process with the yellow bobbin is carried out, because the high saturation of the yellow bobbin is the high saturation of the white bobbin, and the identification of the yellow bobbin is the best test set to validate the system. The main reasons are as follows.
1)The RGB of yellow is (255, 255, 0) and the RGB of crimson is (255, 0, 255). These two colors are easily confused in a color instant, which means that the colors easily distinguished by the naked eye are mathematically identical.
2)Yellow is more likely to be contaminated and fade.
3)Yellow (255, 255, 0) is visually white shown in Fig.16. Yellow and light white yarns, which are indistinguishable by normal methods, are theoretically extremely susceptible to the interference from color component blue, resulting in white color.

Fig.16 Test process

Fig.17 Comparison curves of different algorithms
This process is also the block diagram of our software. From the diagram, we can see that three methods are used. Firstly, the Gabor filter is used to get the approximate position of the yarns, as seen in Fig.16. The texture and yarns are mixed and the exact position of the yarns cannot be distinguished, and other means are needed. Secondly, RGB three-component clustering is used, and the green component appears as a possible judgment of the yarn, but stain interference needs to be excluded. Thirdly, three-component clustering in the color space of LUV, from the L component to determine the location of the yarn. This “L” judgment is more realistic. If the U and V components are connected on the Y-axis at the same time, it can also be considered as having a yarn. The results of the three methods are fused by using the method of this paper to derive the yarns and their specific location. The accuracy of the method requires tuning the parameters of the fusion, which will not be developed here. Therefore, the yarns and texture which are very close to each other can be differentiated and processed. The situation is ideal when the filter is running at a speed of 50 bobbins per second, as shown in Fig.16.
To test the accuracy and robustness of the detection algorithm in this paper, different colors of yarns and different kinds of bobbins are selected for test groups, and the test groups are shown in Table 1. Five colors of white, black, blue, red and gray yarns with linear densities of 4.0 tex and 10.0 tex are selected, the true positive rate (TPR) of the residual yarn skeleton is used as the test evaluation index, which is defined as
(13)
whereQTPRrepresents the accuracy rate, and the value range ofQTPRis [0,1];ETPrepresents the actual bobbin with residual yarns, and the detection result is also the number of samples of the bobbin with residual yarns;A(TP+FN)represents the actual bobbin with residual yarns and the actual empty bobbin, and the detection result is the number of the bobbin with residual yarns plus the number of empty bobbin samples. The higher the value, the better the classification effect. The test results corresponding to Table 1 are shown in Table 2. Figure 17 shows the effect comparison curve, from which it can be seen that the accuracy of the traditional algorithm is lower than 65% and that of the algorithm in this paper is higher than 80%.
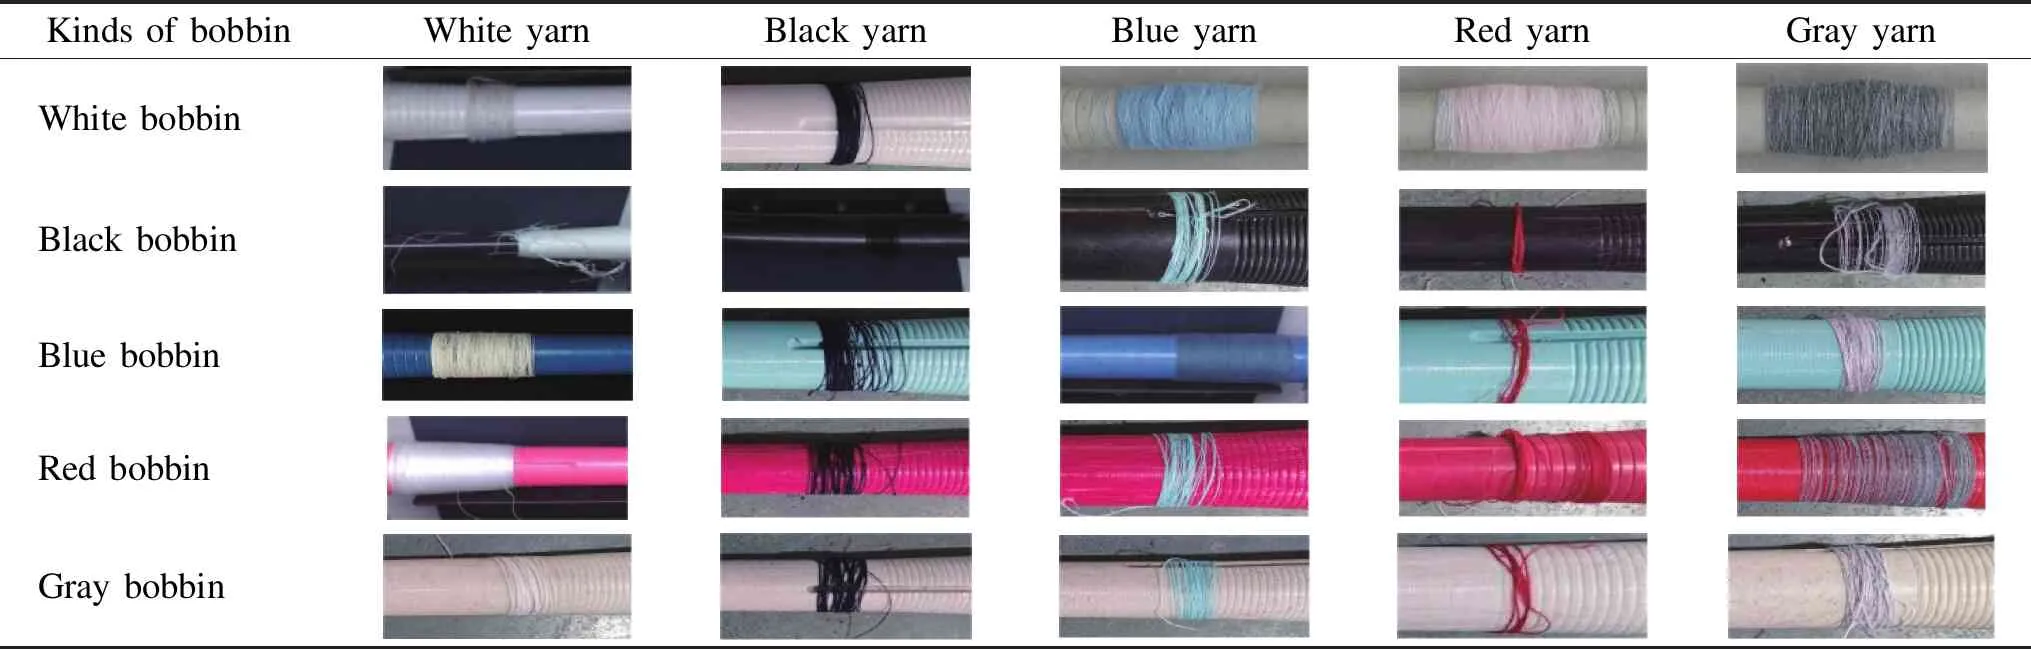
Table 1 Test groups
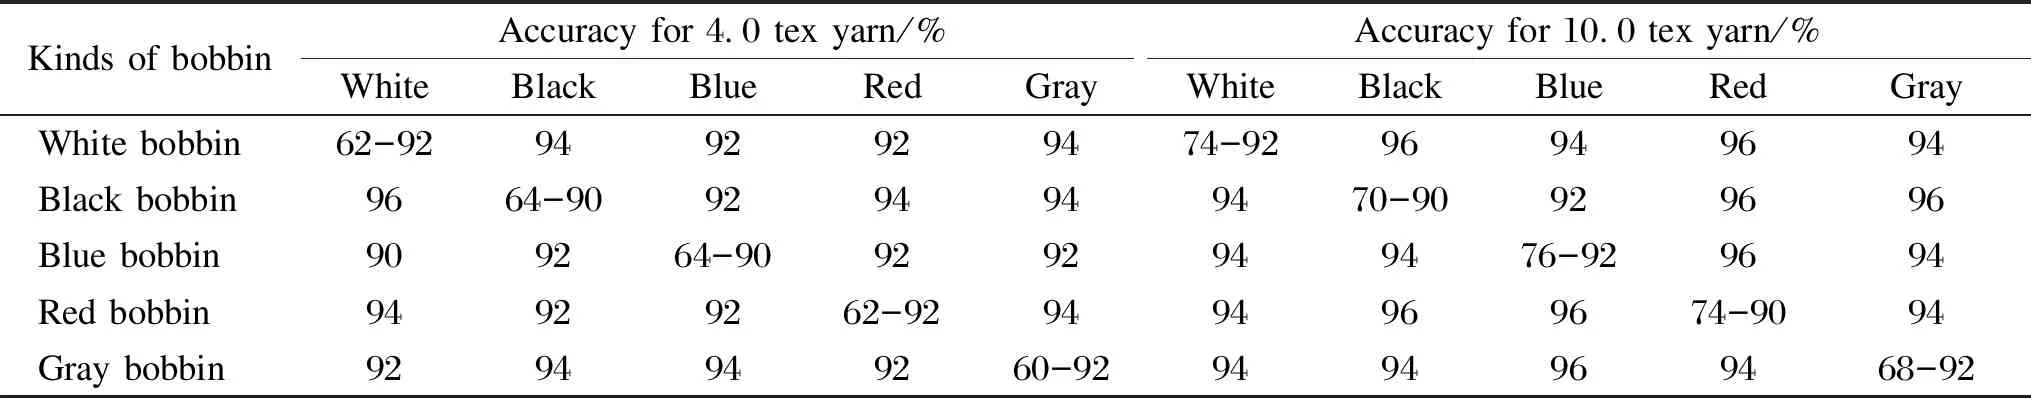
Table 2 Accuracy of test results
4 Experimental Verification of Indistinguishability
To further validate the method of this paper, the following are a few cases that are more difficult for the human eye to distinguish.
4.1 Texture judgment
The bobbin in Fig.18 is very prone to error even if it is manually selected. At this point, the Gabor filter does not work as well as required, as shown in Fig.18(c), color clustering must be considered to complete the yarn judgment. In LUV color space, the L component acts obviously; in RGB color space the blue component acts obviously, so that the state marker of the yarn can be judged after fusion.

Fig.18 Texture judgment process: (a) camera’s capture; (b) bobbin automatic identification; (c) Gabor filter; (d) L-component clustering; (e) U-component clustering; (f) V-component clustering; (g) R-component clustering; (h) G-component clustering; (i) B-component clustering
4.2 Loose yarn judgment
This is less common but still exists in a certain percentage. Figure 19 shows an example where the yarn is not horizontal on theY-axis and has a certain angle. In the adaptive Gabor filter used in Fig.18, the yarn contour is still distinguished, but when the yarn is close to the bobbin, the texture features are confused with the yarn features. In this identification, the concept of convex packets is utilized, as shown in Fig.19(g).

Fig.19 Yarn judgment process: (a) camera’s capture; (b) automatic identification; (c) Gabor filter; (d) L-component clustering; (e) U-component clustering; (f) V-component clustering; (g) R-component clustering; (h) G-component clustering; (i) B-component clustering
5 Conclusions
In this paper, odd partial Gabor filter, multi-color space and hierarchical clustering of compound texture segmentation operators are used to detect residual yarns. Yarn segmentation is realized by optimizing the design of Gabor filter banks and adjusting the parameters to maximize the order amplitude in the band pass range. To solve the problem of the specific width, the most suitable center frequency is explored. By setting a reasonable filter combination, the frequency inconsistent with the yarn direction is removed, the noise is suppressed and the detection efficiency is improved.
At the same time, it combines the fusion segmentation based on RGB and LUV color space hierarchical clustering to solve the problems of over-segmentation and mis-segmentation caused by the low contrast between the target and the background in the color. For image segmentation, image enhancement techniques in color image segmentation are introduced to make the segmented image better reflect the contours of the original image and highlight the parts of interest in the image.
The results show that the algorithm can accurately detect yarn bobbins with different colors and brightness, and its optimization strategy provides a theoretical reference for the research of non-contact bobbin sorting.
猜你喜欢
书香两岸(2020年3期)2020-06-29
老年博览·上半月(2020年1期)2020-02-10
杂文月刊(2019年18期)2019-12-04
21世纪(2019年10期)2019-11-02
21世纪(2019年10期)2019-11-02
21世纪(2019年9期)2019-10-12
老年博览·上半月(2019年2期)2019-09-10
初中生世界·七年级(2019年6期)2019-08-17
老年博览·上半月(2018年7期)2018-08-04
 Journal of Donghua University(English Edition)2023年6期
- Journal of Donghua University(English Edition)的其它文章
- Laser-Induced Graphene Conductive Fabric Decorated with Copper Nanoparticles for Electromagnetic Interference Shielding Application
- Toughness Effect of Graphene Oxide-Nano Silica on Thermal-Mechanical Performance of Epoxy Resin
- Photoactive Naphthalene Diimide Functionalized Titanium-Oxo Clusters with High Photoelectrochemical Responses
- Preparation and Thermo-Responsive Properties of Poly(Oligo(Ethylene Glycol) Methacrylate) Copolymers with Hydroxy-Terminated Side Chain
- Synthesis, Characterization and Water Absorption Analysis of Highly Hygroscopic Bio-based Co-polyamides 56/66
- Design of Online Vision Detection System for Stator Winding Coil