
Parasite-host network analysis provides insights into the evolution of two mistletoe lineages (Loranthaceae and Santalaceae)
2024-01-06 01:53JinZhoYunjieLiXunniWngMnruLiWenbinYuJinChenLingZhng
植物多样性 2023年6期
Jin Zho ,Yunjie Li ,Xunni Wng ,Mnru Li ,Wenbin Yu ,Jin Chen ,* ,Ling Zhng ,**
a CAS Key Laboratory of Tropical Forest Ecology,Xishuangbanna Tropical Botanical Garden,Chinese Academy of Sciences,Mengla 666303,Yunnan,China
b Engineering Research Center of Eco-environment in Three Gorges Reservoir Region,Ministry of Education,China Three Gorges University,Yichang 443002,Hubei,China
c Graduate School of the Chinese Academy of Sciences,Beijing 100049,China
d Linnaeus Labs Technology Co.,Ltd,Wuyuan 333200,Jiangxi,China
Keywords: Loranthaceae Mistletoe-host interaction Neutral interaction hypothesis Parasite-host network Santalaceae
ABSTRACT Mistletoes are ecologically important parasitic plants,with>1600 species from five lineages worldwide.Mistletoe lineages exhibit distinct patterns of species diversification and host specificity,however,the mechanisms underlying these differences are poorly understood.In this study,we analysed a comprehensive parasite-host network,including 280 host species from 60 families and 22 mistletoe species from two lineages(Santalaceae and Loranthaceae)in Xishuangbanna,located in a biodiversity hotspot of tropical Asia.We identified the factors that predict the infection strength of mistletoes.We also detected host specificity and the phylogenetic signal of mistletoes and their hosts.We found that this interaction network could be largely explained by a model based on the relative abundance of species.Host infection was positively correlated with diameter at breast height and tree coverage,but negatively correlated with wood density.Overall,closely related mistletoe species tend to interact more often with similar hosts.However,the two lineages showed a significantly different network pattern.Rates of host generality were higher in Loranthaceae than in Santalaceae,although neither lineage showed phylogenetic signal for host generality.This study demonstrates that the neutral interaction hypothesis provides suitable predictions of the mistletoe-host interaction network,and mistletoe species show significant phylogenetic signals for their hosts.Our findings also indicate that high species diversification in Loranthaceae may be explained by high rates of host generality and the evolutionary history shared by Loranthaceae species with diverse host plants in the tropics.
1.Introduction
The complexity of natural communities stems from the huge number of species present in a community and the diversity and unequal strengths of the interactions among them (Dunne et al.,2002;Bascompte,2010).In recent decades,interactions among species along the mutualism to antagonism continuum have been defined as networks,which provide an ideal framework for investigating community-level patterns of species interactions,as well as community structure,dynamics,and stability (Thompson and Femandez,2006;Tylianakis et al.,2010;Delmas et al.,2019).This framework may provide new insights to better understand the evolutionary history of species(Tobias et al.,2014;Allio et al.,2021).
One of the aims of community ecology is to recognize the factors driving the establishment of species interactions.Quantitative network analysis of mutualism,antagonism,and commensalism has revealed general patterns of community organisation.One example is nestedness,which refers to the concept that more specialist species tend to interact with a subset of species from the partners of generalised species (Bascompte et al.,2003).Furthermore,the differences in network characters (e.g.,nestedness)among symbiotic interactions indicate different mechanisms underlying the interacting structures (Fontaine et al.,2009;Thébault and Fontaine,2010;Piazzon et al.,2011).For instance,research on host-pathogen networks indicates that nestedness is driven by intraspecific competition,while modularity depends on local adaptation and competition(Valverde et al.,2020).Thus far,many studies have been conducted to detect the factors that affect the network structure of antagonisms (Enquist et al.,1999;Cagnolo et al.,2011;Poisot et al.,2012),mutualisms (Stang et al.,2009;Vázquez et al.,2009a;Donatti et al.,2011;Olesen et al.,2011),and commensalisms (Sáyago et al.,2013;Atencio et al.,2021).Factors determining the structural patterns of networks may be neutral,biological (such as complementary phenotypes),or both (Jordano et al.,2003;Santamaría and Rodrígues-Gironés,2007;Stang et al.,2007;Vázquez et al.,2009b).Additionally,network structures may result from multi-hierarchical and nonexclusive interactions between factors (Vázquez et al.,2009b).
Parasites are integral elements of natural communities not only because they are important components of biomass and biodiversity(Frainer et al.,2018)but also because they can regulate richness and/or re-order the relative abundance of species and thus alter the community structure (Wood et al.,2007).As a special group of parasitic plants,mistletoes are aerial hemiparasites of the order Santalales and comprise more than 1600 species with five distinctive lineages (Nickrent et al.,2010;APG IV,2016;Nickrent,2020).All mistletoe species are obligate hemiparasites,obtaining resources,including minerals and water,from hosts while retaining their capacity to photosynthesize (Nickrent,2020).Some mistletoes are regarded as keystone species because they promote biodiversity by providing structural(nesting space)and nutritional resources in their ecosystems (Watson and Herring,2012;Rodriguez-Cabal et al.,2013;Mellado and Zamora,2017).
Elucidating the interaction intensity and infection dynamics between mistletoes and hosts is fundamental to understanding the ecological processes of this antagonistic interaction.Two main hypotheses have been proposed to interpret the processes and patterns in networks of species interactions.The “neutral hypothesis” assumes that individuals in a community interact randomly;therefore,patterns of network interaction mainly depend on species abundances (Vázquez,2005;Vázquez et al.,2007,2009b).In contrast,the “forbidden links hypothesis” (or “barrier model”)proposes that interactions are dependent on matching morphological traits,i.e.,ecological trait mismatches constrain(Santamaría and Rodrígues-Gironés,2007;Stang et al.,2009;Vázquez et al.,2009b;Maruyama et al.,2014;Sazatornil et al.,2016).Host specificity of parasites has been proposed as an evolutionary adaptation,as even generalist parasitic species may display a certain degree of host preference (Bernays and Graham,1988).In natural communities,the relative abundance of hosts can be a pivotal element in shaping the host preferences of a parasite species (Norton and Carpenter,1998;Milner et al.,2020).For example,a study of a generalist parasite in South America,Tristerix corymbosus(Loranthaceae),showed that its host specificity differed among localities and was affected by host coverage (Atencio et al.,2021).Furthermore,intrinsic host traits,including chemical defences and bark properties,may explain host specificity (Vidal-Russell and Premoli,2015).
Phylogenetic constraints have also been identified for preferential host use (Atencio et al.,2021).Three categories of parasites can be identified depending on host preference: oixenous,which infect a single (specific) host;stenoxenous,which only infect related species (i.e.,within the same genus or family);and generalist,which infect several unrelated host species(i.e.,from different genera or families) (Combes,2001;Barrett and Heil,2012).Phylogenetic specificity should be considered when classifying host preference;however,studies have failed to detect phylogenetic signal in the host-mistletoe network structure(Sáyago et al.,2013).Consequently,whether phylogenetic history constrains the specificity or generality of mistletoe remains uncertain.
Among the five lineages of mistletoe,Loranthaceae is the largest family,comprising 76 genera and over 1000 species with a worldwide distribution (Nickrent et al.,2019).Santalaceae comprises more than 500 species distributed mainly in temperate and tropical regions,with seven genera and 33 species found in China(Xia and Gilber,2003).Santalaceae parasites evolvedca.53 Mya,whereas Loranthaceae evolved approximately 28 Mya (Vidal-Russell and Nickrent,2008a).Compared to Santalaceae,the more recently-evolved Loranthaceae may have experienced rapid adaptive radiation and speciation at the onset of global cooling (Oligocene),when tropical regions narrowed and gave way to temperate grasslands and deciduous forests (Vidal-Russell and Nickrent,2008a).One intriguing question is whether the differences in evolutionary history between these two major lineages affect today's mistletoe-host interactions.
In this study,we investigated the network structure of hosts and mistletoes (Loranthaceae and Santalaceae) in Xishuangbanna,Yunnan Province,China.We identified the factors that predict infection strength of mistletoes and whether the phylogeny of mistletoes and their hosts constrained interaction patterns.In addition,we assessed host specificity and the phylogenetic signal of mistletoes from both Loranthaceae and Santalaceae to explore how the evolutionary history of the families may affect the interactive ecological network of mistletoes and their hosts.
2.Materials and methods
2.1.Study site
The Xishuangbanna Dai Autonomous Prefecture in Yunnan Province,southwest China,is a pivotal region along the Lancang-Mekong River that connects China and the lower Mekong countries.It is in a biodiversity hotspot of tropical Asia(Fig.S1)with mean annual temperature and precipitation of approximately 21°C and 1500 mm,respectively (Zhu et al.,2006).The climate of this region is affected by warm,wet air masses from the Indian Ocean in summer (including monsoons),and subtropical continental air masses in winter,resulting in a rainy season(May to October)and a dry season(November to April)(Zhang,1963).The vegetation types in the study area mainly include tropical monsoon forest,tropical montane evergreen broad-leaved forest,tropical seasonal moist forest,montane rainforest,bamboo forest,shrubland,and grassland (He et al.,2008).More than 20 mistletoe species,including both generalists and specialists,occur in Xishuangbanna,with different spatial distributions (Sui and Zhang,2014).The recorded host species mainly include members of Euphorbiaceae,Leguminosae,and Moraceae along with representatives of several other families (Wang and Zhang,2017).
2.2.Host and mistletoe databases
Both geographical distribution and phylogenetic history may drive host specificity and can be investigated in a geographical area(Poulin et al.,2011).We conducted an extensive survey of trees infected by mistletoe in Xishuangbanna between 2015 and 2017.Combining pre-existing trails within an area of 1,912,450 ha,we designed a new set of transects and plots that covered mistletoe habitats.Habitats in the survey included gallery forest,rainforest edges,plantations,and roadsides,with elevations ranging from 490 to 1711 m.The forest sample plots were distributed in nature reserves (including the National Nature Reserve of Xishuangbanna and the National Nature Reserve of the Naban River),and some block forests protected by local Dai villages.Plantations included parks,tree farms,ecological tea gardens,and botanical gardens(Wang and Zhang,2017).A new set of 51 transects with areas ranging from 10× 10 m2to 20× 3000 m2with intervals>200 m were surveyed (Fig.S1;Table S1).We observed infected hosts by binoculars.Hosts were then recorded and identified.Mistletoe species and number of parasite individuals per infected host were also recorded.Furthermore,diameter at breast height (DBH,cm),tree coverage(TC,m2),tree height(TH,m),and bark roughness(BR)were calculated for all trees (including infected and uninfected potential hosts) in the plots.The DBH was directly measured for each tree using a DBH ruler(accuracy=1 mm).TH was measured by laser rangefinder and TC was estimated by planimetric area of tree canopy on the ground.BR was divided into four categories:smooth,rough with no obvious cracks,rough with cracks,rough with deep cracks (Mistry,1998).Wood density (WD,g/cm3) was obtained from the Global Wood Density Database (Zanne et al.,2009).Voucher specimens of each mistletoe species were stored at the Herbarium of the Xishuangbanna Tropical Botanical Garden.
2.3.Bipartite network analysis
In this study,qualitative and quantitative networks were used to characterise the patterns of interactions between mistletoes and their host species.The qualitative bipartite matrix included the interactions between mistletoes and their hosts,whereas the quantitative matrix was based on the infection strength of mistletoes for each host species.In the qualitative bipartite network,matrix R,rij=1 when mistletoejinfected host planti;otherwise,rij=0 (Jordano,1987;Bascompte et al.,2003).Infection strength was quantified as the infection intensity,i.e.,the number of individuals of each mistletoe species per host individual.We calculated network metrics related to the antagonistic metrics,including total links,links per species,connectance,modularity,nestedness,generality,and vulnerability using thebipartitepackage(Dormann et al.,2008,2009).These metrics included.
• Connectance (C): Realised proportion of possible links in the network,C=L/(HM).L indicates sum of links,H indicates number of host species,M indicates number of mistletoe species.
• H2’: A quantitative measure of specialisation,ranging between 0 (no specialisation) and 1 (complete specialisation) (Blüthgen et al.,2006).
• ISA: Interaction strength asymmetry for mistletoe and hosts,a value of zero indicates highly symmetric interaction strength,whereas a value close to 1 or -1 indicates high asymmetry.
• Host species richness: the number of host species involved in the network.
• Weighted NODF: Weighted nestedness a quantitative index for nestedness building on NODF,ranging 0 (no nestedness) and 100 (perfect nestedness).
• Generality: weighted mean number of host species per mistletoe species.
• Vulnerability: weighted mean number of mistletoe species per host species.
Two parameters -the within-module degree (Z) and the between-module connectivity(C)-were calculated to identify the species' role (i.e.,module hubs,network hubs,peripherals,and connectors) in the network.Measurements ofZandC,and the criteria for classifying the species’role in the network were defined as in Guimerà and Amaral (2005),Olesen et al.(2007),and Ulrich et al.(2009).
Modularity was estimated with the index M ranging 0 and 1 based on a simulated annealing algorithm using the program NetCarto (Guimerà and Amaral,2005).Its significance was calculated with a Monte Carlo procedure based on 1000 randomizations.
Compared with specialist interactions,generalist interactions will encounter more bias from their increased likelihood.Thus,we calculated the host specialization/generalization index (G) according to Medan et al.(2006).This index ranges from 0 (highly specialist) to 1 (highly generalist).
2.4.Ecological models of network determinants
The method and conception proposed by Vázquez et al.(2009b)were utilized in our study,in which the real observed interaction matrix is considered as a multiple interaction probability matrix resulting from different factors.Multiple interaction probability matrices were simulated for each factor,including the relative abundance of species (A),spatial overlap (S,absence/presence of mistletoes and hosts at each site),and functional traits of the interacting species (DBH,TH,TC,BR,and WD),or for different possible combinations from two or more factors following Sáyago et al.(2013).
Host functional traits (DBH,TH,TC,BR,and WD) and infection intensity were lg-or square root-transformed to fit normal distribution.Because a strong correlation between DBH and TH(r=0.77,P<0.001) was observed,four functional traits (DBH,TC,BR and WD) were included in the following analysis.To evaluate the predictive power of host functional traits on the interaction network,Generalized Linear Mixed-Effects Models (GLMM) were constructed in the R packagelme4to test the influence of fixed effects(host functional traits) and random effects (species,transects) on infection intensity (models were checked for the distribution of residuals,and appropriate error distributions were used).
The results of GLMM (Table S2) led us to include three host functional traits (DBH,TC,and WD) in the simulated interaction probability matrix analysis.In total,32 probability matrices were built (e.g.,model A was simulated by abundance of species,model AD by joint factors between species abundance and DBH),in which I rows and J columns correspond to the mistletoe and host species in the network,respectively.All the probability matrices are standardized so that all its elements sum to one (Sáyago et al.,2013).
We considered two methods to select the best model.First,a random method involved running 1000 simulated networks with the bipartite package.In this randomization algorithm,the observed interaction number (sum of the links in matrix Y) was randomly assigned to each cell according to the probability defined by different factors and their assembly.Eight additional indices,weighed NODF,connectance,modularity,generality,H2’,number of hosts,interaction asymmetry,and vulnerability were calculated for the 1000 simulated networks;the 95% confidence interval was determined for comparisons with indices of the real network(Vázquez et al.,2009b).Probability likelihood analysis was used as an additional method to investigate which of the above drivers offered the best fit for predicting the interactions between mistletoes and their hosts,as well as their strength,in the real networks.Following Vázquez et al.(2009b),the delta AIC (ΔAIC) was used to evaluate the power of each probability model to predict the likelihood of mistletoe-host interactions.A data set of the mistletoe and host (including uninfected potential host) network was extracted because of the WD deficiency;overall,207 plant species and 22 mistletoe species were included in the multiple interaction probability network analysis.Network statistics were calculated including uninfected woody species in transects,while allowing simulations of a scenario in which all woody species can potentially be colonized by mistletoes and testing whether the factors considered explain the absence of mistletoe on certain woody species.
2.5.Phylogenetic reconstruction
Phylogenetic relationships among mistletoe species were inferred using nuclear and chloroplast DNA regions.Voucher specimens were deposited at the Xishuangbanna Tropical Botanical Garden herbarium.We sampled 22 mistletoe species from Loranthaceae and Santalaceae.The voucher information and GenBank accession numbers are listed in Table S3.Erythropalum scandenswas used as the outgroup species.
Genomic DNA was extracted from the silica gel-dried tissues or herbarium materials using the cetyltrimethylammonium bromide procedure(Doyle and Doyle,1987).Polymerase chain reactions and sequencing were performed using the primers designed by Taberlet et al.(1991) and Vidal-Russell and Nickrent (2008).Sequences were aligned using GeneiousPrime 2020.2.4 (https://www.geneious.com,Biomatters,Ltd.,Auckland,New Zealand;Kearse et al.,2012).We conducted further phylogenetic analysis of the combined data set of three DNA regions (ITS,rbcL,trnL-F) using Bayesian inference (BI).The BI tree was generated based on the general time reversible with a proportion of invariable sites and gamma distribution rate (GTR+I+G) substitution model with 1000 bootstrap replicates.The Akaike information criterion (AIC)was used to determine the best-fitting model for the combined data set,as implemented in jModelTest v.2.1.6(Darriba et al.,2012).The phylogenetic tree of mistletoe species was used to confirm the accuracy of placement of the 22 mistletoe species identified in this study (Vidal-Russell and Nickrent,2008b;Nickrent and Malécot,2008;Nickrent et al.,2010).For species represented in multiple studies,the topology of the tree generated in this study was congruent with previous work (Der and Nickrent,2008;Vidal-Russell and Nickrent,2008b;Nickrent et al.,2010).
Theplantlistpackage of R(https://www.r-project.org)was used to verify the scientific names of species andV.PhyloMaker2package was used to reconstruct the phylogenetic relationships of host species based on the updated mega-phylogeny of plants (Jin and Qian,2022) and Angiosperm Phylogeny Group (APG) IV (http://www.theplantlist.org/).A total of 280 species were included in the host phylogenetic tree for subsequent analyses.
2.6.Evolutionary analysis of mistletoe-host network
We estimated the phylogenetic signal for theZandCvalues of each mistletoe and host species (uninfected potential hosts were excluded) using Pagel's lambda (λ) value in thepicantepackage(Kembel et al.,2010).We also estimated the phylogenetic signal ofGusing Pagel's λ.This was calculated based on Pagel's phylogenetic dependence estimator using thegeigerpackage to test if either the mistletoes,hosts,or both tended to be distributed in the same module(Pagel,1999),which can either be derived from a Brownian motion model(λ=1)or random model(λ=0)(Cooper et al.,2010).The significance of the phylogenetic signal was tested using the loglikelihood ratio and was compared with 999 simulated random models (Cooper et al.,2010).
The Mantel test was used to test the relationship between similarities in the observed interaction matrix and phylogenetic distance among host and mistletoe respectively,using the“mantel function”in theecodistpackage(Goslee and Urban,2007;Rezende et al.,2007).For the Mantel test,a significance test of the association between the matrices was based on 10,000 randomised permutations.
3.Results
3.1.General information on bipartite networks
A total of 473 unique links comprising 22 mistletoe species (2 families and 10 genera) and 280 host species (60 families and 180 genera,270 host species for Loranthaceae mistletoe,and 24 host species for Santalaceae)with connectance(0.08) were recorded in the survey.Different types of host plants,including trees,shrubs,lianas,and herbs,of exotic and native species,were identified.The most parasitised plants were trees (89.3%) followed by shrubs(8.6%) and lianas (1.8%).Network level analyses revealed that mistletoes and hosts were significantly nested (weighted NODF=20.89,P<0.001),as can be seen in Fig.1.The index of modularity (M=0.42,P<0.001) indicates the network was modular.We also detected significant specialisation (H2’=0.68,P<0.001) and high asymmetry (ISA=-0.44,P <0.001).The generality of mistletoe is 56.33,while vulnerability for host is 1.64.
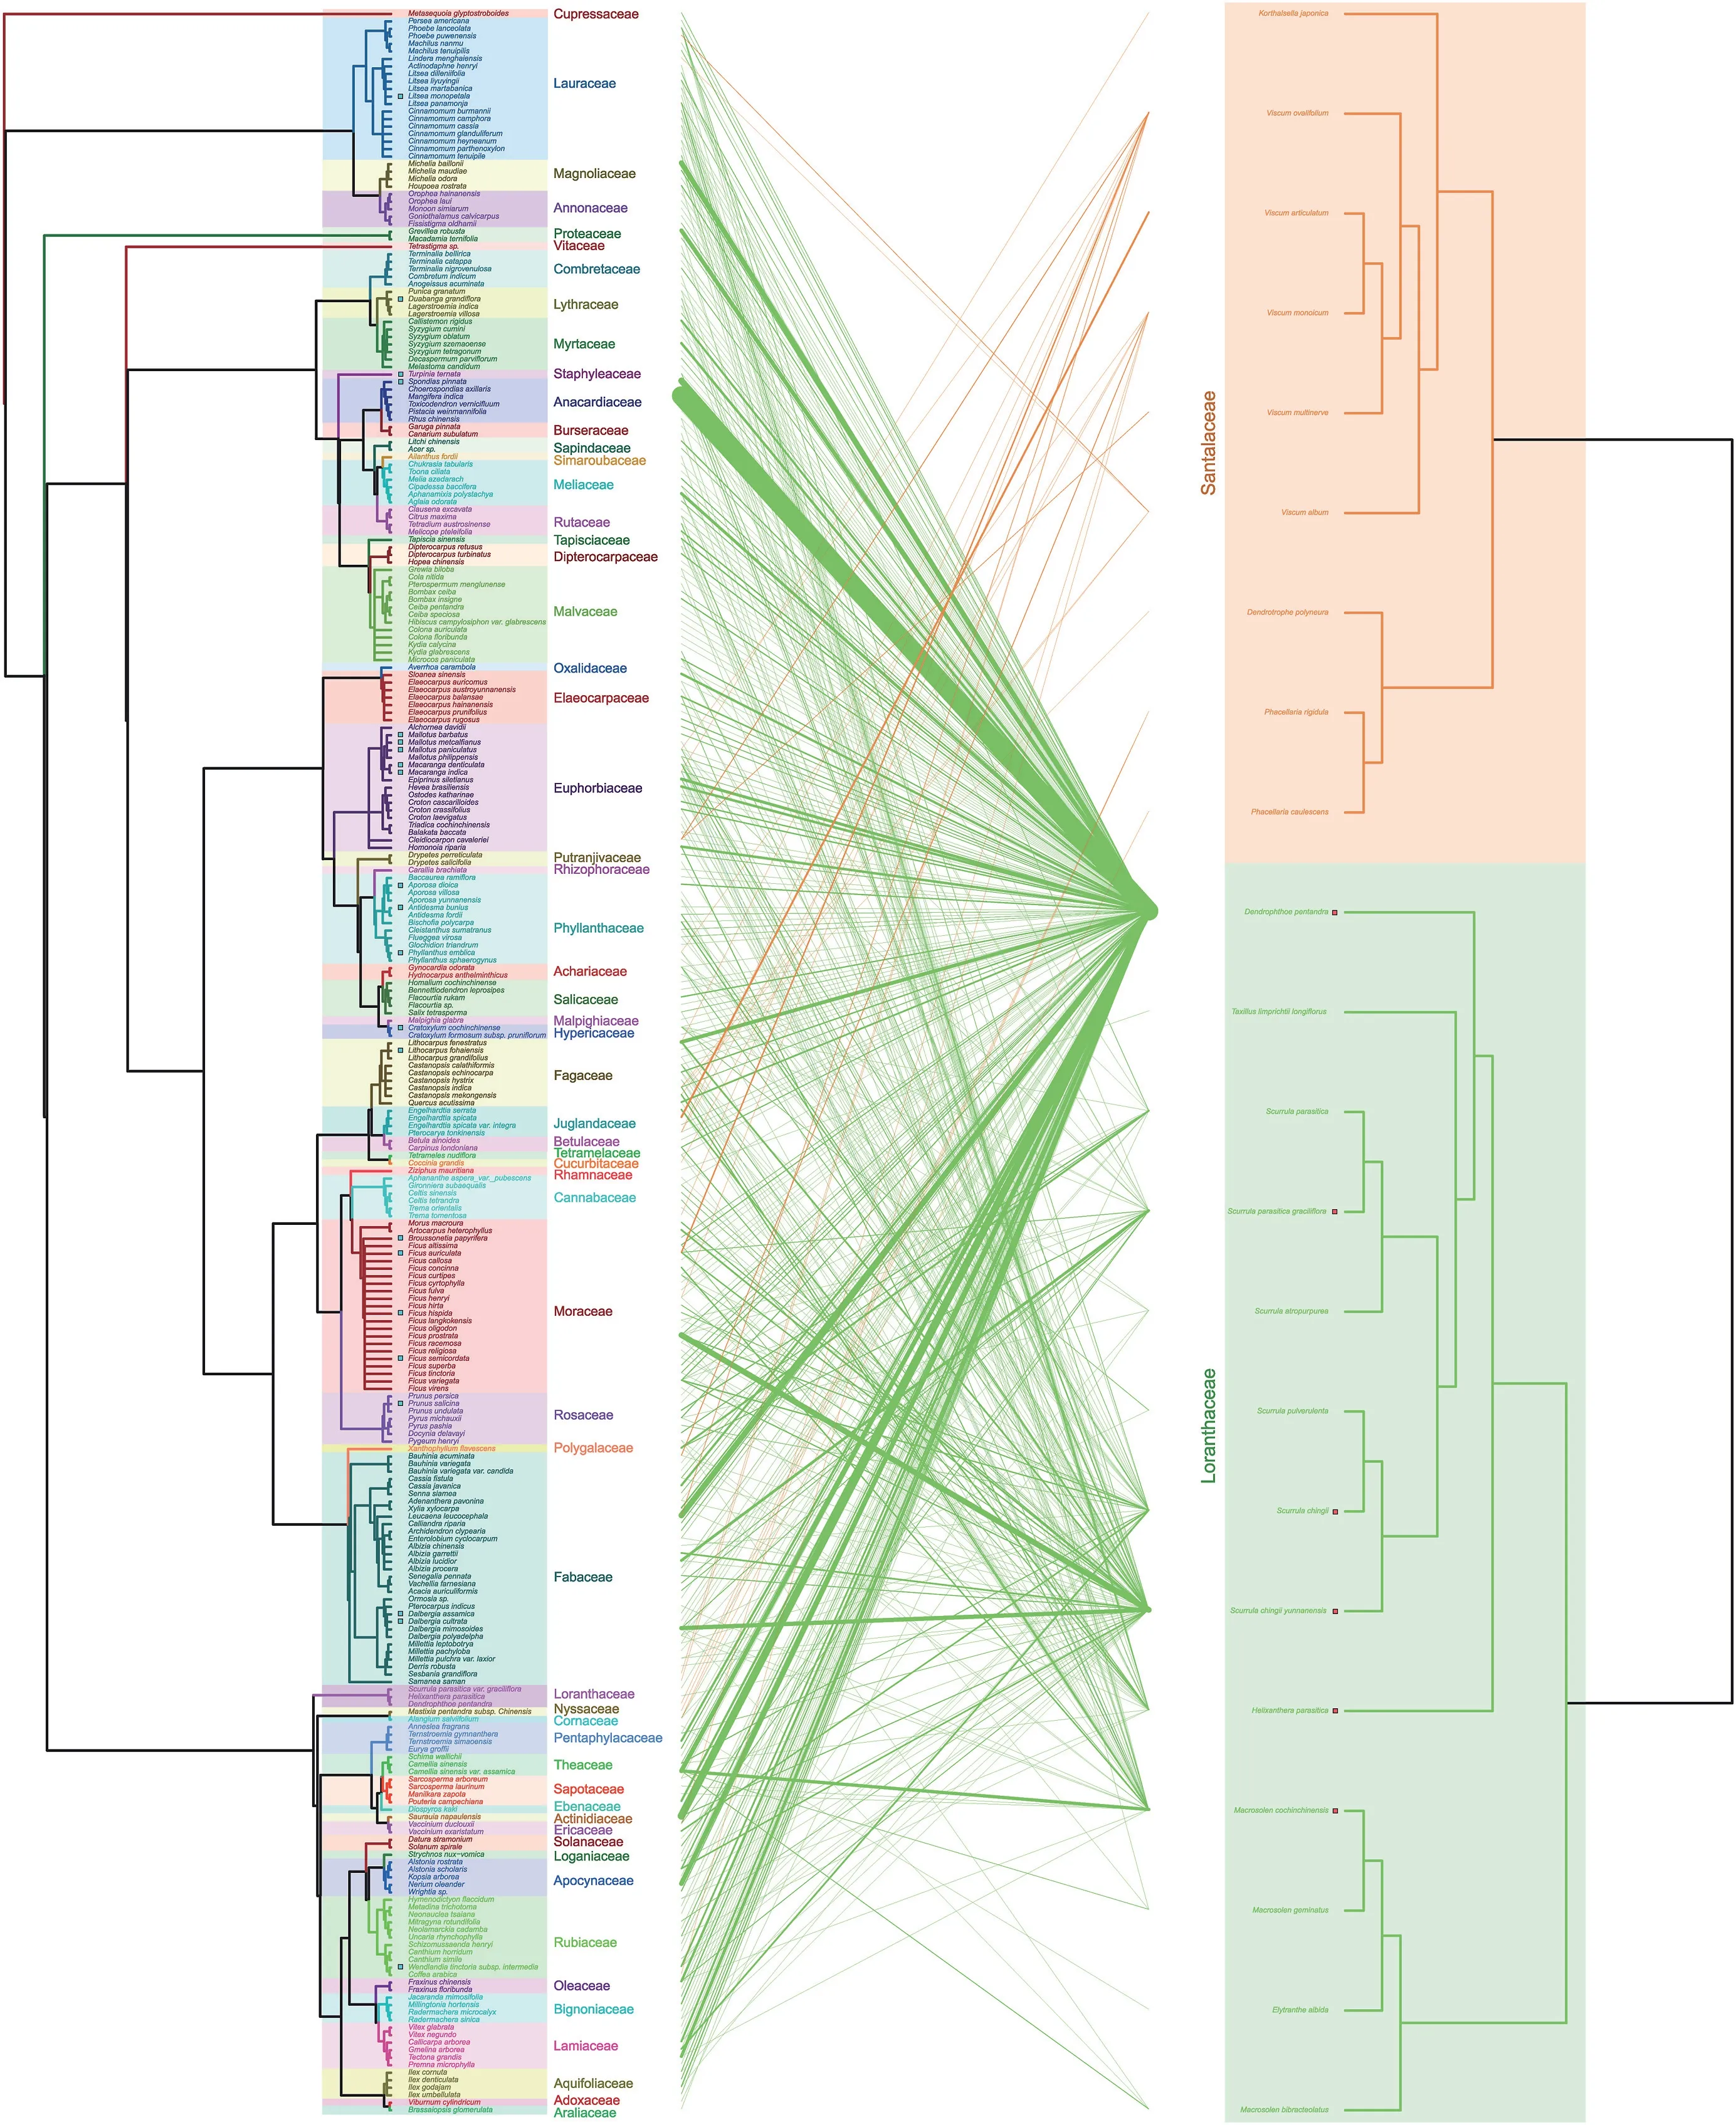
Fig.1.Bipartite interaction between host and mistletoe species(Note:this is a sub-data set because some of the host species were missing in the published meta-phylogenetic tree).Left,host;right,mistletoe;link width,interaction strength.The red square between branch and species indicates the module hub,while the blue square indicates the connector.Species without squares indicate the peripheral.Colors highlighting species indicate families of host and mistletoe.
Mistletoe species at higher trophic levels,such asPhacellaria caulescensandP.rigidula,also parasitised other mistletoe species,includingDendrophthoe pentandraandHelixanthera parasitica.D.pentandrawas recorded as the most generalist,with 207 host species identified,followed byScurrula chingiivar.yunnanensis,Macrosolen cochinchinensis,S.chingii,andH.parasitica,with 78,41,36,and 33 host species,respectively.The mean number of mistletoe individuals per host was 15.1 ±1.8.
The mistletoe species contributed differently to the network(Fig.1).Six mistletoe species were module hubs (D.pentandra,M.cochinchinensis,H.parasitica,S.chingii,S.chingiivar.yunnanensis,andScurrula parasiticavar.graciliflora),whereas the other mistletoe species were peripheral;most mistletoe species from Santalaceae were peripheral.Furthermore,22 host species were connectors,while others were peripheral,as displayed in Fig.1.
Furthermore,host generality,as indicated by the G value,was only marginally higher in Loranthaceae than in Santalaceae(F=5.79,df=21),but this difference was statistically significant(P=0.026,Fig.2).
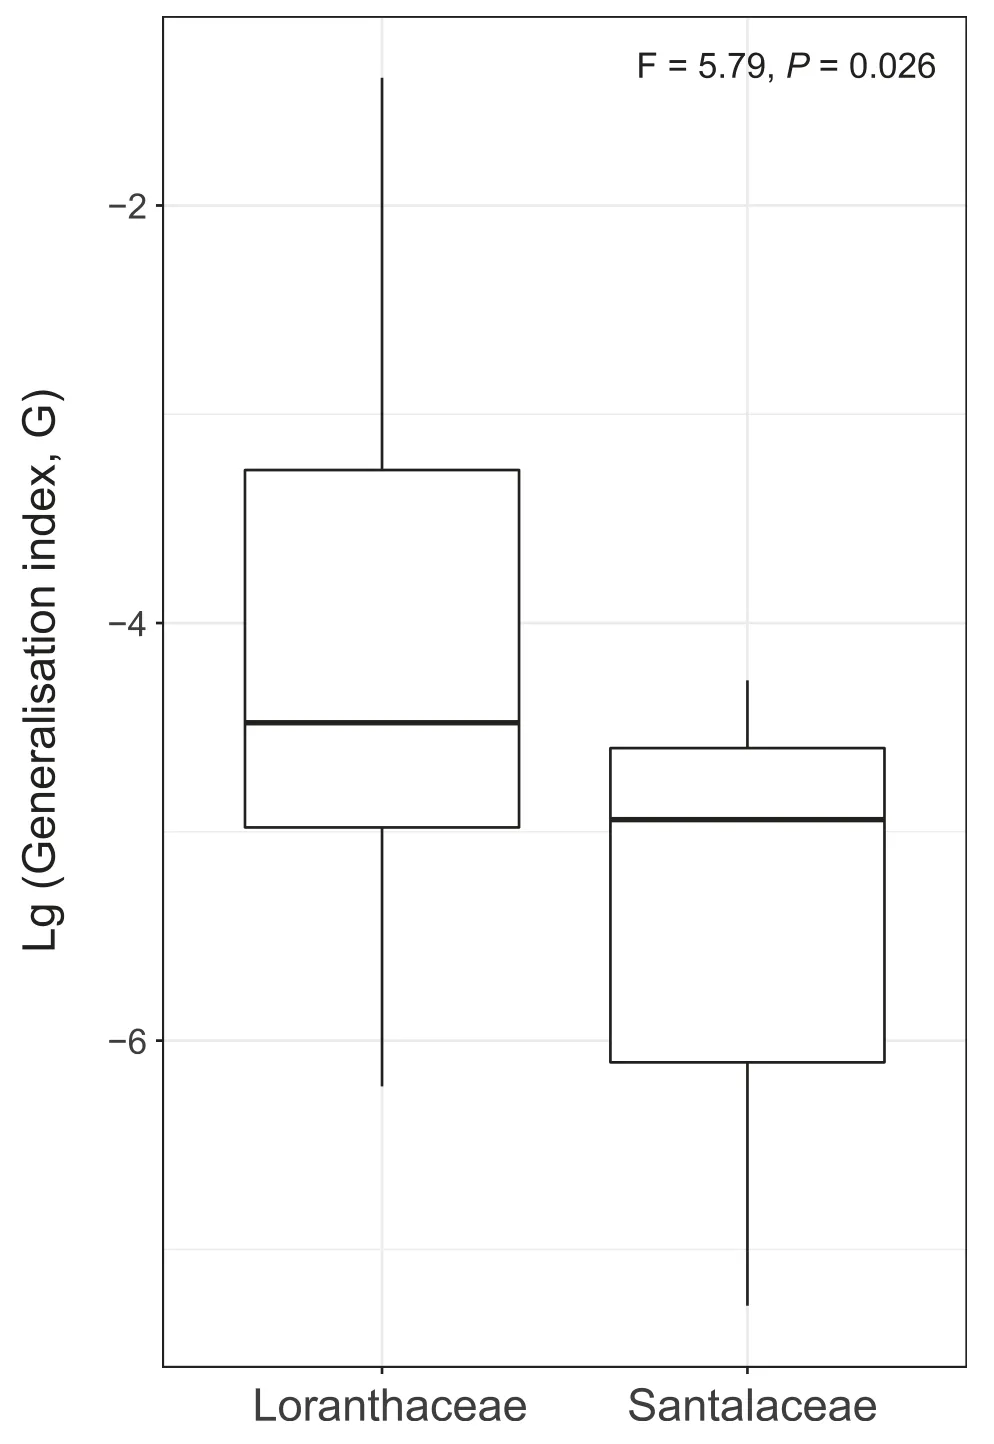
Fig.2.Host generalisation for Loranthaceae and Santalaceae mistletoe species,as observed in the parasite-host network analysis conducted in Xishuangbanna,Yunnan Province,China,from 2015 to 2017.
3.2.Determinants predicting interaction networks
Generalized Linear mixed model results demonstrated that DBH and TC were positively correlated with host infection (Fig.S2)(R2=0.09,P<0.001 for DBH;R2=0.08,P<0.001 for TC) but negatively correlated for WD (R2=0.01,P<0.001).Of the 32 models adapted to predict the observed interacting matrix between mistletoe and host species,the relative species abundance (A)model was the best fit to predict the interaction network according to the ΔAIC value (Fig.3).When the network structure was compared,abundance model (A) and joint model including abundance and spatial overlap(AS)in general provided better prediction than other models (Figs.4 and S3).

Fig.3.Delta Akaike Information Criterion(ΔAIC)values for the model determinants of parasite-host network structure,incorporating data on species abundance (model A),tree coverage (model C),diameter at breast height (model D),wood density (model W),spatial overlap (model S),observed data (model Obs),and null model (model N).
Different models were identified for predicting network indices(Fig.5).The models jointly including abundance,DBH,spatial overlap and wood density(ADSW)performed well for the weighed NODF (Fig.5).For other network indices such as connectance,mordularity,generality,vulnerability,ISA,H2’ and number of host species,models joined with abundance (A) supplied better predictions than other models,indicating abundance contributed the most to explaining the observed patterns (Figs.5 and S4).
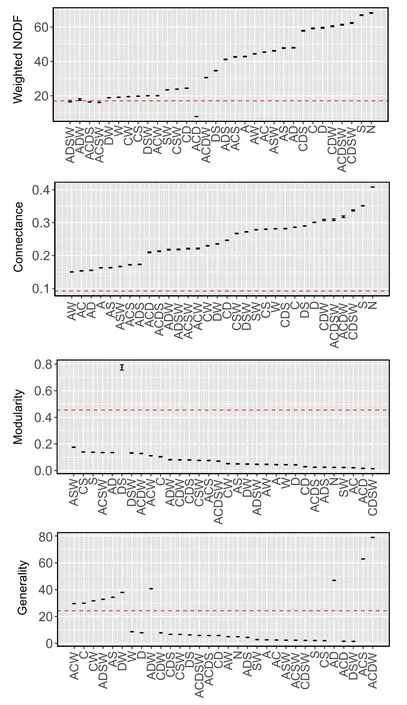
Fig.5.Characteristics of the observed mistletoe-host interaction network and networks based on the model determinants of network structure(mean±CI).The dashed line indicates the observed value(model A:abundance model;model C:tree coverage model;model D: diameter at breast height (DBH) model;model W: woody density model;model S: spatial overlap model;model AD: abundance*DBH model;model N:null model).
3.3.Evolutionary analysis of mistletoe-host network
Strong phylogenetic signal was detected for mistletoe species in the entire mistletoe-host network (Mantel value=0.32,zscore=4.64,P=0.001;Table 1).Only theCvalue showed a strong phylogenetic signal for mistletoe species in the sub-data from the Loranthaceae networks(Table S4),whereas both theCandZvalues of host and mistletoe species in the entire mistletoe-host network and Santalaceae network failed to indicate phylogenetic signals.Phylogeneticsignalwasnot detectedforGvaluesof the22mistletoespecies or the two lineages(Loranthaceae and Santalaceae)(Table S4).

Table 1 Mantel test results of the phylogenetic signal for mistletoe and host plants bipartite interaction in Xishuangbanna,Yunnan Province,China,from 2015 to 2017,based on parasite-host network analysis.
4.Discussion
Our study included a comprehensive overview of mistletoe-host plant interactions,including 280 host species,22 mistletoe species,and 473 links in a biodiversity hotspot.Generally,the relative abundance of species and the spatial distributions of mistletoe and host plants provided the best prediction of the interaction network,suggesting that the neutral interaction hypothesis is applicable for predicting this antagonistic network.Furthermore,mistletoe species had significant phylogenetic signals for their hosts.However,there were significant differences between the two main lineages (Loranthaceae and Santalaceae).Specifically,Loranthaceae presented higher host generality than Santalaceae but no phylogenetic signal was observed lined to this generality.This interesting pattern may shed light on how evolutionary history shapes the current interaction network of mistletoes and their hosts.
4.1.Determinants predicting interaction networks
It is also obvious that biological factors such as the TC,DBH,and WD of hosts affect the establishment of mistletoe-host interactions.For instance,larger trees might provide more spatial and structural capacity for birds(Roxburgh and Nicolson,2008;Rawsthorne et al.,2011),which in turn allows higher mistletoe densities (Reid and Smith,2000;Aukema and Martinez del Rio,2002;Roxburgh and Nicolson,2008).Other functional traits unassociated with infection such as leaf traits were unable to predict the mistletoe-host network structure (Blick et al.,2012).
In addition,the abundance of species and their spatial distribution also contributed to predicting network structure and the strength of mistletoe-host pairwise interactions in this epiphytic commensalism.Blick et al.(2013)found that mistletoes clump on few trees and interaction strength between mistletoes and hosts are independent on the number of trees.However,they surveyed only a set number of woody trees instead of all trees in transects and only four mistletoe species were detected in the network;therefore,the contribution from abundance of trees might be underestimated.Our results are consistent with previous findings for mistletoes (Norton and Carpenter,1998;Fadini,2011;Sáyago et al.,2013),and our results also indicate that neutrality contributes to the network structure to a certain extent (Vázquez et al.,2007;Stang et al.,2009).That is,a network in which assembly includes both abundance and spatial overlap indicates that random encounters of individuals (no matter what species they belong to) concurring in space contribute largely to the network structure.
In addition,ecological differences among epiphytic species,such as the specific difference in their susceptibility to nutrients,light,or humidity levels,and substrate suitability,may cause differentiation in host preference.Furthermore,mistletoe-host interactions may be influenced by other factors,including seed dispersal,which affects the spatial distribution of mistletoes (Muller-Landau et al.,2002;Pequeno et al.,2022).One study has examined how different frugivorous assemblages of mistletoes alters dominance of mistletoes and,consequently,creates a non-nested and modular pattern of antagonistic interaction between mistletoes and hosts(Genini et al.,2012).However,our study did not investigate the effect of these factors on mistletoe-host interactions in Loranthaceae and Santalaceae at Xishuangbanna.
4.2.Evolutionary analysis of mistletoe-host network
We found that closely related mistletoe species parasitise similar host species.The asymmetry of phylogenetic conservatism of interactions are common and often differs between trophic levels in the same network (Bergamini et al.,2017;Maliet et al.,2020).For example,phylogenetic signals are ubiquitous in plant-pollinator and plant-herbivore networks (Rezende et al.,2007;Edger et al.,2015;Fontaine and Thébault,2015;Gilbert et al.,2015;Aizen et al.,2016;Ibanez et al.,2016;Hutchinson et al.,2017;Cirtwill et al.,2020),and previous studies have indicated that these networks often display asymmetric phylogenetic signals.For example,stronger phylogenetic signals have been found for pollinators than for plants,while herbivorous insects showed weaker signals than the plants they feed on(Fontaine and Thébault,2015;Aizen et al.,2016;Vitória et al.,2018).Our study indicates that the phylogeny of mistletoe drives the evolution of the mistletoe-host network,implying that infection-related traits are more conservative than the defence traits of the host plant.In antagonistic interactions,the phylogenetic conservatism is frequently stronger at lower trophic (resource) levels than higher tropic (consumer) level (Krasnov et al.,2012;Elias et al.,2013;Fontaine and Thébault,2015),suggesting that negative indirect interactions promote a shift in interaction partners and lower conservatism for resource level.For example,the unique mucilaginous viscin that coats seeds contributes to their attachment to woody branches(Muche et al.,2022).Furthermore,closely related hosts co-occur in the same module more often than expected by chance;in contrast,this is rarely the case for parasites (Rezende et al.,2009;Krasnov et al.,2012),and our results show a similar pattern.This pervasive asymmetric pattern implies that the antagonistic network could be largely shaped by competition,limiting resource overlap among closely related consumer species(Elias et al.,2013).Mistletoe species depend on host species to survive,resulting in strong competition for limited resources,thereby facilitating the plasticity of mistletoe and host interactions.
4.3.Host generality of Loranthaceae vs.Santalaceae
Mistletoes are obligate hemiparasites that depend on hosts for resources,including water and nutrients,and vary in their host infection preference or specificity (Press and Phoenix,2005;Okubamichael et al.,2016).Most mistletoe species infect only one or a small number of hosts,penetrating their vascular systems to obtain water and nutrients.Consequently,host specificity likely results from evolutionary adaptations to circumvent the defensive systems of particular host species.
In our study,Santalaceae and Loranthaceae mistletoes share a similar region,and both have specialist and generalist representatives.There was also some degree of overlap in host usage observed for members of these two families(Fig.1).However,we found that the host specificity of Santalaceae was significantly higher than that of Loranthaceae.We propose several hypotheses to explain this pattern.Firstly,previous studies have suggested that mistletoes distributed in diverse regions tend to be host generalists;in contrast,mistletoes in barren regions tend to be specialists(Barlow and Wiens 1977;Norton and Carpenter,1998).However,Amico et al.(2019) demonstrated that mistletoes with large geographic ranges also have large host ranges,but less diverse regions have more specialized mistletoes.Loranthaceae mistletoes are distributed worldwide (Nickrent et al.,2019),whereas Santalaceae occur mainly in temperate regions,with some representatives in the tropics.Thus,differences in host specificity could represent differences in distribution ranges.Secondly,differences in host generality may be an outcome of their evolutionary history(Norton and De Lange,1999).Members of the Santalaceae tend to parasitize modern host lineages (Fig.2),whereas the host range of Loranthaceae is wider.Previous studies have estimated that eremolepidaceous mistletoes of Santalaceae evolved ca.53 Mya and Loranthaceae more recently,approximately 28 Mya (Vidal-Russell and Nickrent,2008a).The comparatively recently-evolved Loranthaceae likely experienced rapid adaptive radiation and speciation during the Oligocene(Vidal-Russell and Nickrent,2008b).This process could be coupled with host generality co-occurring with the diverse tropical flora during that historic period.
5.Conclusions
This study presents an example of how evolutionary history shapes today’s antagonistic interaction networks.Specifically,the neutral interaction hypothesis provides accurate predictions of the parasite-host interaction network,and mistletoe species show significant phylogenetic signals for their hosts.The two lineages of mistletoes evaluated here showed distinct patterns of interaction,with Loranthaceae displaying higher host generality than Santalaceae.Furthermore,the coexistence of diverse tropical flora during the Oligocene might have contributed to the diversification of Loranthaceae along with their host generality.Therefore,network interactions may provide valuable information on how the evolutionary “theatre” shapes current ecological “plays”.To fully understand parasite-host interactions other symbiotic interactions between mistletoes and pollinators,dispersers,and/or herbivores,among others,should also be taken into consideration.Therefore,to better understand the mechanisms of species interactions and community structure,future research should consider different levels of interactions with parasitic plants in the natural community and within the context of their evolutionary history.
Authors’ contributions
YL,LZ,and JC conceived the study.YL,XW,ML,and LZ conducted the fieldwork.JZ,YL,and WY analysed the data,and JZ wrote the first draft of the manuscript with guidance from JC and LZ.All authors read and approved the final version of the manuscript.
Data availability statement
The data that support the findings of this study are openly available at https://doi.org/10.5061/dryad.zgmsbccf8.
Declaration of competing interest
The authors declare that they have no conflict of interest.
Acknowledgements
We thank Mr.Qiaoshun Li and Mrs.Chunfen Xiao of Xishuangbanna Tropical Botanical Garden (XTBG) for their assistance with the field work.We thank Dr Yanhui Zhao from Key Laboratory for Plant Diversity and Biogeography of East Asia,Kunming Institute of Botany,Chinese Academy of Sciences,for helping with network data analysis.This study was financially supported by the National Natural Science Foundation of China (Grant No.31670393 and 32270310).We thank the authorities from the Xishuangbanna National Nature Reserve Bureau to conducting this study.We would like to thank Editage (www.editage.cn) for English language editing.
Appendix A.Supplementary data
Supplementary data to this article can be found online at https://doi.org/10.1016/j.pld.2023.03.008.
- 植物多样性的其它文章
- The worldwide allometric relationship in anatomical structures for plant roots
- Phylogeny,character evolution,and classification of Selaginellaceae (lycophytes)
- Effects of land-use types and the exotic species, Hypochaeris radicata,on plant diversity in human-transformed landscapes of the biosphere reserve,Jeju Island,Korea
- Soil water content and nitrogen differentially correlate with multidimensional leaf traits of two temperate broadleaf species
- Germplasm resources and genetic improvement of Akebia:A new fruit crop in China
- Root structure syndromes of four families of monocots in the Middle Urals