
X-Ray Properties of PSR J1811-1925 by NuSTAR
2024-01-06 06:39JinTaoZhengMingYuGeandXiangHuaLi
Jin-Tao Zheng , Ming-Yu Ge, and Xiang-Hua Li
1 Department of Astronomy, Yunnan University, Kunming 650090, China; zjt_@mail.ynu.edu.cn, gemy@mail.ihep.ac.cn
2 Key Laboratory for Particle Astrophysics, Institute of High Energy Physics, Chinese Academy of Sciences, Beijing 100049, China; xhli@ynu.edu.cn
Abstract We analyzed the spectral properties and pulse profile of PSR J1811–1925, a pulsar located in the center of composite supernova remnant (SNR) G11.2–0.3, by using high timing resolution archival data from the Nuclear Spectroscopic Telescope Array Mission(NuSTAR).Analysis of archival Chandra data over different regions rules out the SNR shell as the site of the hard X-ray emission while spectral analysis indicates that the NuSTAR photons originate in the pulsar and its nebula.The pulse profile exhibits a broad single peak up to 35 keV.The jointed spectrum by combining NuSTAR and Chandra can be well fitted by a power-law model with a photon index of Γ=1.58±0.04.The integrated flux of jointed spectrum over 1–10 keV is 3.36×10⁻¹² erg cm−2 s−1.The spectrum of pulsar having photon index Γ=1.33±0.06 and a 1–10 keV flux of 0.91×10⁻¹² erg cm−2 s−1.We also performed the phase-resolved spectral analysis by splitting the whole pulse-on phase into five phase bins.The photon indices of the bins are all around 1.4, indicating that the photon index does not evolve with the phase.
Key words: (stars:) pulsars: individual (PSR J1811-1925) – stars: neutron – methods: data analysis
1.Introduction
PSR J1811–1925 is an X-ray pulsar located at the center of supernova remnant G11.2–0.3, a young core-collapse supernova remnant (CC SNR) (Madsen et al.2020).The system is composed of a shell emitting soft X-ray radiation, a pulsar at the center with pulsar wind nebulae(PWN)around(Dean et al.2008).In the radio image by VLA and X-ray image by Chandra, the outer boundary of G11.2–0.3 shows a nearcircular structure (Borkowski et al.2016).G11.2–0.3 is one of the youngest CCSNRs in the Milky Way with age ∼3600 yr(Torii et al.1999).The supernova remnant is associated with the “guest star” event recorded in AD 386 (Clark 1978).However, the high visual extinction toward G11.2–0.3,obtained both from [Fe II] observations and from absorption measurements toward the PWN and the shell, rules out the association of G11.2–0.3 with any naked-eye event seen on Earth (Koo & Lee 2015; Borkowski et al.2016), in particular with the AD 386 event.According to the measurement of nebular expansion rate in the X-ray range by Chandra Observatory, the age of the SNR is estimated to be between 960 and 3600 yr(Tam&Roberts 2003).The out-flowing wind is non-spherical and more likely to be limited to a bipolar outflow (Roberts et al.2003).
PSR J1811–1925 was discovered in X-rays by ASCA, with spin period P=65 ms and ˙P4.4 1014s s1= ×--.Its magnetic field is about B ∼1012G, and its spin-down energy loss ratesE˙ ~ 6 × 1036erg s-1(Torii et al.1997,1999).The pulse signal is detected both in near-infrared (Moon et al.2009) and X-ray band(Kaspi et al.2001).But no pulse signal was detected in GeV by Fermi-LAT(Acero et al.2016)and in the radio band(Tam&Roberts 2003).The characteristic age of PSR J1811-1925 is 23.3 kyr,which is significantly older than G11.2-0.3(Kaspi et al.2001).The flux is (1.22±0.21)×10−11erg cm−2s−1in the soft γ-ray (20–100 keV) band by INTEGRAL/ISGRI (Kuiper& Hermsen 2015).It is suggested that the hard X-ray radiation comes from the pulsar in the center of the supernova remnant.Using the high sensitivity of the Nuclear Spectroscopic Telescope Array Mission (NuSTAR) in the hard X-ray energy band (3–79 keV), we can explore the radiation mechanisms of pulsars in different emitting regions in more detail.In addition,the phase-resolved spectroscopy of the pulsar is a crucial method to study the emission generation mechanisms, and the phase-resolve spectrum of PSR J1811–1925 has not been reviewed yet.PSR J1811–1925 is a good sample for understanding the soft γ-ray pulsar population.
In this work, we introduced details of data reduction in Section 2.By combining data from NuSTAR and Chandra,we obtained the pulse profile, the jointed spectrum of PSR J1811–1925 and its PWN, pulse spectrum and phase-resolved spectroscopy of PSR J1811–1925, and these are presented in Section 3.Finally, we discuss and interpret these results in Section 4.
2.Observations and Data Reduction
2.1.NuSTAR Observation and Data Reduction

Table 1 Information of Observations
NuSTAR is a hard X-ray telescope with two instruments(usually labeled by their focal plane modules, FPMA and FPMB), operates in the band from 3 to 79 keV with excellent spectral resolutions (400 eV @ 6 keV, 900 eV @ 60 keV)(Harrison et al.2013).PSR J1811-1925 was observed by NuSTAR around June 22 2016(OBSID 90201027002)with an exposure time of 90 ks, see Table 1 for more details.
In this work, we analyzed NuSTAR data using HEASoft(version 6.28), standard nupipeline and nuproducts utilities (Version: 0.4.7) and NuSTAR CALDB v20210104.We extract the source spectrum from an circular region of radius 60″centered on the pulsar position at α=18h11m29 22 and δ=−19h25m27 6 by DS9 (version 4.1) (as shown in Figure 1),the background spectrum is extracted from a annular region of 60″–74″(Kaspi et al.2001).The arrival time of each event is corrected to solar system Barycenter (SSB) by tools barycorr with solar system ephemeris DE200.We extracted phase-resolved spectroscopy by dividing the whole pulse-on phase into five phase bins by using XSELECT,the background spectrum is extracted at phase regions (phase 0.6–0.7).The pulse spectrum of the pulsar is extracted at phase bins with prominent pulse signal.
2.2.Chandra Observations and Data Reduction
Chandra observed SNR G11.2–0.3 12 times from 2000 to 2013, with a wide field of view covering the remnant SNR G11.2–0.3.(Borkowski et al.2016).We selected data of ObsID 14831 based on its long exposure of about 180 ks and observation time close to that of our NuSTAR data(see Table 1 for more details).In the observation of ObsID 14831,the pulsar is positioned on the chip S3 of the Advanced CCD Imaging Spectrometer (ACIS) in the standard exposure mode (Kaspi et al.2001).
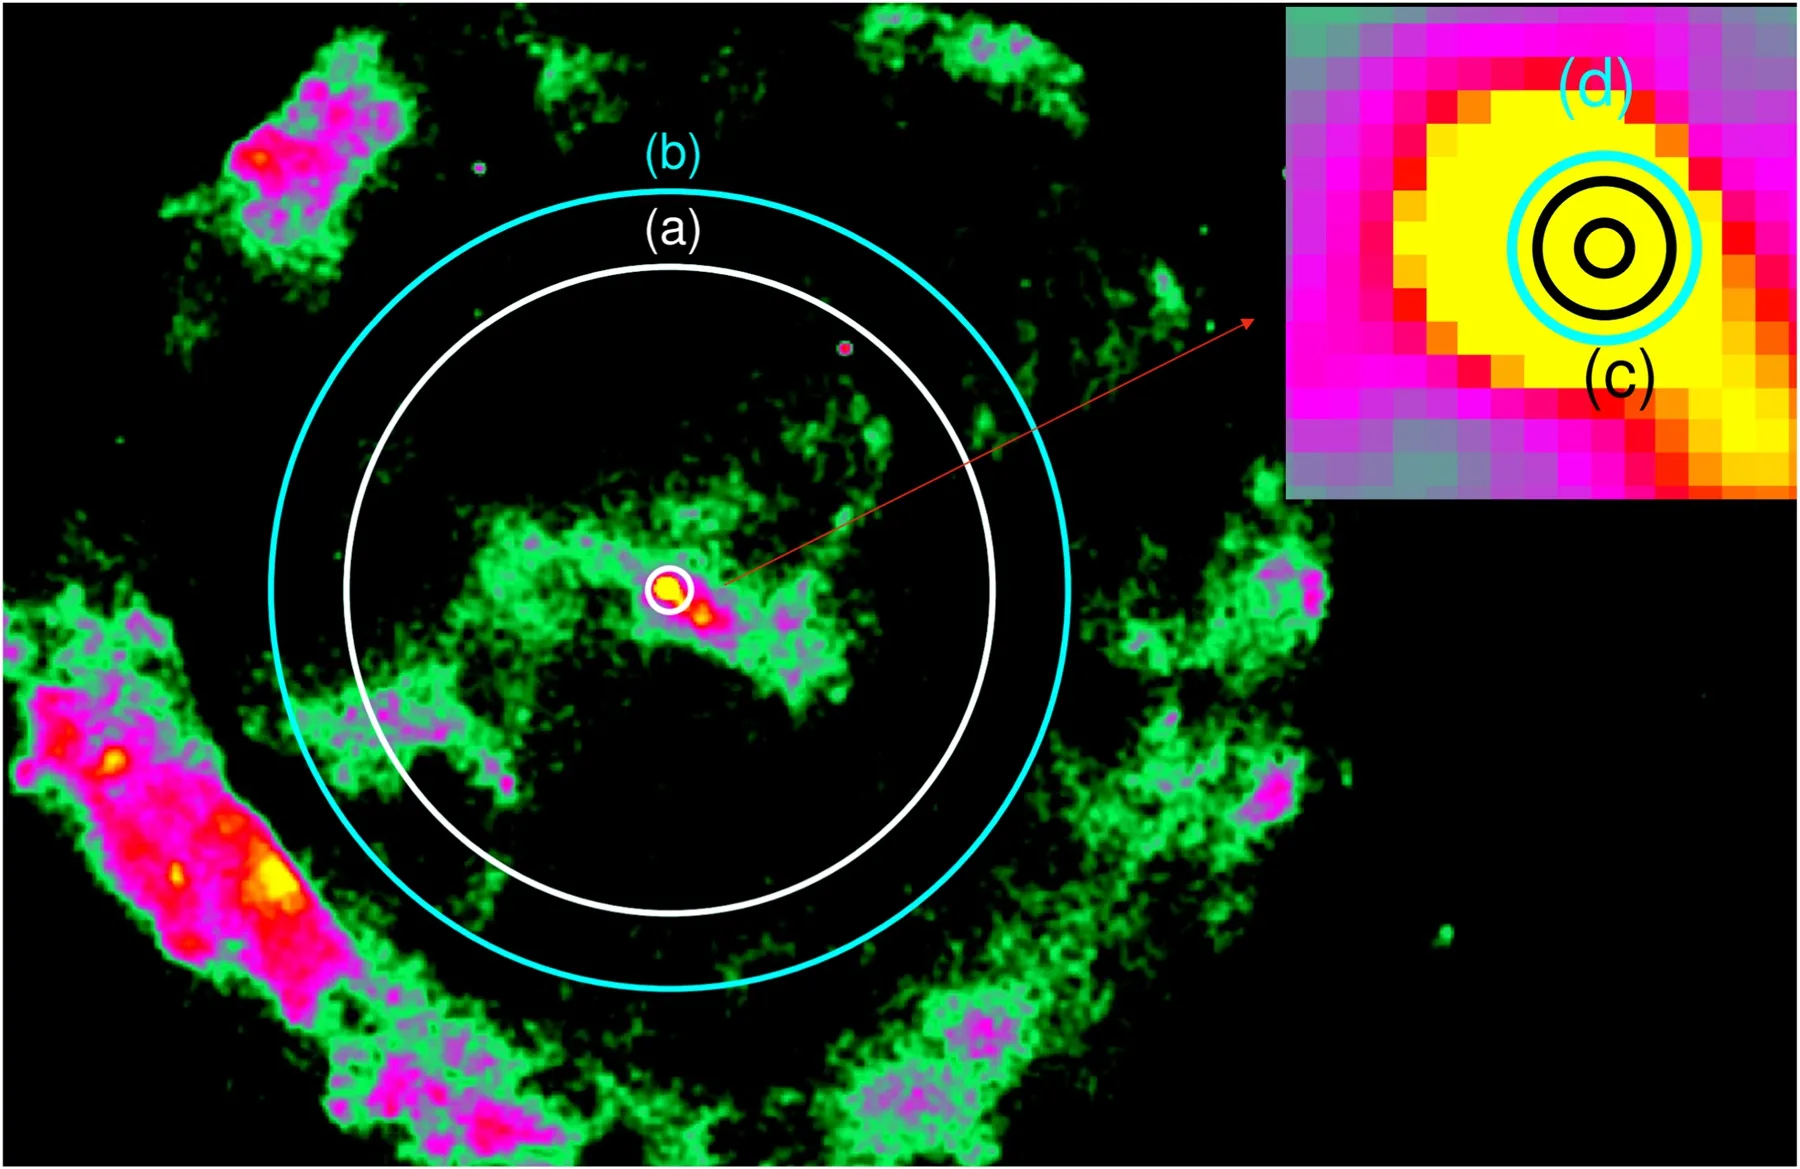
Figure 2.Chandra image of the region around PSR J1811–1925.White circles: (a) 0 3–60″, where the source spectrum is extracted; (b) 60″–74″, where the background spectrum is extracted.The spectra of pulsar and its background are extracted from annular region(region(c):0 3–1 0)and annular region(region(d):1 0–1 38) at the center region.
The Chandra data are analyzed and calibrated using the Chandra Interactive Analysis of Observations (CIAO V4.14)software package and the Chandra Calibration Database(CALDB V4.9.8), respectively.PSR J1811–1925 is a bright point source.To avoid the pile-up effect, we extracted the jointed spectrum of the source and background from two separate annular regions:region(a)with a range of 0 3–60″(as shown in Figure 2),and region(b)with a range of 60″–74″.See Figure 2 for visual reference.With an excellent angular resolution (about 0 5) of Chandra, the pulsar can be resolved from Chandra image.The spectrum of the pulsar can be extracted from an annular region(0 3–1 0,region(c)),and the spectrum of background is extracted from an annular region(1 0–1 38,region(d))(as shown in Figure 2),the selections of the regions are same with Roberts et al.(2003).
2.3.Timing Analysis
The time resolution of our data from Chandra observation is about 3.2 s, which is not suitable for timing analysis (Kaspi et al.2001).Here, we only perform timing analysis using NuSTAR data.
In our timing analysis, to maximize the signal-to-noise ratio of pulse profile, all events of FPMA and FPMB in 3–79 keV are selected to generate a integrated pulse profile.All events within source region “(a)” in Figure 1 are used for spin frequency searching and time of arrivals (TOA) of all these events are corrected to SSB.The pulse phase φ of each events arrived at time t is calculated by using a 1st-order Taylor expansion:
where φ0and ν are phase and spin frequency at the reference time t0.Then we obtained a pulse profile using all these photons with their phases.The best spin frequency is a frequency that makes the folded pulse profile deviate the most from a uniform distribution as represented by the Pearson χ2test.We search the best spin frequency by using this method and obtained a best spin frequency of ν=15.4564269(1)Hz at the epoch of T0=57563.0000001 MJD(Modified Julian Date),which is consistent with the period measured by Madsen et al.(2020).We plot our pulse profile in Figure 3.
2.4.Spectral Fitting
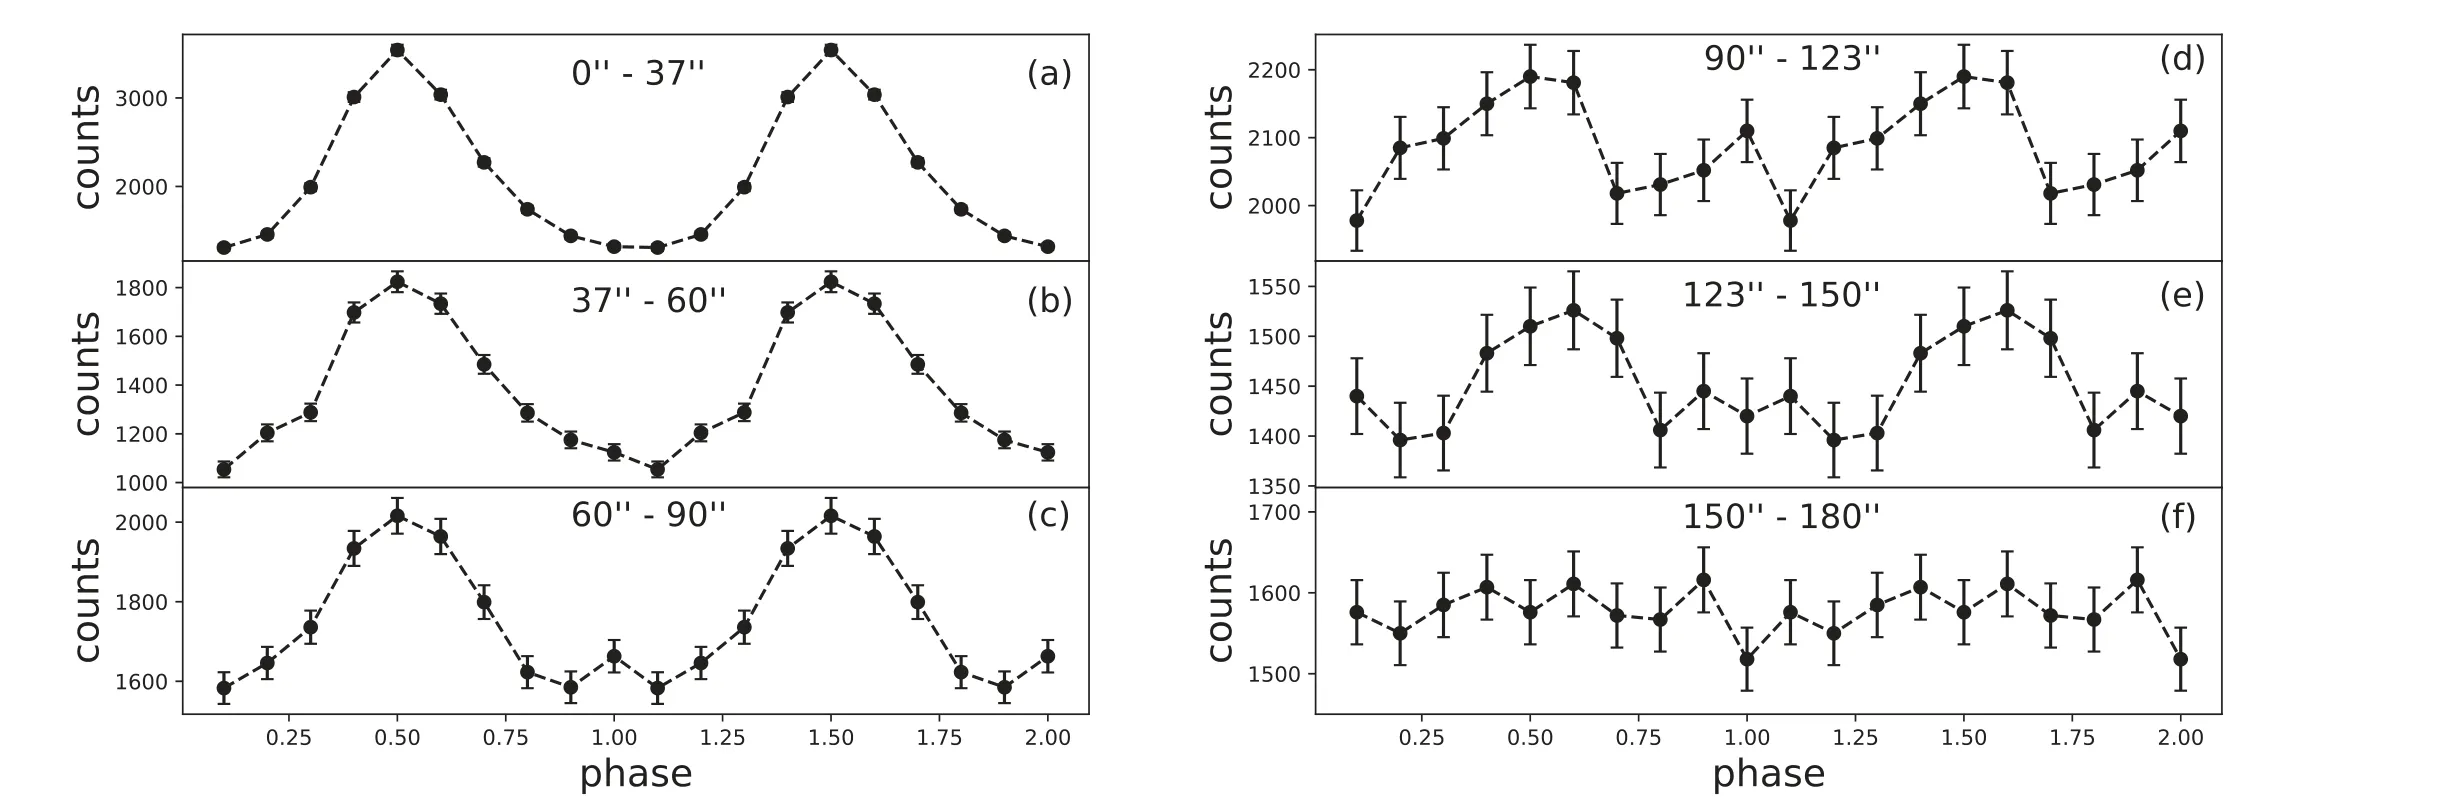
Figure 3.X-ray pulse profiles of PSR J1811–1925 in six regions, two pulse periods are presented for clarity.
The phase-averaged spectra are generated from Chandra and NuSTAR data.For NuSTAR data,we use grppha from FTOOL in order to obtain a better signal to noise ratio(S/N)spectrum.Both spectra of FPMA and FPMB are rebinned using grppha to a minimal bin of 16, 32, 128, 256 for channels range 1–224,225–480, 481–1248 and 1249–2016, respectively.For these spectra, we use χ2statistics for spectral fitting.For Chandra data, source and background are extracted from nearly the identical region as NuSTAR data (region (a) and (b) in Figure 2).The spectrum of the source from Chandra is rebinned using grppha to a minimal bin of 3 and 20 for channels range 69–137 and 138–697,respectively.The same group parameters are also applied to the pulse spectra of the pulsar and the phaseresolved spectra.The phase averaged spectrum is fitted with a Tuebingen-Boulder ISM absorption model multiplied a powerlaw plus a plane parallel shock model (see Borkowski et al.2001 for details of this model), given in XSPEC as: tbabs(powerlaw+vpshock)(Borkowski et al.2001).We produce the spectrum of the pulsar by combining Chandra(from an annular region of 0 3–1 0) and NuSTAR data (from the pulse-on phase).The phase-resolved spectra and the spectra of pulsars are fitted with a simple tbabs (powerlaw) model.
All the spectra are analyzed with XSPEC (version 12.11.1)(Arnaud 1996).Unless otherwise noted, the errors of spectral parameters are at 90% confidence level.
3.Results
3.1.Pulse Profile
With our best spin frequency of ν=15.4564269(1) Hz, we generated six pulse profiles by extracting photons from six different regions, 0″–37″, 37″–60″, 60″–90″, 90″–123″, 123″–150″, 150″–180″ from NuSTAR observations, to check whether the pulse signal exists.As shown in Figure 3, there is no apparent pulsed signal beyond a radius of 150″, which is consistent with result of Roberts et al.(2003).Figure 4 presents the pulse profiles over four energy ranges 3.0–6.0, 6.0–10.0,10.0–35.0, and 35.0–79.0 keV.The phases of single pulse peaks remain approximately constant throughout the four energy ranges, and all normalized pulse profiles show a single peak that is stable except for an increase in noise observed at the pulse profile at 35–79 keV.
3.2.Spectral Analysis
3.2.1.Whole Spectrum Around PSR J1811–1925
3.2.2.Spectrum of Pulsar
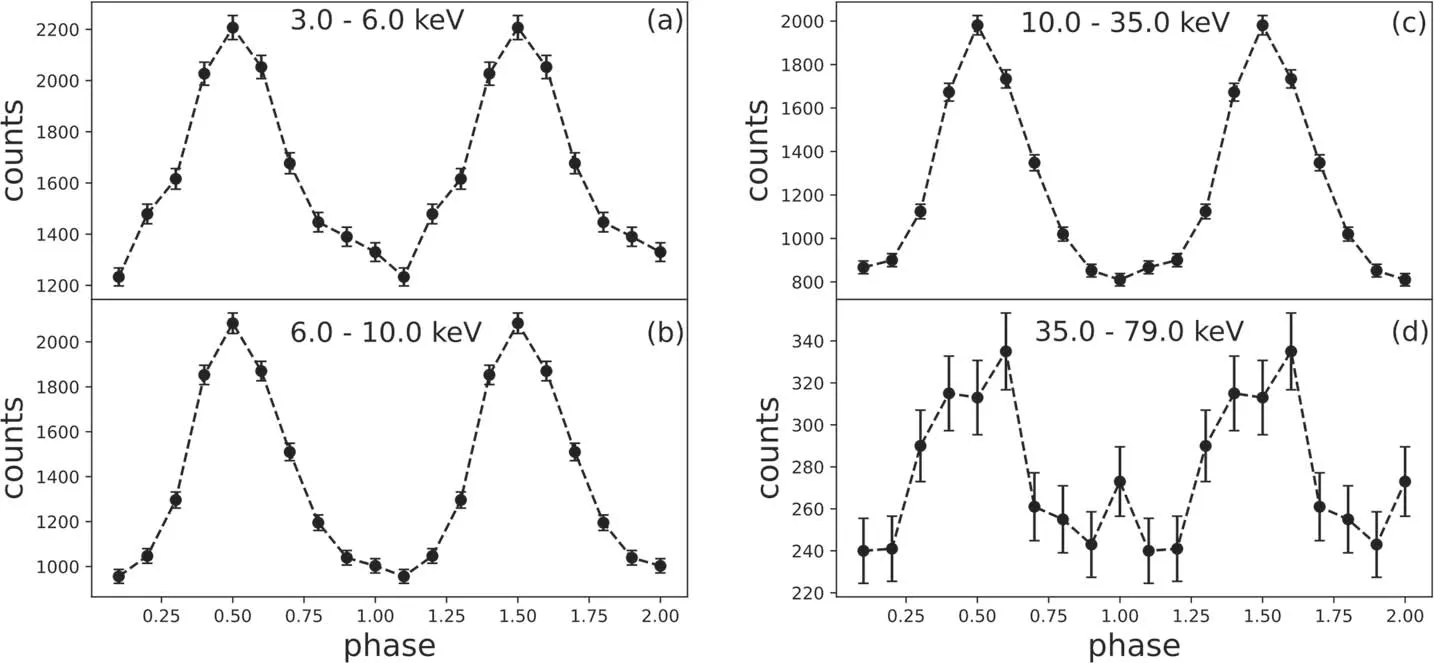
Figure 4.X-ray pulse profiles of PSR J1811–1925 in four energy ranges.We show two pulse periods for clarity,and pulse emission has been detected up to 35 keV.
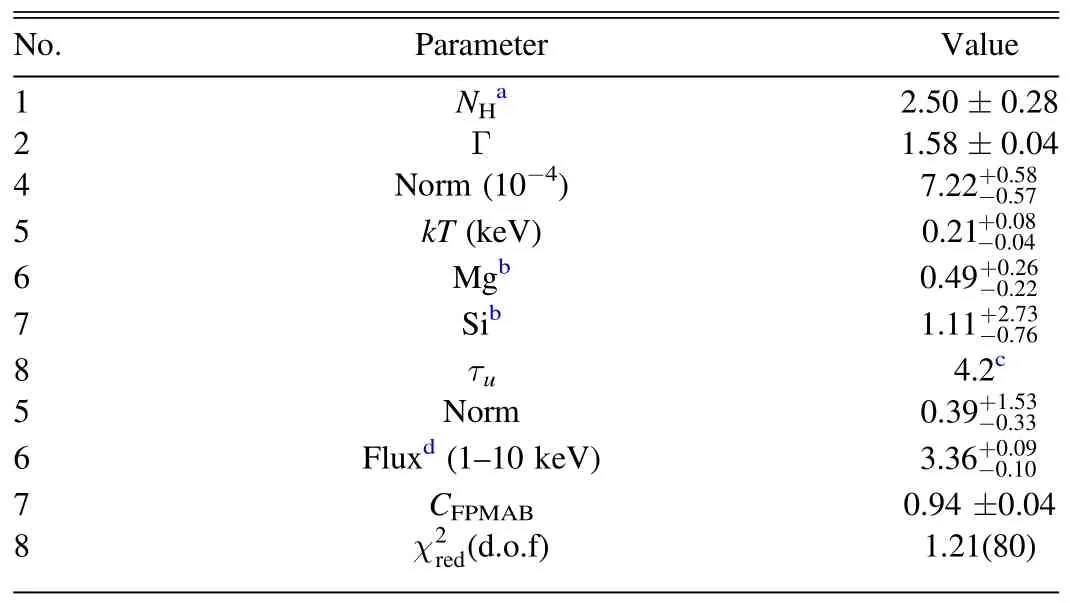
Table 2 The Spectral Fitting Results of Phase Averaged Spectrum by Combining Spectra of Chandra and NuSTAR


3.2.3.Phase-resolved Spectroscopy
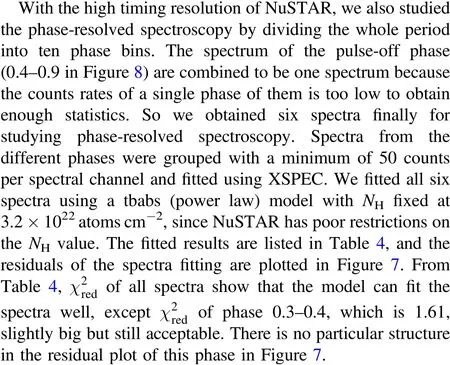
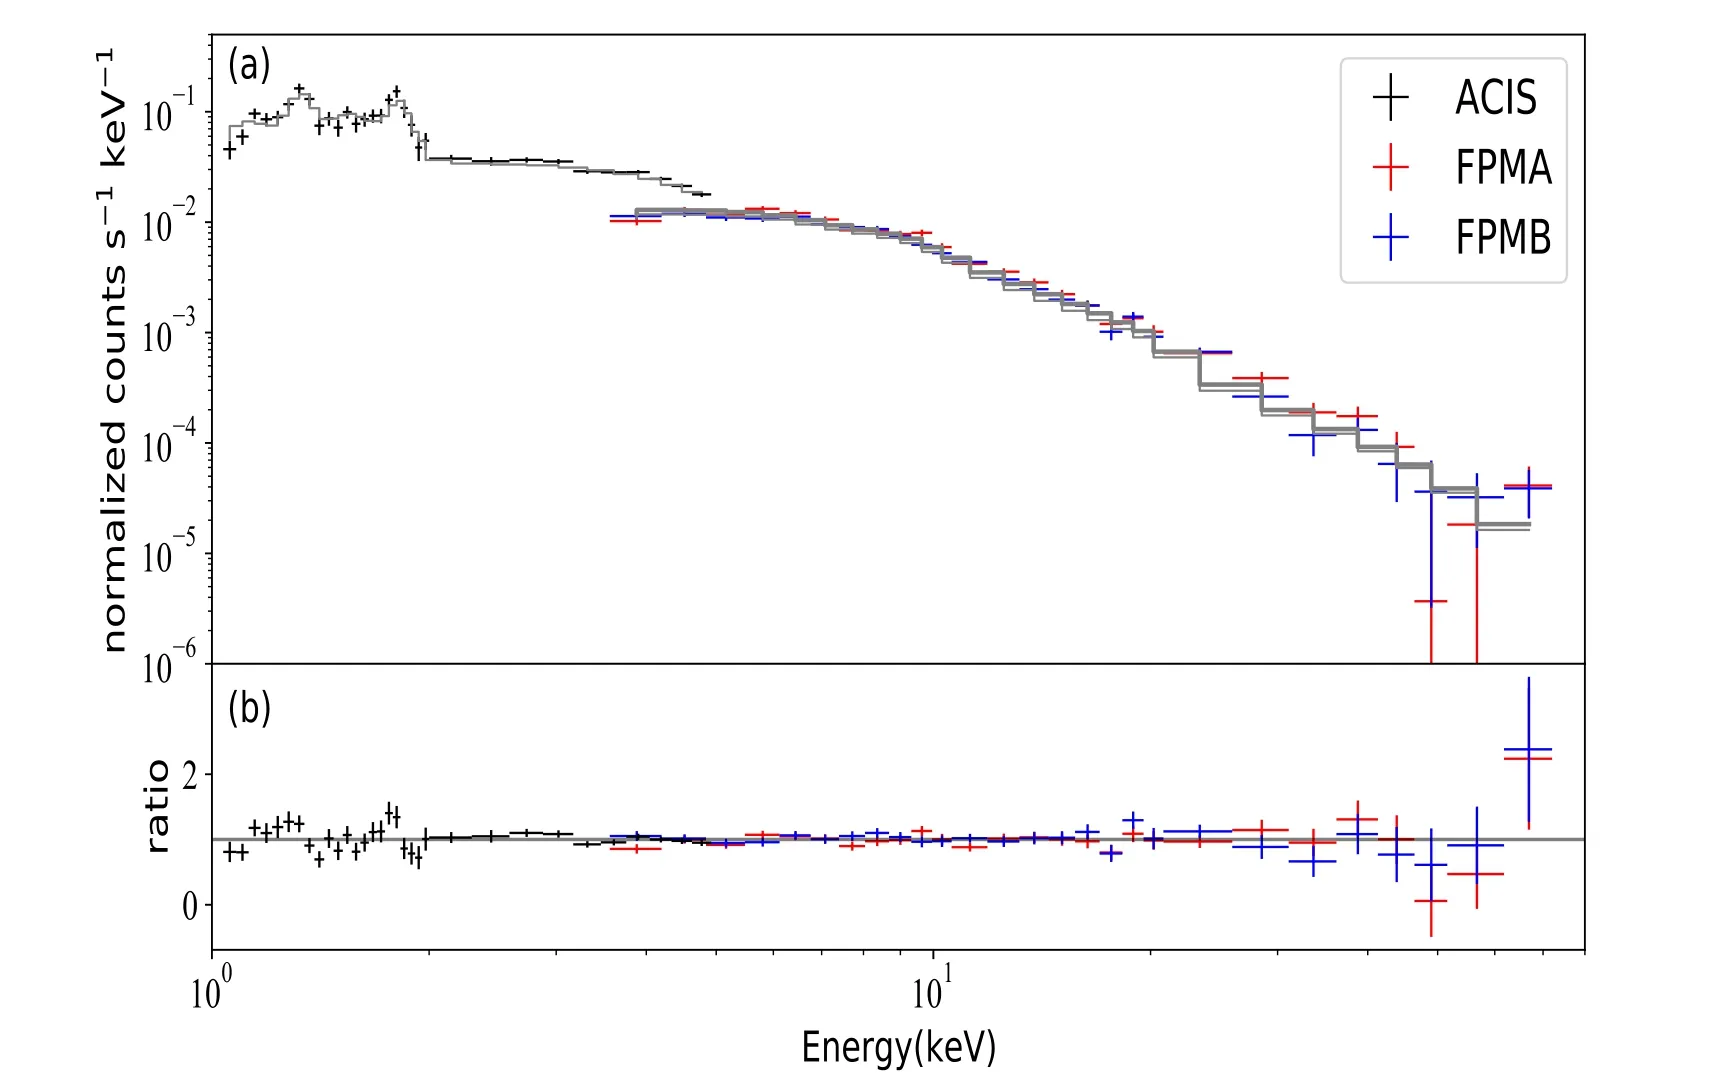
Figure 5.Panel(a):jointed spectrum around PSR J1811–1925 observed by Chandra and NuSTAR spectra in region(a)selected by NuSTAR.The gray-line indicates our spectral model: tbabs (powerlaw+vpshock); Panel (b): ratio between data and spectral model.
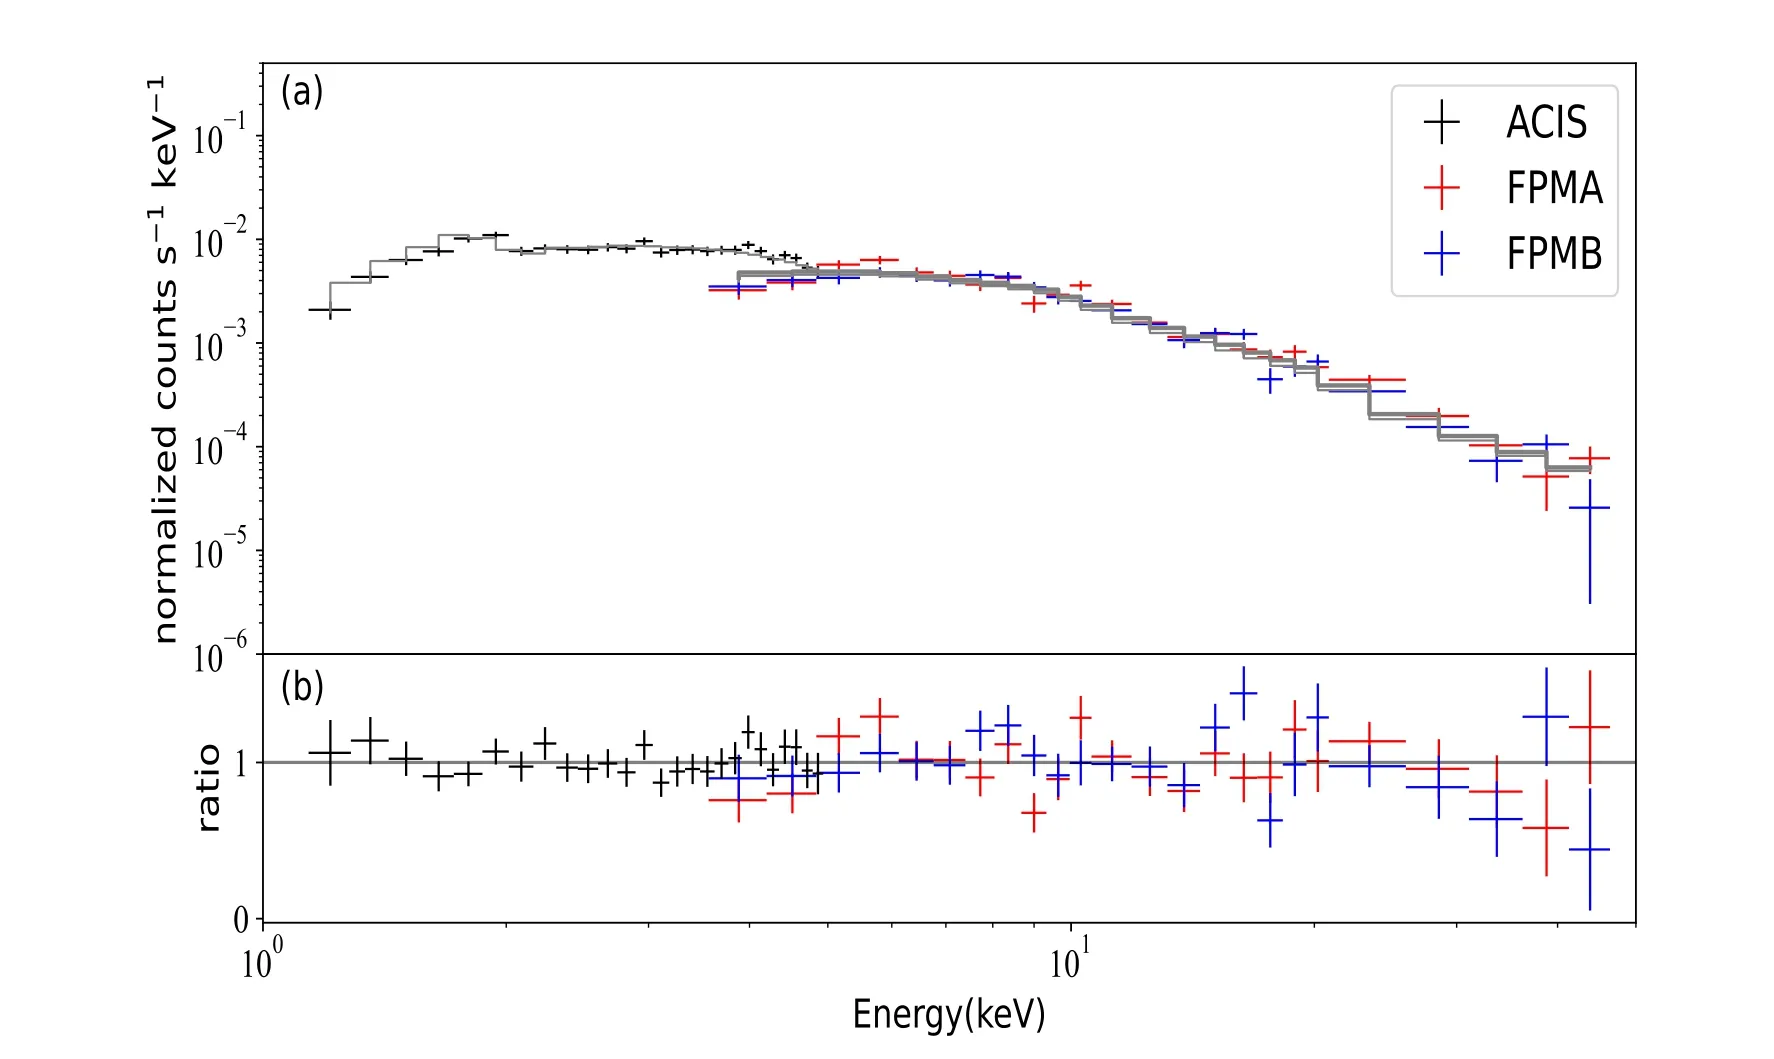
Figure 6.Panel(a):pulsed spectrum of PSR J1811–1925,combined Chandra and NuSTAR spectra.The dashed-line indicates a simple photoelectric absorbed powerlaw model.Panel (b): ratio between data and spectral model.
We plot all photon index of phase-resolved spectra together with pulse profile in Figure 8.The work of Ge et al.(2012)found that photon index of three young pulsars (PSR B0531+21, PSR B1509–58, PSR B0540–69) evolves with phase.From our results of phase-resolved spectra(Table 4 and Figure 8), the photon index Γ of PSR J1811–1925 shows no prominent evolution with phase, it keeps nearly constant at about 1.46±0.08, except the photon index of the off pulsephase, which is 1.81±0.08, softer than photon index of the pulse-on phase.The reason is that the pulse-off spectrum(phase 0.4–0.9) is dominated by the diffuse radiation of the PWN.The photon index of the pulse-off spectrum is also consistent with the PWN result of Roberts et al.(2003),whose PWN’s photon index is 1.54–1.90.

Table 3 Fitting Results of Pulsar Spectrum
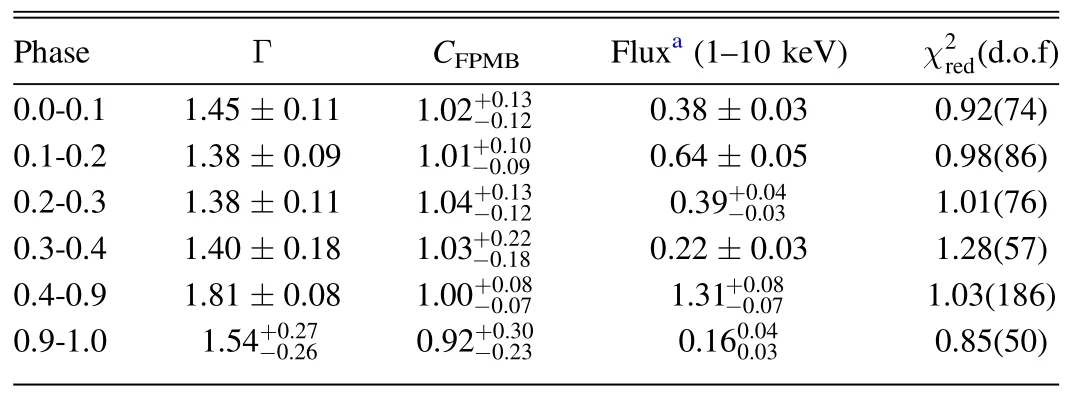
Table 4 Results of Phase-resolved Spectroscopy from NuSTAR Observation
4.Discussion and Summary
The combined analysis of NuSTAR and Chandra data shows that the hard X-ray emission originates from PSR J1811–1925 and its PWN.Its flux(1–10 keV)is 0.91×10⁻¹²erg cm−2s−1.Taking a distance of 5 kpc to the pulsar (Dean et al.2008), its X-ray luminosity(1–10 keV)is 2.75×1033erg s−1.This X-ray luminosity is similar to that of PSR B1509–58 (Gaensler et al.2002).Such pulsars with similar pulse profiles and energy spectra may belong to a new category, soft γ-ray pulsars, as suggested by Kuiper&Hermsen(2015).Compared with γ-ray pulsars, this type of pulsar has different properties: they all have a relatively young characteristic age (within tens of thousands of years); all have spin-down powers Lsdabove 3 ×1033erg s−1(Kuiper & Hermsen 2015).
However, within the soft γ-ray pulsar population, they also have many different properties:
1.Pulse profile: PSR J1811–1925, PSR B1509–58, PSR J1846–0258, PSR J1930+1852, and PSR J1617–5055 have a broad single peak.But Crab pulsar PSR B0531+21 has a double-peaked pulse profile, and Vela pulsar PSR B0833–45 even has a multiple-peaked pulse profile.
2.Pulse phase dependence of the photon index: the spectra of PSR B1509–58 and PSR B0540–69 are harder at the peak of the pulse profile and softer at the wings.Although the spectra of PSR J1811–1925 have no apparent phase dependence considering the measured errors, we cannot rule out the possibility that its photon index evolves with the phase.Crab is different from these pulsars, which is softer at the two peaks (Ge et al.2012).Cheng et al.(2000) proposed the CRZ model for outer magnetosphere of pulsars.In this model,pairs of discharges in the pulsar’s magnetosphere generate gamma-rays, followed by secondary pairs that produce synchrotron radiation at the X-ray band.However,the view angle of PSR J1811-1925 only allows us to detect the synchrotron radiation of the pairs created by the incoming particles.The outer gap model can explain the phase variation of the photon index of PSR B1509-58(Hu et al.2017).As shown in the results of Ge et al.(2012), where the photon index changes very little (within ∼0.1) in different phases.While the spectra of PSR J1811-1925 show no apparent phase dependence,it is important to note that they have low statistics and large uncertainties.Therefore,we hope that NuSTAR can observe PSR J1811–1925 for an extended period of time.
3.GeV radiation:PSR J1811–1925,PSR J1846–0258,PSR J1930+1852, and PSR J1617–5055 have no GeV radiation detected (Wang et al.2014), PSR B1509–58 is not bright in GeV bands.Crab, Vela, PSR B0540–69 and so on have significant GeV radiation.
This class of sources (PSR J1811–1925, PSR B1509–58, PSR J1846–0258, PSR J1930+1852, and PSR J1617–5055) with similar X-ray energy spectra and pulse profiles, their photon index is around 1.2, their pulse profiles exhibit broad,structured single pulse.Therefore, such sources may be a new class of sources.
Hard (≥1 keV) pulsed X-ray emission is believed to come from the magnetosphere of the pulsars powered by pulsar spindown energy.A lot of models can explain this non-thermal pulsed X-/γ-ray emission,and the most popular ones are outer gap model(Zhang&Cheng 1997;Hirotani 2015;Takata et al.2016) and polar gap model (Ruderman & Sutherland 1975).According to the outer gap model, it is suggested that the X-rays and soft γ-rays emitted by pulsars may result from synchrotron radiation generated by electron pairs in the magnetic field.This type of radiation typically produces a wider pulse profile(Wang et al.2013).In contrast,in the polar cap model,the X-rays and soft γ-rays are thought to stem from curvature radiation, and the pulse profile tends to be narrower(Wang et al.2014).By our phase-resolved spectroscopy, we found the pulse radiation in a broad phase,which conflicts with the narrow phases of the curvature radiation.In addition, no GeV curvature photons detected suggest that curvature radiation may be outside our viewing angle (Wang et al.2014).Therefore, our results support that the pulsed radiation comes from synchrotron radiation.
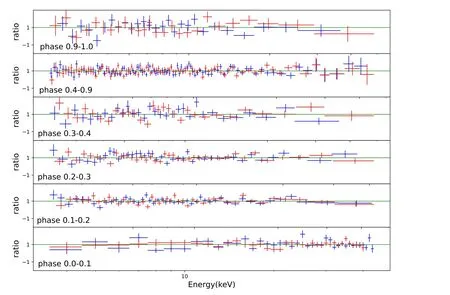
Figure 7.The residuals of the phase-resolved spectra.
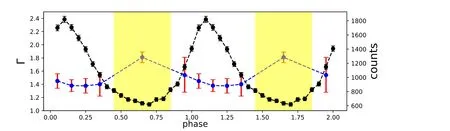
Figure 8.Compare the relation between the photon index obtained in NuSTAR FPMA/FPMB and the pulse profile.The yellow region is the region of pulse off.
In summary, we have analyzed the data from the NuSTAR and Chandra observations of X-ray pulsar PSR J1811–1925.The following are our brief conclusions:
1.From the X-ray pulse profile in different phases and regions, we can detect pulse radiation until 35–79 keV.The pulse profile does not show evolution as a function of energy.
2.Through its phase-resolved spectra, the photon index does not evolve as function of the pulse phase.For PSR B1509-58, no evidence of evolution was found at the beginning (Rots et al.1998), but with more observations and the improvement of the signal-to-noise ratio, the photon index shows clear evolution (Ge et al.2012).Therefore, we expect more observations of this source to obtain more accurate phase resolved spectra.
Acknowledgments
This work is supported by the National Natural Science Foundation of China (NSFC, grant No.U1838203) and International Partnership Program of Chinese Academy of Sciences(grant No.113111KYSB20190020).We acknowledge the use of the public data from the NuSTAR and Chandra data archives.
ORCID iDs
Jin-Tao Zheng https://orcid.org/0000-0003-4847-9113
 Research in Astronomy and Astrophysics2023年11期
- Research in Astronomy and Astrophysics的其它文章
- Photometric and Spectroscopic Study of Two Low Mass Ratio Contact Binary Systems: CRTS J225828.7-121122 and CRTSJ030053.5+230139
- Injection Spectra of Different Species of Cosmic Rays from AMS-02, ACECRIS and Voyager-1
- The AIMS Site Survey
- A High-Temperature Superconducting Wideband Bandpass Filter at the L Band for Radio Astronomy
- Modified Masses and Parallaxes of Close Binary Systems: HD 39438
- Detecting HI Galaxies with Deep Neural Networks in the Presence of Radio Frequency Interference