在线加标-电感耦合等离子体质谱法测量纯钼中痕量杂质元素
2024-01-13 06:19唐一川冯媛媛周涛崔彦杰张见营
岩矿测试 2023年6期
唐一川,冯媛媛,2,周涛,崔彦杰,张见营*
(1. 中国计量科学研究院,北京 100029; 2. 天津理工大学,天津 300384)
钼(Mo)是一种稀有难熔金属,是中国重要的战略资源,其熔点高、机械强度高、导电性好,具有良好的抗氧化、抗腐蚀以及良好的高温机械稳定性[1],被广泛应用航空航天、核工业、集成电路、平面显示以及光伏太阳能等领域[2-4]。纯钼的纯度、结晶取向、晶粒度及致密度都会影响产品的性能,其中对纯度的要求居首位[5-6],因此对杂质的含量需要进行严格的控制[7]。国家标准《钼粉》(GB/T 3461—2016)对纯度为99.95% 与99.90% 的纯钼中Pb、Bi、Sn 等痕量杂质提出明确的限量要求,其中大部分元素的限量在5~50mg/kg 之间。随着半导体产业的突飞猛进以及高精密电子产品的升级换代,对钼的纯度要求越来越高,一般要求纯度达到99.999%或99.9999%,则其杂质总含量需分别控制在10mg/kg 以及1mg/kg 以内。因此,为满足钼产品的质量控制要求,必须建立准确可靠、高灵敏的痕量杂质测量方法。
目前,纯钼中痕量杂质的测量主要包括中子活化法(NAA)、原子吸收光谱法(AAS)、电感耦合等离子体发射光谱法(ICP-OES)、辉光放电质谱法(GDMS)、电感耦合等离子体质谱法(ICP-MS) 等。国家标准《钼化学分析方法》(GB/T 4325—2013)制定了大部分元素的测量方法,满足了对不同元素的测量需求,取得重要的推广及应用。然而,部分方法的检出限较高(通常≥1mg/kg),仅适用于少数元素的测量且步骤繁琐,较难满足纯钼中多元素痕量杂质的高通量测量需求。NAA 法[8-9]灵敏度高、准确性好、污染少,可以测量元素周期表中绝大多数元素。Benedik 等[8]采用RNAA 法(放射化学前处理NAA)实现了电解铜中超痕量U(45pg/g)与Th(80pg/g)元素的测量,表明该方法具有非常低的检出限,对于痕量/超痕量的杂质能够有效检出,但在小型反应堆的辐射危害及设备的地域限制等因素的影响下较难普及。采用单元素测量方法AAS 法[10-12]测量杂质元素时,虽具有较高的准确度,但分析效率较低。除此之外,对于FAAS 法还存在灵敏度低等问题,一般需要进行预富集(如固相萃取[13])以降低检出限。Karlidağ等[13]对果汁中Cd 进行测量时,通过固相萃取灵敏度实现104.3 倍的提升,对于Cd 元素测量的检出限降低至0.14μg/L。ICP-OES 法在测量含量较高(如0.1%)的杂质时具有较高的准确度;但对于痕量杂质的测量,需要克服较低的灵敏度及复杂的光谱干扰等难题。虽然采用离子交换[14]、共沉淀、酸溶挥发[15]、电热蒸发(ETV)[16-17]进样等技术对基体进行分离可以有效地消除部分干扰的影响;但过程繁琐,而且还会造成元素的污染与损失。Aghahoseini等[14]采用离子交换的方法分离基体,实现了Zr 及Zr-Nb 合金中0.5μg/g 及以下含量Cd 元素的测量,但整个过程消耗样品量较大。GDMS 法[18-21]具有固体直接测量、灵敏度高、多元素同时测量的优点;但由于缺乏标准物质,定量困难。王焕文等[19]制备得到成分均匀的高纯钼质控样品用于GDMS 的相对灵敏度因子(RSF)的校正,并用于高纯钼样品的检测,测量结果与ICP-MS 结果一致。上述方法虽然取得广泛应用,但要同时实现高灵敏、高准确性、多元素同时分析往往是难以实现的。
ICP-MS 法[22-23]由于具备灵敏度高、准确性好、可多元素同时测量等优势,是目前纯钼中痕量杂质测量最有效的方法之一。对于高纯材料中痕量杂质的准确测量,ICP-MS 需要克服的是复杂的质谱干扰及基体效应。对于质谱干扰,采用高分辨质谱(HRICP-MS)或碰撞/反应池(CRC)可以有效地消除大部分干扰。符靓等[6]采用电感耦合等离子体串联质谱(ICP-MS/MS)技术对高纯钼粉中28 个杂质元素进行测定,比传统的CRC 消除干扰更加彻底,方法检出限低,且具有较好的准确度及精密度,可以满足纯度为5N 的高纯钼粉中痕量杂质的测定。对于基体效应,一般采用基体分离[24]、标准加入[25]、基体匹配[26]以及内标法[27]进行校正,已取得广泛的应用。Ni 等[26]通过比较不同基体中杂质元素的响应差异,说明基体匹配法对于实现准确测量的必要性,然后实现了铀材料中15 种杂质元素的准确测量,并将测量结果用于铀材料的产地溯源。然而,以上方法往往制备步骤繁琐,分析效率较低,较难满足高通量的样品测量需求。
为满足高通量、自动化的测量需求,基于流动注射(FIA)[28]、串联校正[29]等在线分析方法取得广泛应用。流动注射分析技术经过多年的发展,不仅可以通过分离-富集手段,消除基体干扰,提升痕量/超痕量测量的水平,还可以提高测量的自动化水平,实现高通量测量[28]。基于在线的基体分离[24]及预富集技术[30]与ICP-MS 的联用克服了手动前处理步骤繁琐、分析效率低等问题,而且自动化的过程还能够降低样品使用体积,提升测量的精密度。FIA在海水中超痕量杂质元素分析中已有广泛的应用报道[31-33],简单快速、高效便捷。Wang 等[32]基于在线的离子交换,在28.5min 内可实现海水样品中多种痕量金属元素的测量。采用串联校正[29]的方式可以实现在线的校准过程,即将样品与标准同时或交替引入,以实现在线的定量分析,在确保准确性的同时提升分析效率。通过选择双雾化器进样[29]或者单雾化器双通道进样[34],可以实现在线的校准过程,但通常需要特殊的雾化器或进样系统设计。目前,无需基体分离与富集、无需特殊设计,基于简单管路连接,实现在线加标的ICP-MS 法用于纯钼中痕量杂质的测量还鲜有报道。
标准物质在测量系统校准、测量方法与测量能力验证评价、测量结果的质量控制等方面起着重要的作用。当前,国内外钼基体相关的成分分析标准物主要有合金类及矿石类标准物质,如钼铁合金(GBW01423)、铬钼合金(SRM-1270a)、钛钼合金(SRM-2431)、钼矿石(GBW07141)等,但对于纯钼成分分析标准物质,国内外仍比较缺乏。本文针对纯钼中痕量杂质测量基体抑制效应严重以及分析效率低等问题,通过在线加标的方式将标准与样品溶液经过T 型三通混合后引入高分辨ICP-MS 测量,通过样品-标准进样流量差异的校正,实现了纯钼中29种痕量杂质的快速准确测量,进而将该方法用于纯钼中痕量杂质标准物质的定值工作。本方法在满足标准物质定值准确性要求的前提下,显著提高了分析效率,对于痕量杂质的快速准确检测具有参考意义。
1 实验部分
1.1 仪器和装置
Element 2 型高分辨电感耦合等离子体扇形质谱仪(HR-ICP-SFMS,美国ThermoFisher 公司),射频功率1200W,冷却气 (氩气)流速13.5L/min, 辅助气(氩气)流速1.05L/min,雾化气(氩气)流速1.12L/min,雾化器流速200μL/min,采样锥、截取锥为镍锥,测量方式为跳峰。
ASX-260 型自动进样器(美国Teledyne CETAC公司);Milli-Q 超纯水处理系统(美国Millipore 公司);EH20R 型电热板(中国LabTech 公司);XP204 型分析天平(d=0.1mg,瑞士Mettler Toledo 公司)。
1.2 标准物质和主要试剂
多元素混合溶液标准物质:硝酸基体29 种元素混合溶液标准物质[GBW(E)082429,10±0.3mg/kg]、盐酸基体11 种元素混合溶液标准物质[GBW(E)082430,10±0.3mg/kg]、氢氟酸基体12 种元素混合溶液标准物质[GBW(E)082431,10±0.3mg/kg],均购自中国计量科学研究院。
单元素溶液标准物质:钾单元素溶液标准物质GBW(E)080125(1000±5μg/mL)、水中六价铬成分分析标准物质GBW(E)080257(100±0.8μg/mL)、硅单元素溶液标准物质GBW08690(100±0.5μg/g),均购自中国计量科学研究院。
浓缩同位素稀释剂:53Cr 浓缩同位素稀释剂(53Cr 丰度92.37%,52Cr 丰度6.87%,浓度108.3μg/g);41K 浓缩同位素稀释剂(41K 丰度90.78%,39K 丰度9.22%,浓度74.3μg/g);29Si 浓缩同位素稀释剂(29Si丰度91.53%,28Si 丰度4.01%,浓度8.9μg/g),均购自中国计量科学研究院。
浓酸试剂:二次重蒸硝酸(浓度约为15mol/L)、重蒸盐酸(浓度约为10mol/L)、重蒸氢氟酸(浓度约为20mol/L),均购自中国计量科学研究院。
实验用水为Milli-Q 装置制备的超纯水(电阻率18.2MΩ·cm)。
1.3 样品选择及前处理
1.3.1 样品选择
选择标准物质候选物纯钼粉末(纯度≥99.9%)为样品,由国标(北京)检验认证有限公司提供,杂质元素含量范围为0.1~200μg/g,杂质元素的均匀性已经通过检验。
1.3.2 标准加入法样品前处理
参考国家标准《钼化学分析方法》(GB/T 4325.26—2013)中样品消解步骤。准确称量0.1g(精确至0.0001g) 纯钼(Mo) 粉末样品置于聚四氟乙烯(PFA)闷罐中,依次缓慢加入5mL 超纯水、3mL 50%硝酸、1mL 50%盐酸、1mL 氢氟酸。置于105℃电热板上加热直至样品完全溶解,然后将溶液转移至高密度聚乙烯(HDPE) 塑料瓶中,用纯水定容至100g,此时样品稀释约为1000 倍,Mo 浓度约为1mg/g,待上机测量。上述溶液平行制备4 份,并同时配制全流程空白。
1.3.3 同位素稀释质谱法样品前处理
由于氢氟酸的加入造成Si 的本底过高,因此为了克服该问题,只采用盐酸与硝酸对样品进行消解。具体步骤为:准确称量0.1g(精确至0.0001g) 纯钼(Mo)粉末样品,分别加入适量的浓缩同位素稀释剂(根据最佳稀释比确定,53Cr、41K、29Si 稀释剂分别准确称量0.12g、0.11g、0.32g)置于PFA 闷罐中,依次缓慢加入0.5mL 超纯水、1.5mL 盐酸、0.5mL 硝酸,置于105℃电热板上加热直至样品完全溶解,然后再补加1.5mL 硝酸,最后将溶液转移至高密度聚乙烯(HDPE)塑料瓶中,用高纯水定容至100g,此时样品稀释约为1000 倍,Mo 的浓度约为1mg/g。为了避免交叉干扰,K、Cr、Si 三种元素的测量分别制备上述试样-同位素稀释剂混合溶液,每种混合溶液平行制备4 份,并同时配制全流程空白。
1.4 实验步骤
1.4.1 在线加标ICP-MS 测量
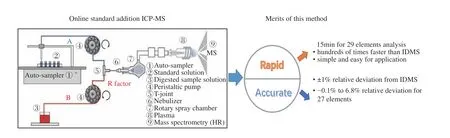
搭建的在线加标ICP-MS 测量方法平台如图1所示。由多元素混合溶液标准物质采用2%硝酸稀释配制不同浓度梯度的标准工作溶液(浓度范围涵盖待测元素含量范围),并采用自动进样器进样,经蠕动泵引入至T 型三通,如图1 中A 管路所示。待测试样溶液(B 管路)经蠕动泵引入至T 型三通另一端,与A 管路的标准溶液汇合并充分混合后经雾化、离子化后引入质谱进行测量。由于B 管路持续的引入试样溶液(Mo 基体浓度约为1mg/g),并与A 管路引入的不同浓度的标准溶液混合,因此可采用标准加入法的计算原理(横坐标为标准溶液浓度,纵坐标为强度,根据标准曲线的斜率k与截距b,可以计算浓度cx=b/k)实现准确的定量。与同位素稀释质谱法采用同位素丰度比的变化计算浓度的原理不同,该方法无需测量同位素丰度比,而是测量加标后信号强度的增量反推计算浓度。
测量的具体操作为:将消解稀释后的试样(1.3.2 节)采用管路B 引入,同时A 管路依次引入不同浓度的标准溶液,根据标准加入法计算试样浓度。然后,将试样替换为流程空白,重复上述操作,计算得到空白浓度。
1.4.2 方法验证
为了验证测量方法的可靠性,将待测试样溶液替换为稀酸基体标准溶液 GBW(E)082429、GBW(E)082430 以及GBW(E)082431 依次进行测量,对测量结果与标准值进行比较。除此之外,采用同位素稀释质谱法对K、Cr、Si 元素进行测量,并与在线加标ICP-MS 测量结果进行比较。
2 结果与讨论
2.1 同位素与分辨率的选择
同位素的选择应遵循丰度高且质谱干扰少的原则。在质谱分析时,干扰主要来自等离子体气体Ar、高浓度基体M(本文为Mo)以及溶剂的O、H 所组成的多原子离子干扰,其中主要的干扰是ArO、ArH、ArM、MO、MH 等[35]。Lum 等[35]综述了ICPMS 消除质谱干扰的方式,包括非仪器方法(数学校正、基体分离等),样品引入新方法(ETV、CVG 等干气溶胶进样),仪器改进方法(冷等离子体、碰撞反应池等)以及高分辨质谱(HR-ICP-MS)等。本工作选择高分辨电感耦合等离子体质谱仪(HR-ICP-MS)进行测量,该仪器有低(LR)、中(MR)、高(HR)三种分辨模式,分辨率分别可达300、4000、10000,一般中分辨模式就可以有效地去除大部分多原子离子干扰。对于K、As 元素,由于分别受到38Ar1H 与40Al35Cl 的干扰,所需分辨率分别为5689 与7781,因此采用HR 模式,其余元素均采用MR 模式。对于待测的31 种元素,综合考虑同位素丰度及质谱干扰情况,所选择的同位素为11B、23Na、24Mg、27Al、28Si、31P、39K、44Ca、47Ti、51V、52Cr、55Mn、56Fe、59Co、60Ni、63Cu、66Zn、69Ga、75As、88Sr、90Zr、93Nb、111Cd、118Sn、121Sb、137Ba、178Hf、181Ta、183W、208Pb、209Bi。
2.2 样品-标准进样流量(信号强度)差异校正
当采用传统的进样方式进行ICP-MS 测量时,由于标准溶液与样品在同一进样管路(或雾化器)引入,因此不存在样品-标准流量差异校正的问题,但采用双路进样时,需要考虑流量差异、雾化效率、传输效率差异等造成的影响。Hamier 等[36]首次引入传输效率的数学校正,取得准确的测量结果。Aguirre等[29]通过双雾化器进样的方式,基于Flow Blurring®技术实现了ICP-OES 的在线校正,有效地补偿了测量过程中的基体效应。该文献比较分析了采用offline 外标法(传统方式,依次引入样品、标准)、online 内标法(一个雾化器用于样品、标准依次引入,另一个雾化器连续引入内标)及on-line 标准加入法(一个雾化器引入标准,一个雾化器引入样品)对测量结果的影响,其中标准加入法由于存在标准-样品双路进样,因此进行了准确的传输效率的校正。结果表明内标法与标准加入法可以有效地补偿基体效应(其中标准加入法效果最好),不同基体中Na、K、Ba、Rb 元素的测量结果与标准值的偏差分别低于10%与3%。
由于试样溶液与标准溶液经不同的管路(分别是B 管路与A 管路)引入,溶液进样流量的差异会导致不同来源的杂质元素在质谱中的信号强度产生差异,因此对该差异进行校正。为了体现流量差异校正的作用,管路A 与B 分别选择内径为0.38mm与0.25mm 的进样管。选择待测杂质元素为20ng/mL 的标准溶液(采用1.2 节中三种多元素混合溶液标准物质经重量法稀释500 倍),分别经A 管路、B 管路、A 与B 管路同时进样。A 与B 管路单独进样时,另一管路置于2%硝酸中,以避免引入空气而引起信号波动。A 与B 管路同时进样时,均进样20ng/mL 的标准溶液。通过更换图1 中②、③的溶液,可方便地进行上述实验。本实验所搭平台与前人在液体阴极-辉光放电原子发射光谱(SCGDOES)[37]以及FAAS[38]在线标准加入法分析中搭建的平台类似,均需要进行流量差异的校正,与新型雾化器设计[29,34]方法相比较,该平台更加简单,易于推广。
不同进样条件下各个待测元素的离子强度如图2 所示,横坐标元素顺序与2.1 节所示元素一致。由图2 可知,A 管路进样离子强度明显高于B 管路进样,离子强度比值R1(A 管路单独进样与B 管路单独进样离子强度比)对于不同元素(除Si、K 外)较为一致,约为1.5。对于Si 的差异较大,主要是由于Si 空白较高引起的,而K 的差异可能是由于信号波动所致,上述两种元素的离子强度比值R1取其他元素的平均值用于后续计算。由于采用同一雾化器,因此雾化效率是一致的,信号强度的差异均来源于不同管路的流量差异,这与采用多雾化器[29]及多通道雾化器[34]进样效率校正是不同的。根据图2 及表1 可知,对于不同元素的离子强度比值R1具有很好的一致性,全部元素的R1平均值为1.54±0.06,这是因为采用同一雾化器进样,更换管路进样,同一元素的雾化效率是一致的,差异仅来源于流量。因此,本方法相对于多雾化器进样,不存在元素的校正因子差异,只需对某一元素进行校正,即可方便求出其他元素的R1因子(本工作Si、K 的校正因子由其他元素取平均计算而得)。管路A 与B 同时进样的离子强度与分别进样强度之和较为一致,比值R2(A、B管路同时进样离子强度与A、B 管路单独进样离子强度之和的比值,记为C/(A+B);其中C 为A、B 管路同时进样的离子强度)约为1。对于Si、Ca 差异较大是由于高空白导致的。在实际样品测量时,首先对校正系数R1进行测量,再对由标准加入外推法计算得到的浓度值进行校正,从而得到准确的测量结果。

表1 在线加标ICP-MS 法检出限、精密度、标准曲线线性方法学参数Table 1 Methodological parameters for ICP-MS method based on online-standard-addition. The method detection limit (MDL) was evaluated based on the 3σ criterion. The precision was represented by the relative standard deviation (RSD) of 6 repeated measurements. The linearly dependent coefficient r was evaluated based on the concentration range of 0-500ng/g.
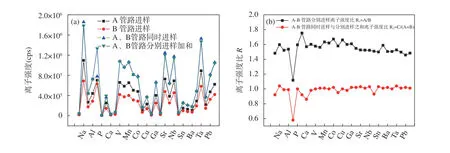
图2 不同管路进样的元素(按质量数排序)离子强度比较:(a)离子强度值;(b)离子强度比值Fig. 2 Comparison of signal intensities of elements or ratios of signal intensities by using different pipelines for sample injections.The elements shown were in order of mass numbers shown in Section 2.1. The intensities of elements for sample injection from A (or B) tube represent the intensities that the standard solution with nominal mass fraction of 20ng/mL was introduced from A(or B) tube,and at the same time the blank solution (2% HNO3) was introduced from B (or A) tube,shown in Fig.2(a). For the simultaneous sample injection means that the 20ng/mL standard solution was introduced from A and B tube at the same time. The intensities of elements for simultaneous sample injection were compared with the sum of the intensities using A tube and B tube sample injection, respectively, shown in Fig.2(a). The ratio of intensity using A tube injection to the intensity using B tube injection was about 1.5 for each element, indicating the difference of injection flow for A and B tube, shown in Fig.2(b).The ratio of intensities for simultaneous sample injection to the sum intensities of A and B injection respectively was about 1,shown in Fig.2(b).
2.3 方法学参数考察
2.3.1 方法检出限
在最优工作条件下,对流程空白连续测量11 次,以3 倍标准偏差对应的浓度计算检出限,并换算为固体样品中待测元素检出限结果(根据1.3.2 节样品稀释1000 倍进样,可以通过稀释倍数F=1000 进行换算),具体见表1 所示。可见不同杂质元素的检出限在0.004~0.90μg/g,优于国标方法GB/T 4325.26—2013 的检出限(1μg/g),与采用传统ICP-MS/MS法[6]测量高纯钼粉中杂质元素的检出限(0.04~50.1ng/g)相当,能够满足杂质含量在1~100μg/g 范围纯钼样品中痕量杂质测量的要求。Schwartz 等[37]研究表明,采用在线加标方法与传统进样方法相比,信噪比(S/N)及精密度是相当的,并未出现明显的衰减,两者的标准曲线斜率偏差在4%以内。实际上,由于采用双路进样,B 管路引入的样品信号会因为A 管路标准溶液的引入而被稀释,但由于系数倍数不大,因此仍然能够满足痕量杂质检测需求。
2.3.2 标准曲线线性
对系列标准溶液依次经A 管路进样,浓度范围为0~500ng/g,具体浓度为0、1、5、20、50、100、200、500ng/g。以待测元素的质量浓度为横坐标,信号强度为纵坐标,标准曲线的线性相关系数列于表1,可见对于绝大多数元素线性相关系数r大于0.999,表明线性良好。对于B 与Si,标准曲线线性较差,主要是高空白的影响。对于111Cd,由于受到95Mo16O 的干扰,所需分辨率大于30000,其他的同位素106Cd、108Cd、110Cd、111Cd、112Cd、113Cd、114Cd、116Cd 也同样受到MoO 以及MoN 的干扰,因此在不分离基体条件下无法进行测量,本工作对于Si、Cd 的测量有待进一步研究。
2.3.3 方法精密度
按照1.4.1 节所述实验流程,在A 管路引入待测元素含量为5ng/mL 的标准溶液,B 管路引入待测样品溶液(1.3.2 节样品消解液),对测量方法的精密度进行考察,连续进样测量6 次的相对标准偏差(RSD)列于表1,RSD 除Nb 较高(6.1%)外,28 种元素的测量RSD 在0.8%~3.9%,表明方法精密度良好,优于前人报道[37-38]的在线分析方法精密度(5%左右)。除此之外,本方法由于在雾化前进行样品-标准混合,相较于采用多雾化器[29]或多通道雾化器[34]进样时样品-标准在雾室中混合,具有更长的混合时间,理论上具有更优的稳定性及精密度。
2.4 方法验证
由于国内外缺乏钼基体相关标准物质,因此选择简单酸基体溶液标准物质 GBW(E)082429、GBW(E)082430 以及GBW(E)082431 对测量方法的可靠性进行验证,计算公式如下所示。
式中:c为样品中待测元素的浓度(μg/g);cx为待测元素的直接测量浓度(ng/g);c0为待测元素的空白背景浓度(ng/g);R1为标准进样管(A 管) 与试样进样管(B 管)相同浓度溶液离子强度比;F为稀释倍数。
各个元素的测量结果以及与标准值的偏差如表2 所示,由表可知除Ca、Zn 由于沾污问题导致的测量准确性较差外(Ca、Zn 相对偏差分别为32%、13%),27 种元素的测量准确性相对偏差在-6.8%~5.1% 之间,其中大部分元素的相对偏差在±2%范围内,表明该方法准确可靠。本方法的测量准确性与前人报道的在线标准加入分析的准确性相当[29,38],优于在线内标校正方法[39]及手动补齐溶液的在线标准加入法[40],主要原因是标准加入法可以实现基体效应的完全校正,而内标法对不同元素的校正程度不同;相对于手动补齐溶液的在线标准加入法,基于双通路进样的标准加入法更加可控、稳定,因此准确性更好。
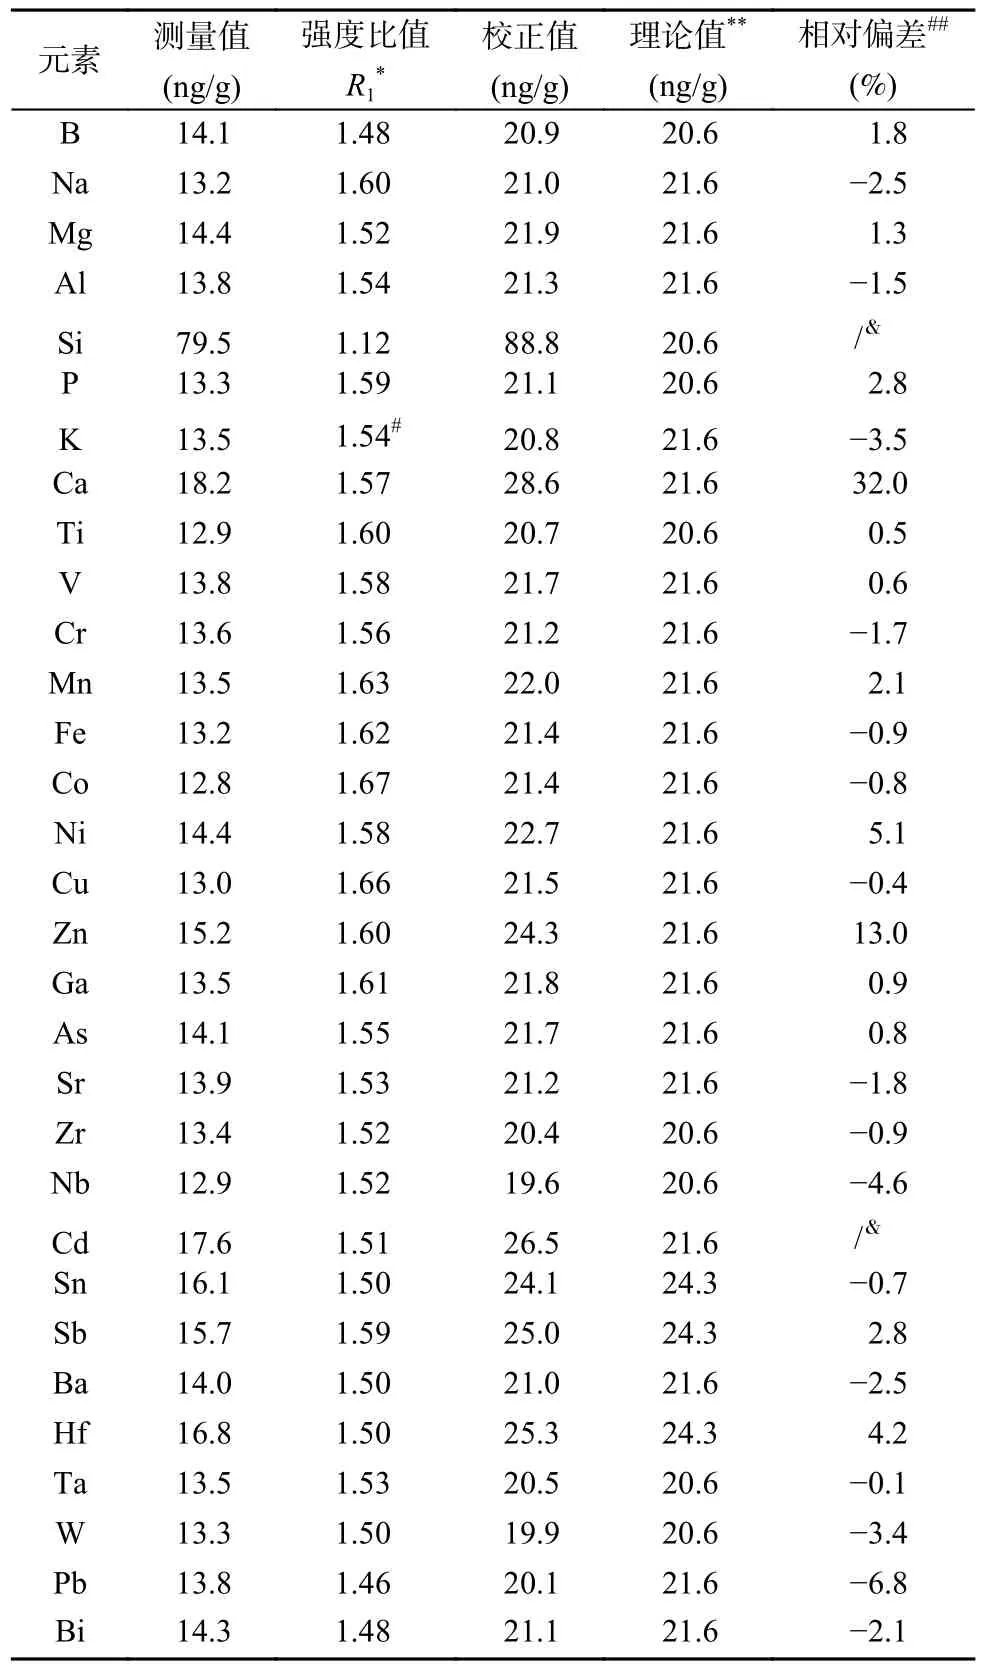
表2 在线加标ICP-MS 法方法验证Table 2 Method validation for ICP-MS method based on online-standard-addition. The calibrated values were calculated based on the measured values multiplied by the intensity ratio R1 . For the certified values (or nominal values), the calculated values were used based on the certified values of standard solutions and the dilution factors. The relative deviations (RDs) between the calibrated values and certified values were used to evaluate the method reliability and accuracy and calculated by using the equation: RD=(calibrate valuescertified values)/certified values×100%.
值得说明的是,在实际测量Mo 基体时,可能存在不同于简单酸基体的质谱干扰。虽然采用HRICP-MS,分辨率高(中分辨率>4000,高分辨率>10000),可以将大部分待测同位素与干扰分开,但仍存在诸如95Mo16O 对111Cd 强烈的质谱干扰以及100Mo18O 对118Sn 的质谱干扰。对于100Mo18O 质谱干扰,由于干扰的丰度很低(0.019%),综合考虑实际样品中Sn 的含量范围,干扰是可以忽略的。对于Cd测量,所有的同位素均受到MoO 的干扰,且干扰丰度大,无法忽略,因此本研究中并未解决Cd 的测量。刘跃等[41]比较了四种碰撞-反应模式-电感耦合等离子体串联质谱法对土壤中Ag 的测量结果,发现在氧气碰撞/反应模式下,92Nb16O+的干扰明显降低(387cps),从而消除了对109Ag 的干扰,并根据化学结合能的数据,解释了NbO++O2→NbO2++O 自发反应的机理,这对于Cd 的测量具有重要的借鉴意义。
2.5 与同位素稀释质谱法测量结果比较
同位素稀释质谱法是公认的最有效、最准确的测量痕量及超痕量元素含量的方法[42],具有最高计量学特性,测量结果可直接溯源到国际单位-摩尔,近年来其应用范围得到不断地拓展。为了进一步验证方法可靠性,考察本工作建立的方法的优势,采用同位素稀释质谱法对纯钼样品中Si、K、Cr 元素进行测量,平行测量4 次。对于Si、K、Cr 元素分别选择29Si/28Si、41K/39K、53Cr/52Cr 同位素比值进行测量。样品中杂质元素的测量结果计算公式如下所示。
式中:cx为待测元素的浓度(未扣除空白,μg/g);cy为浓缩同位素稀释剂中待测元素的浓度(μg/g);mx与my分别为样品-浓缩同位素稀释剂的混合溶液中样品与浓缩同位素稀释剂的质量(g);Mi为各个同位素的核质量(g);R为待测元素的同位素丰度比;Rx、Ry、Rb、Rix、Riy分别表示样品中元素的同位素丰度比、浓缩同位素稀释剂中元素的同位素丰度比、样品与浓缩同位素稀释剂的混合溶液中元素的同位素丰度比、样品中元素的同位素i与参考同位素丰度比、浓缩同位素稀释剂中元素的同位素i与参考同位素丰度比。
式中:c为样品中待测元素的浓度(μg/g);cx为待测元素的浓度(未扣除空白,μg/g);c0为待测元素流程空白(ng/g);mx为消解的样品质量(g);mL为稀释后溶液的质量(g)。
对纯钼粉末样品进行测量,该样品为待测元素分布均匀的标准物质候选物,待测元素含量范围0.1~200μg/g。采用本工作建立的在线加标ICP-MS方法测量结果与同位素稀释质谱法测量结果进行比较,表3 测量结果表明本方法测量结果与IDMS 法测量结果具有良好的一致性偏差在1%以内,进一步验证了方法可靠性。对于Si 元素,IDMS 法由于避免采用氢氟酸消解,因此可以有效地降低Si 空白,从而获得较为准确的结果,采用本方法也可以借鉴,通过尝试避免氢氟酸的使用以及使用高纯试剂实现Si的准确测量。本工作建立的方法的测量精密度(RSD)与同位素稀释质谱法相当(对于K、Cr 元素,本方法RSD 为1.8%~3.2%,IDMS 法的RSD 为0.9%~1.4%),但该方法相对于同位素稀释质谱法可以大大提高分析效率,且可以有效地节约分析成本,具有明显的优势,经评估本方法15min 可完成29 种元素的测量,分析效率比IDMS 法可提高上百倍。
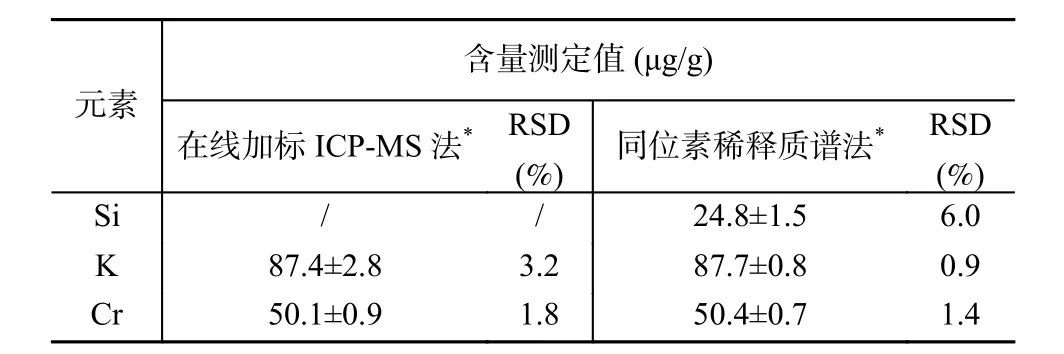
表3 在线加标-ICP-MS 法与同位素稀释质谱法的测量结果比较Table 3 Comparison of the measurement results by using ICPMS method based on online-standard-addition and using isotope dilution mass spectrometry, respectively.The relative standard deviations (RSDs) and standard deviations (SDs) of 4 repeated measurements were listed for each element.
2.6 标准物质候选物样品测量
采用本工作建立的在线加标ICP-MS 方法,对标准物质候选物纯钼粉末中31 种待测的元素进行了测量,测量值及相对标准偏差(RSD)列于表4。可见对于含量大于2μg/g 测量结果的RSD 在0.6%~7.0%,精密度良好,能够满足标准物质定值的需要。对于Si、Cd 元素,由于空白的影响以及MoO 干扰的影响,该方法无法获得准确的结果,测量结果未列出。根据标准研制规范《标准物质的定值及均匀性、稳定性评估》(JJF 1343—2022)的要求,在标准物质定值时,需采用至少两种不同原理的方法。本工作建立的方法作为纯钼粉标准物质候选物定值的方法之一,对29 种元素的测量结果可作为标准物质定值的结果之一,为标准物质准确定值提供支撑。
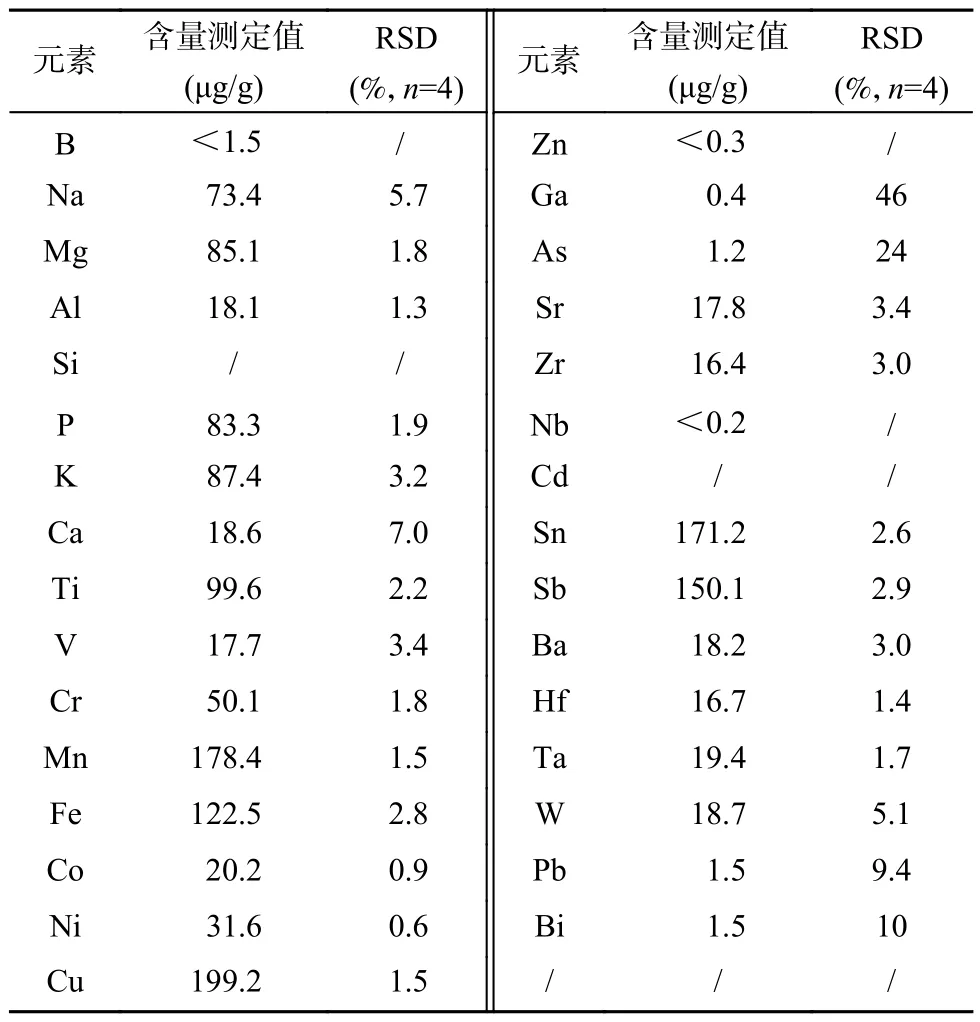
表4 纯钼粉标准物质候选物样品中杂质元素测量结果Table 4 Measurement results of impurity elements in high purity molybdenum powder reference material candidate sample by using ICP-MS method based on online-standard-addition. The relative standard deviations (RSDs) of 4 repeated measurements were listed.
3 结论
通过双路进样,将样品溶液与标准溶液(系列标准溶液依次自动进样)同时引入三通进行混合,然后经过雾化进入ICP-MS 进行检测,从而建立了基于在线加标的ICP-MS 快速准确测量方法,有效地补偿了高浓度基体样品测量造成的基体抑制问题,同时克服了常规基体分离、基体匹配、标准加入、同位素稀释质谱法分析效率低等问题。通过样品-标准进样流量差异的校正,实现了纯钼中29 种痕量杂质的快速准确测量,进而将该方法用于纯钼标准物质候选物中29 种元素的定值工作。样品-标准进样流量差异是影响测量准确性的主要因素,样品测试前需进行准确校正,并在实验过程中保持一致。本方法的准确性及精密度与IDMS 法相当,能够满足标准物质定值需要,且分析效率大大提升,15min 可完成29 种元素的测量,分析效率比IDMS 法提升上百倍,可实现高通量的快速测量。
本方法集合了标准加入法的高准确性以及自动分析的高效性,在满足高精密、高准确性测量的前提下,实现了大批量Mo 样品的准确快速测量。然而,本工作建立的方法不适用于测定本底较高的Si 元素以及存在较高质谱干扰的Cd 元素,今后可通过选择高纯试剂等方式降低本底,以及采用碰撞/反应模式(氧气模式)降低质谱干扰以解决Si、Cd测量的难题。
Rapid Determination of Trace Impurity Elements in Pure Molybdenum by Inductively Coupled Plasma-Mass Spectrometry Based on the Online-Standard-Addition Method
TANG Yichuan1,FENG Yuanyuan1,2,ZHOU Tao1,CUI Yanjie1,ZHANG Jianying1*
(1. National Institute of Metrology, Beijing 100029, China; 2. Tianjin University of Technology, Tianjin 300384, China)
HIGHLIGHTS
(1) A dual-channel simultaneous sampling ICP-MS method based on online-standard-addition was established by calibrating the difference in sample-standard injection flow rate, and the accurate analysis of 29 trace impurities in pure molybdenum was achieved.
(2) Based on the principle of the standard addition method, this method can effectively compensate for the matrix effect of high concentration samples and meet the accuracy requirements of measurement for pure molybdenum reference material candidates.
(3) The established analysis method is comparable with the IDMS method in terms of accuracy and precision, but the analysis efficiency, which is hundreds of times higher than that of the IDMS method, is greatly improved.The measurement of 29 elements can be completed in 15min, and it has the advantage of high throughput.
ABSTRACT BACKGROUND:Molybdenum (Mo) is widely used in aerospace, nuclear industry, integrated circuits, flat display and photovoltaic solar energy and other fields[2-4]. The purity or impurity content of high purity molybdenum has an important effect on material properties, so the accurate measurement of trace impurities is the key to quality control.In the China national standard “Molybdenum Powder” (GB/T 3461—2016), the limits of impurities such as Pb and Bi which are commonly in the range of 5 to 50mg/kg, are specified. Rapid and accurate analysis of trace or ultratrace impurities is necessary with the development of high purity Mo requirements of high throughput analysis.The ICP-MS method has become the most powerful method for trace impurities analysis in high purity Mo, but the tedious and time-consuming matrix effect calibration strategies makes it a big challenge to achieve rapid and accurate analysis.ICP-MS has the advantages of high sensitivity, good accuracy and the possibility of simultaneous measurement of multiple elements, compared with AAS, ICP-OES, and GD-MS methods. However, the matrix effect is heavy in the analysis of high purity Mo, which seriously affects the accuracy of the measurement results. Matrix matching method, standard addition method and isotope dilution mass spectrometry (IDMS) based on isotope abundance ratio measurement can effectively compensate for the complex matrix effect, and accurate analytical results can be obtained, but the analysis processes are complicated, the efficiency is low, and the cost is high, making it difficult to meet the measurement requirements of high throughput.To meet the requirements of rapid analysis, on-line analysis based on flow injection[28]and tandem calibration[29]was used. The online matrix separation and pre-concentration process for flow injection not only eliminates the matrix effect and reduces the detection limits, but also improves the automation level, and achieves high throughput measurement[31-33]. Wang et al.[32]measured a variety of trace metal elements in seawater samples within 28.5min based on online ion exchange. An online calibration process through a new analytical methodology called tandem calibration could be achieved based on a dual sample introduction system with two nebulizers working in parallel[29]or a multiple-channel nebulizer[34], for which the special design of the nebulizer is necessary.OBJECTIVES:To develop a rapid and accurate method for the analysis of trace impurities in high purity molybdenum to meet the requirements of high throughput sample tests.METHODS:A dual-channel simultaneous sampling ICP-MS measurement method based on online-standardaddition was established by calibrating the difference in sample-standard injection flow rate. The in-house online platform was set up based on an auto-sampler and two peristatic pumps. The pure Mo reference material candidates containing homogeneous impurities with mass fraction of 0.1-200μg/g were used as samples. About 0.1g sample was digested based on the China national standard GB/T 4325.26—2013 and diluted about 1000-fold for analysis.The digested sample solution was introduced from a tube (designated as A) continuously by using a peristaltic to a Tjoint in which the sample solution and a series of standard solutions from another tube (B) using an auto-sampler were mixed thoroughly. The mixed solutions were introduced through a nebulizer and rotary spray chamber, ionized in the plasma, and then introduced to mass spectrometry for analysis. For more accurate results, the difference flow rate between the sample and standard tube (the internal diameter of the sampling tube was 0.25mm and 0.38mm for the sample and standard, respectively) was calibrated by using the 20ng/mL standard solution. The ratio (R1) of intensity using A tube injection to the intensity using B tube injection was 1.54±0.06 for each element, indicating the difference of injection flow for A and B tube. The ratio of intensities for simultaneous sample injection to the sum intensities of A and B injection respectively was about 1.RESULTS: Methodological parameters for ICP-MS method based on online-standard-addition were evaluated in terms of method detection limit (MDL), linearly dependent coefficient, precision and accuracy.The limits of detection of this method based on the 3-σ criterion ranged from 0.004μg/g to 0.90μg/g for 29 elements,which meets the requirements of trace impurities analysis. The linear correlation coefficientrof the standard curve was mostly more than 0.999 at the concentration range of 0-500ng/g. The precision was evaluated by introducing the Mo digested solutions from A tube and 5ng/mL standard solution from B tube simultaneously, and the relative standard deviations (RSDs) of 6 repeated measurements were low, ranging from 0.8%-3.9% for 28 elements, in spite of the relative high RSD for Nb (6.1%). The multi-elements standard solution of GBW(E)082429, GBW(E)082430,GBW(E)082431were used for accuracy evaluation. After flow rate calibration, the relative deviation (RDs) between measured values and certified values ranged from -6.8% to 5.1% for 27 elements. For Ca and Zn, the RDs were relatively large (32% for Ca and 13% for Zn), which was probably due to the contamination. To further evaluate the method reliability, the analytical results of K and Cr were compared with those by using the IDMS method. Relative deviation of less than 1% between the two methods was found.Calibration of the difference for flow rate between the sample and standard injection.When the sample and standard is introduced from different tubes or nebulizers, the efficiency should be calibrated. The mathematical correction used was first introduced by Salin et al.[36]A dual sample introduction system based on two nebulizers working in parallel was set up by Canals et al.[29]The transport efficiencies for online standard addition were calibrated and the deviations of less than 3% for Na, K, Ba and Rb elements analysis in different matrixes were obtained. Different from the reported systems which needed to be specially designed[29,34], the online platform in this work was simple and easy to apply, because it only used a T-joint for the mixing of the sample and standard. This similar setup was found elsewhere[37-38]. In this setup, the same nebulizer was used for the sample and standard solution, and thus the same nebulization efficiency was obtained. The difference of signals between using A tube injection and B tube injection only resulted from the flow rates. In the flow process, fractionation could not occur.Therefore, the very consistentR1factors were found for different elements, which indicated that it was not needed for the measurement ofR1factors for all elements.The merits of online-standard-addition ICP-MS method.Satisfactory limits of detection were obtained for 29 elements ranging from 0.004μg/g to 0.90μg/g, which was better than the MDL derived from the China national standard GB/T 4325.26—2013(1μg/g) and was comparable with the reported method based on ICP-MS/MS[6]. In fact, compared with the traditional standard addition method, the online method would attenuate the MDL due to the dilution of sample solution, although Schwartz et al.[37]deemed that there was no obvious difference between online and traditional methods in terms of SNR (Signal to Noise Ratio) and precision. The good precision 0.8%-3.9% for 28 elements was better than literature[37-38]. Apart from Ca and Zn, the satisfactory accuracy for 27 elements (relative deviation ranged from -6.8% to 5.1%) was obtained, which was better than the online internal standard method[39]because of the calibration of matrix effect for the standard-addition method. The comparative results of Cr and K by using the online-standard-addition method (this work) and the IDMS method showed good agreement of ±1%,which further validates the reliability of this work. It can be concluded that the accuracy and precision of this established method were comparable with the IDMS method. However, the analysis efficiency and cost showed obvious advantages, because the measurement of 29 elements could be completed in 15min, and thus the analysis efficiency was hundreds of times higher than that of the IDMS method.CONCLUSIONS:The method combined the properties of high accuracy and high throughput, and thus can achieve rapid and accurate trace impurities analysis in pure Mo.
KEY WORDS:standard addition method;online sample introduction;high purity molybdenum;trace impurity analysis;matrix effect;inductively coupled plasma-mass spectrometry
猜你喜欢
黑龙江大学自然科学学报(2022年4期)2022-11-17
艺术品鉴(2020年6期)2020-12-06
理化检验-化学分册(2020年5期)2020-06-15
领导文萃(2017年6期)2017-03-24
中学生数理化·高一版(2016年7期)2016-12-07
西藏科技(2015年1期)2015-09-26
中学生数理化·中考版(2015年12期)2015-09-10
电源技术(2015年7期)2015-08-22
质谱学报(2015年5期)2015-03-01
同位素(2014年3期)2014-06-13