S型异质结光催化剂ZnFe2O4/WO3的构筑及光催化还原CO2性能
2024-01-20 03:55朱成才李艳阳要红昌
无机化学学报 2024年1期
刘 平 朱成才 李艳阳 要红昌
(郑州大学化学学院,绿色催化中心,郑州 450001)
0 Introduction
The increase in carbon dioxide (CO2) concentration in the Earth′s atmosphere has significantly impacted global temperature, exacerbating the greenhouse effect.Therefore, slowing down the rise of carbon dioxide in the atmosphere and striving for carbon neutrality are two important global priorities in the forthcoming decades[1].Among diverse strategies to mitigate CO2concentration,solar-driven photocatalytic conversion of CO2to value-added chemical products/fuels is regarded as an auspicious method that can provide effective remedial measures for energy crisis and environmental predicaments[2-3].To this end, the development of efficient photocatalysts is a necessary prerequisite for achieving this goal.Over the past decades, various semiconducting photocatalysts, such as CdS[4], ZnO[5],BiOX[6], NiCo2O4[7], and g-C3N4[8-9], have been exploited for CO2reduction since the pioneering work of Inoue et al[10].However, the efficiency of CO2conversion for existing photocatalysts is still far from meeting the requirements for industrial applications so far.Hence,designing and synthesizing novel photocatalysts has been a focus of research in the field of CO2reduction.
As one of the most important spinel-type complex oxides, zinc ferrite (ZnFe2O4) has been widely used for photocatalytic degradation of pollutants, lithium-ion batteries, heterogeneous catalysis, photocatalysis, and biomedical applications owing to its unique physical,chemical, optical and electronic properties[7,11-13].In terms of photocatalytic applications, ZnFe2O4has been studied in the fields of photocatalytic hydrogen production, water splitting, and CO2conversion due to its narrow bandgap ofca.1.9 eV, chemical stability, and unique electronic structure[14-16].For instance,Li et al.[17]demonstrated that ultrafine ZnFe2O4nanoparticles can convert CO2into ethanol and acetaldehyde under visible light illumination.To prevent ZnFe2O4from agglomerating,Yan et al.[18]insitugrew ZnFe2O4nanoparticles on iron porphyrin covalent triazine-based frameworks via an ion-thermal method.With the assistance of Ru(bpy)3, the as-prepared material exhibited higher photocatalytic CO2reduction activity under visible light compared to pure ZnFe2O4.However, the efficiency of photocatalytic CO2reduction of ZnFe2O4is still far below the real demand due to the issues that arise from light harvesting, intensive recombination of electron-hole pairs,and insufficient conduction band potential[19].
Construction of heterojunction structures, especially S -scheme (or Z -scheme) photocatalytic systems[20-21], can effectively overcome above mentioned problems by enhancing the separation of photoinduced charges, broadening the light absorption range, and widening the redox potentials[22-23].Recently, different ZnFe2O4-based heterojunction photocatalysts with an S-/Z-scheme charge transfer model have been synthesized and exhibit impressive CO2photoreduction activity[14,24-25].WO3, another photo-electronically active semiconductor,is a popular material in the field of photo(electro)catalysis due to its unique features,including narrow bandgap, non-toxicity, and chemical stability[26].In particular, WO3exhibits high oxidizing ability on account of its sufficient positive valence band (VB)maximum[27].However, to the best of our knowledge,there are currently no reports on the construction of ZnFe2O4/WO3heterojunctions for photocatalytic CO2reduction[28].
In the present study, we synthesized a series of heterojunction ZnFe2O4/WO3nanocomposites by loading different amounts of ZnFe2O4nanoparticles on the surface of WO3nanoplates.The band structure of the typical ZnFe2O4/WO3composite was characterized and determined by UV-Vis diffuse reflection spectroscopy(UV-Vis DRS), Mott-Schottky plots, and X-ray photoelectron spectroscopy valence band (XPS-VB) spectrum.The photoreduction CO2performance of the as-prepared samples was measured in the presence of water vapor under the irradiation of sunlight simulated by xenon light.The results show that the optimized ZnFe2O4/WO3sample exhibits better photocatalytic CO2conversion activity than pure ZnFe2O4and bare WO3.The enhanced photocatalytic activity is ascribed to the effective separation of photoinduced charges and the widening of the redox potentials.An S-scheme charge transfer mode between ZnFe2O4and WO3heterojunctions is further proposed.
1 Experimental
All chemicals were used as received without any further purification.
1.1 Synthesis of WO3 nanosheets
The WO3nanosheets were synthesized by a hydrothermal method[29].1.979 g Na2WO4·2H2O was dissolved in 90 mL of distilled water, and 90 mL of concentrated hydrochloric acid (36% - 38%) was added dropwise with constant stirring.After continuing to stir for 1 h, the mixture was transferred to a hydrothermal reactor,and heated at 180 ℃for 12 h.After centrifugation, the obtained products were washed three times with distilled water and dried at 100 ℃for 12 h.
1.2 Construction of ZnFe2O4/WO3 heterostructure
Before synthesizing ZnFe2O4/WO3nanocomposites, ZnFe2O4was first synthesized via a facile solventthermal route[30].1 mmol of ZnCl2and 2 mmol of FeCl3were dissolved in 80 mL of ethylene glycol while stirring.Subsequently, 8 mmol of NaOH was added to the solution at room temperature.The resulting mixture was then transferred to a Teflon-lined stainless autoclave and heated to 180 ℃for a duration of 12 h.Afterward, the obtained precipitate was subjected to centrifugation,washing,and drying.
To construct ZnFe2O4/WO3heterostructure, 0.232 g of the synthesized WO3powder was first dispersed in 30 mL deionized water, and then 0.5 g of maleic acid and different amounts of ZnFe2O4were added to the suspension[31].It is worth noting that the introduction of maleic acid is to make the connection between ZnFe2O4and WO3closer in subsequent treatment[32].After the mixture was stirred for 12 h at 60 ℃,the obtained products were collected, washed, and dried.Subsequently,the dried products were calcined at 300 ℃for 3 h.The preparation process of ZnFe2O4/WO3composites is illustrated in Fig.1.

Fig.1 Schematic diagram of the preparation process of ZFO/WO composites
The added amounts of ZnFe2O4relative to 1 mmol of WO3powder were set as 0.05, 0.1, 0.15, 0.2, 0.25,0.3, 0.5, 0.7, 1, and 2 mmol, respectively.For clarity,the correspondingly calcined products were labeled asxZFO/WO, wherex=0.05, 0.1, 0.15, 0.2, 0.25, 0.3, 0.5,0.7,1,and 2,respectively.
1.3 Characterization
Powder X-ray diffraction (PXRD) measurements were performed with a PANalytical X′pert PRO diffractometer using CuKα1radiation (λ=0.154 06 nm) at 40 kV and 15 mA in a 2θrange of 10°-80° at a scanning rate of 5 (°)·min-1.Microscopic morphology was examined via transmission electron microscopy (TEM, FEI Tecnai G2F20) at 200 kV and spot size 2.The light absorption properties of the catalysts were determined by a UV-Vis spectrophotometer (Agilent Cary 5000).The electrochemical workstation (Chen Hua CHI 660E) was used to perform the photoelectrochemical tests.Specific tests included transient photocurrent test(initial voltageE=1.0 V, total test timet=130 s, with or without light interval 10 s); impedance size test (initial voltageE=1.0 V, frequency 105 Hz); Mott-Schottky curve test (initial voltageE=-1 V, final voltageE=1.2 V,selected frequency of 1 000 Hz).
1.4 Photocatalytic activity testing
The photocatalytic CO2reduction activity of the catalysts was evaluated under full spectrum illumination, employing a 300 W Xenon lamp as the light source.Each time an experiment was performed,20 mg of the catalyst was uniformly distributed onto a circular glass substrate, which was subsequently placed within a stainless-steel photocatalytic reactor.Prior to commencing the photocatalytic CO2reduction performance assessment, the reactor was evacuated using a vacuum pump, and a mixture of CO2and water vapor was introduced into the photocatalytic reactor.This purging process was iterated five times to remove air.After illumination for 5 h, gas chromatography (Agilent 7820A)equipped with a methanator, a flame ionization detector, and a thermal conductivity detector was utilized to quantify the yields of photocatalytic products.
2 Results and discussion
2.1 Morphology and structure
Fig.2 shows the PXRD patterns for the representative sample 0.15ZFO/WO along with pure ZnFe2O4and WO3for comparison.The specific diffraction peaks observed at 29.97°, 35.31°, 42.89°, 53.18°, 56.69°,and 62.25° can be attributed to the cubic ZnFe2O4phase[33](PDF No.01-089-4926), whereas the diffraction patterns of WO3closely match the characteristic peaks of the standard monoclinic phase WO3[34](PDF No.01-072-1465).For 0.15ZFO/WO, all the XRD patterns can be well indexed to the cubic ZnFe2O4phase and monoclinic phase of WO3with no appearance of other impurities.

Fig.2 PXRD patterns of WO3,ZnFe2O4,and 0.15ZFO/WO
The morphology and microstructure of the representative sample 0.15ZFO/WO were measured using TEM and HRTEM, and the images are displayed in Fig.3.As discerned in Fig.3a, WO3exhibited a welldefined nanoplate structure,with dimensions of approximately 200 nm in both length and width, presenting a notably smooth surface.In Fig.3b, the fine ZnFe2O4nanoparticles were conspicuously adhered to the surface and periphery of the nanoplates, with the interface delineated clearly in the high-resolution TEM(HRTEM)images(Fig.3c and 3d).

Fig.3 TEM(a,b)and HRTEM(c,d)images of 0.15ZFO/WO
The lattice fringes of ZnFe2O4nanosheets and WO3nanoparticles were observed through HRTEM(Fig.3c and 3d), in which the interplanar spacings of 0.342 and 0.370 nm can be indexed to the (012) and(020) planes of WO3[35], and the interplanar space of 0.254 nm can be indexed to the (311) plane of Zn-Fe2O4[36].On the other hand, the formation of heterojunctions could be observed at the interface between ZnFe2O4and WO3, as marked by the yellow frames in Fig.3b and 3d.
2.2 UV-Vis DRS spectra
The light absorption characteristics of WO3,ZnFe2O4, andxZFO/WO (x=0.05, 0.1, 0.15, 0.2, 0.25)samples were examined in a range of 200-800 nm via UV-Vis DRS, and the results are presented in Fig.4.The absorption onset for pure WO3and ZnFe2O4was observed at approximately 470 and 670 nm,respectively, in agreement with those reported[37-38].For thexZFO/WO samples,the absorption capacity increased proportionally with the increment in ZnFe2O4loading content.Notably, both WO3and ZnFe2O4exhibit characteristics of direct bandgap semiconductors[39-40].The direct bandgap of the samples was estimated from the Kubelka-Munk function[41].The function equation is (αhν)2=A(hν-Eg), whereα,hν,Eg, andArepresent absorption coefficient, photon energy, band gap (eV), and constant, respectively.By extrapolating this figure to(αhν)2=0,it was estimated that the bandgap of WO3and ZnFe2O4wasca.2.60 andca.1.83 eV, respectively(Fig.4b).The results are consistent with those reported previously[39,42].

Fig.4 (a)UV-Vis DRS spectra of WO3,ZnFe2O4,and xZFO/WO;(b)Tauc plots of WO3 and ZnFe2O4
2.3 Photocatalytic CO2 reduction performance
To promote the formation of heterojunctions between ZnFe2O4and WO3,different amounts of maleic acid to central ions were introduced as a capping agent in the preparation process, followed by calcination treatment.The effects of adding a capping agent and heat treatment on the photocatalytic CO2reduction activity were evaluated.Fig.5a shows the effects of adding different amounts of maleic acid as well as not adding maleic acid on the photocatalytic CO2reduction activities after illumination for 5 h.Considering that in CO2reduction products, producing 1 mol of methane requires 8 mol of electrons, while producing 1 mol of CO and H2requires only 2 mol of electrons, we used Eq.1 to quantify the total number of electrons (N,µmol·g-1) involved in the entire reaction to further compare photocatalytic activity.Fig.5a shows the yields of CH4, CO, and H2produced by 0.15ZFO/WO with different maleic acid loadings, 0.15ZFO/WO without maleic acid loading, and the physical mixture of ZnFe2O4and WO3, as well as the total number of electrons required.

Fig.5 Effects of dosage of maleic acid(a)and calcination conditions(b)on the photocatalytic activity of the as-prepared samples
Without the addition of maleic acid, the CO and CH4yields of the obtained samples were 2.3 and 0.6 µmol·g-1, respectively.By contrast, the CO and CH4yields of the samples added with maleic acid increased significantly.For instance, the yields of CO and CH4of 0.5ZFO/WO reached 7.87 and 4.88 µmol·g-1, respectively.The increase in the yields may be attributed to the addition of maleic acid promoting the interphase interaction between ZnFe2O4and WO3[32].It is worth noting that adding more than 0.5 g of maleic acid will not further improve the photocatalytic CO2conversion efficiency, implying that under the conditions of this experiment, 0.5 g of maleic acid is sufficient to facilitate the grafting of ZnFe2O4onto the surface of WO3.However, the effect of maleic acid can only be manifested after calcination, as shown in Fig.5b.Compared with the calcined sample,the CO and CH4yields of the uncalcined specimen and the physical mixed sample were significantly reduced, as shown in Fig.5b.The consequences obtained from the total number of electrons are consistent with above results.
The effects of loading amount of ZnFe2O4on photocatalytic CO2activity were further studied (Fig.6).For pure WO3, almost no CO and CH4products were detected.Upon successful loading of ZnFe2O4nanoparticles onto the surface of WO3nanosheets, the CO and CH4yields for all the samples increased.When the molar ratio of ZnFe2O4to WO3was 0.15, the yields of CO and CH4reached their maximum values, attaining 7.87 and 4.88 µmol·g-1, respectively.Further increasing the loading of ZnFe2O4, the yields of CO and CH4decreased instead.It is worthy of special attention that when the load amount of ZnFe2O4exceeded 0.7, H2began to appear in the CO2reduction product.The reason may be the presence of single-phase ZnFe2O4.Accordingly, compared to the H2O reduction reaction,the formation ofxZFO/WO heterojunctions is beneficial for the CO2reduction reaction.From another perspective, the types and yields of CO2reduction products can be regulated by adjusting the composition of the materials,as shown in Fig.6a and Fig.6b.

Fig.6 After illumination for 5 h,the yields of CH4,CO,and H2 as well as the total number of electrons for WO3(a),ZnFe2O4(b),and xZFO/WO:(a)x=0.05,0.1,0.15,0.2,0.25,0.3;(b)x=0.5,0.7,1,2
To further evaluate photocatalytic activity, we also quantified the total number of electrons for ZnFe2O4andxZFO/WO using Eq.1.For all the composites,0.15ZFO/WO achieved the highest electrons (54.8µmol·g-1), which was approximately 1.5 times that of pure ZnFe2O4(36.2 µmol·g-1).The enhancement of electron transfer number counts may be attributed to the formation of heterojunctions between the grain boundary of ZnFe2O4and WO3,which promotes the separation efficiency of photogenerated electrons and holes as shown below.
To assess the stability, the 0.15ZFO/WO sample was selected, and conducted five consecutive photocatalytic cycles with each cycle lasting 5 h.Fig.7a shows the cyclic test results for 0.15ZFO/WO.The yields of CO and CH4after three cycles remained at 7.23 and 3.17 µmol·g-1, respectively, almost equivalent to the initial values.However, the CO and CH4yields after five cycles were 3.74 and 3.15 µmol·g-1, indicating partial deactivation of the catalyst.Fig.7b compares the XRD patterns of the 0.15ZFO/WO sample before and after five cycles of illumination.No obvious changes were found.Further in-depth research is needed on the underlying reasons for the partial deactivation of catalysts.

Fig.7 (a)Photocatalytic cyclic activity of 0.15ZFO/WO;(b)PXRD patterns of 0.15ZFO/WO before and after five cycles of illumination
Blank and control tests were carried out to elucidate the source of C in CO and CH4, and the test results of the 0.15ZFO/WO sample are shown in Fig.8.When CO2in the reaction system was replaced by N2,only H2was detected in the products,but no other products such as CO and CH4were detectable within the detection limit of our instrument.The results indicate that the products CO and CH4are produced from CO2.In addition, under the conditions of no catalysts or in the dark, CO and CH4yields were extremely low, suggesting that photocatalysts and light are essential conditions for photocatalytic CO2reduction.

Fig.8 Yields of CO,CH4 and H2 under different test conditions
2.4 Photocatalytic mechanism
The band edge potentials of the composites are of critical importance because they have a direct impact on the redox reactions occurring at the catalyst surface[43].Firstly, the flat band potentials of WO3and ZnFe2O4were determined using the Mott-Schottky analysis method.The obtained flat band potentials for WO3and ZnFe2O4were 0.02 and -0.55 V (vs Ag/AgCl),respectively (Fig.9a and 9c).It is known that the flat band potential of n-type semiconductors corresponds to the Fermi level (Ef).Considering the 0.197 V difference between the standard hydrogen electrode (NHE)and the Ag/AgCl electrode[44], theEffor WO3and ZnFe2O4was calculated to be 0.22 and -0.35 V (vs NHE)[38].Secondly, the XPS-VB spectra of WO3and ZnFe2O4were measured, and the results are displayed in Fig.9b and 9d.According to the linear intersection method[45], the differences between theEVBandEffor WO3and ZnFe2O4were 2.53 and 1.60 eV, respectively.Consequently, the calculated VB potentials for WO3and ZnFe2O4were determined to be 2.75 and 1.25 V(vs NHE).According to the equation:ECB=EVB-Eg[46],the CB potentials for WO3and ZnFe2O4can thus be calculated to be 0.15 and 0.58 V(vs NHE),respectively.Accordingly, the band energy of WO3and ZnFe2O4before contact can be schemed(Fig.10a).

Fig.9 Mott-Schottky plots(a,c)and XPS-VB spectra(b,d)of ZnFe2O4 and WO3
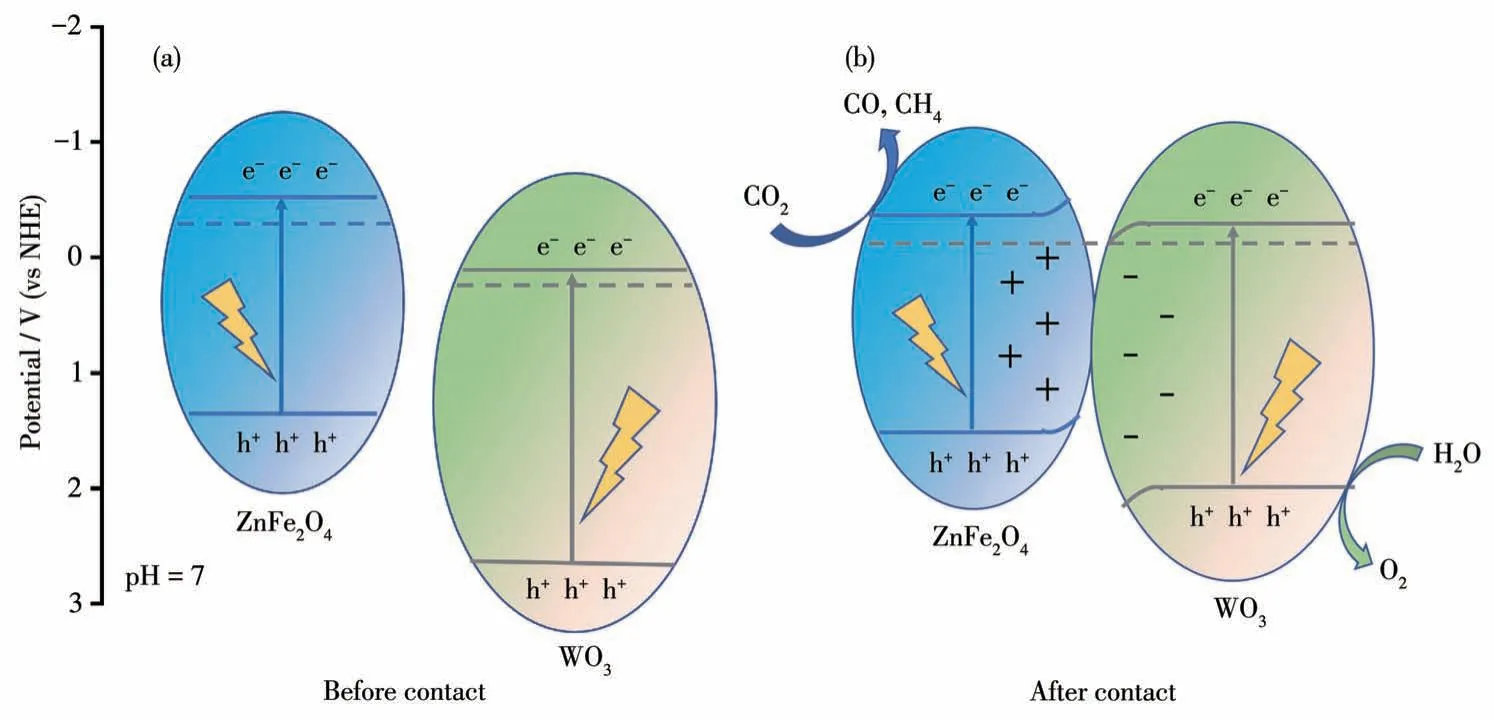
Fig.10 Schematic diagram of band structure of WO3 and ZnFe2O4 before(a)and after(b)contact
The change in elemental binding energies reflects the alteration in electron density and thus can be used to examine the direction of carrier transfer in heterojunction photocatalysts[47].The results of XPS analysis of 0.15ZFO/WO showed that the binding energies of W4f7/2(35.6 eV) and W4f5/2(37.8 eV) shifted to lower binding energies compared to the pure WO3(Fig.11)[28].This implies that the electrons in ZnFe2O4flow to WO3,and the built-in electric field is generated[48].

Fig.11 XPS spectra of W4f of WO3 and 0.15ZFO/WO
When ZnFe2O4is in contact with WO3, the electrons in ZnFe2O4flow towards WO3until the Fermi level flattens out due to the difference between Fermi levels[49].As a result, the electron band of ZnFe2O4bends upward while that of WO3bends downward.Under light irradiation, the VB electrons of WO3and ZnFe2O4are excited up and the separation process of the photoexcited charges can be drawn diagrammatically as Fig.10b.Under the action of the internal electric field, the holes in the VB of ZnFe2O4recombine with the electrons in the conduction band of WO3.The electrons in the conduction band of ZnFe2O4participate in the reduction reaction to reduce CO2to CO and CH4,whereas the holes in the VB of WO3participate in the oxidation reaction to oxidize H2O.Thus, an S-scheme charge transfer mode is formed between the heterojunctions of ZnFe2O4and WO3.The formation of S-scheme heterojunctions is not only beneficial for the spatial separation of photogenerated carriers but also promotes photocatalytic CO2reduction[34,50].To verify the S -scheme mode,the tests of Pt photo-deposition were performed on ZFO/WO.TEM and HRTEM images are shown in Fig.12.The Pt nanoparticles with lattice stripes of 0.226 nm, corresponding to the (111) crystallographic spacing of Pt, were present only on ZnFe2O4.It is reported that Pt nanoparticles are selectively deposited on the material zone with high electron density[51].The results show that the photogenerated electrons in the ZnFe2O4/WO3heterojunction are concentrated on ZnFe2O4, thus confirming the S-scheme charge transfer mode.

Fig.12 TEM(a)and HRTEM(b)images of Pt/ZFO/WO
To assess the efficiency of photogenerated electronhole separation and migration, transient photocurrent,and electrochemical impedance tests were conducted[52].Fig.13a presents the transient photocurrent response of the samples.Compared to single-phase WO3,xZFO/WO exhibited higher photocurrent intensities with the order: 0.15ZFO/WO > 0.2ZFO/WO > 0.25ZFO/WO >0.1ZFO/WO > 0.05ZFO/WO > WO3.The result suggests that the formation of a heterojunction is good for the separation of photogenerated carriers, especially when the ratio of two components is appropriate.The result is consistent with that reported previously[28].

Fig.13 Transient i-t curves(a)and electrochemical impedance spectra(b)of WO3 and xZFO/WO(x=0.05,0.1,0.15,0.2,0.25)
Similarly, the results of the measured electrochemical impedance spectra for the composites also indicate the efficient separation of photogenerated electron-hole pairs[53], as shown in Fig.13b.The improvement in the efficiency of photogenerated charge separation ultimately leads to an increase in the CO2reduction activity of the materials.
3 Conclusions
In summary, a series of ZnFe2O4/WO3heterojunctions were successfully constructed.Under irradiation,the optimal 0.15ZFO/WO sample exhibited the highest CO2reduction activity with the CO and CH4yields of 7.87 and 4.88 µmol·g-1, respectively.The enhanced activity can be attributed to the formation of heterojunction with an S - scheme charge transfer mode.This charge transfer mode facilitates the efficient separation of photogenerated carriers while preserving the hole oxidation capability of WO3.The results obtained herein offer a new avenue to synthesize S-scheme heterojunction ZnFe2O4-based materials for photocatalytic CO2reduction.
Acknowledgments:We would like to thank the financial support of the Natural Science Foundation of Henan Province,China(Grant No.222300420526).
猜你喜欢
Chinese Physics B(2022年9期)2022-09-24
好孩子画报(2019年5期)2019-06-13
郑州大学学报(理学版)(2017年1期)2017-04-20
郑州大学学报(理学版)(2016年4期)2017-01-04
中国卫生(2016年7期)2016-11-13
新闻传播(2016年9期)2016-09-26
中国民政(2016年9期)2016-05-17
中国卫生(2015年10期)2015-11-10
中国水利(2015年4期)2015-02-28
科学中国人(2015年22期)2015-02-28