通过金属离子刺激调节金属有机骨架结构用于光催化CO2还原
2024-01-20 03:55钱建磊葛发源李浩天郑和根张传磊
无机化学学报 2024年1期
路 新 钱建磊 葛发源 李浩天 郑和根*, 张传磊*,
(1安庆师范大学化学化工学院,光电磁功能材料安徽省重点实验室,安庆 246133)
(2南京大学化学化工学院,配位化学国家重点实验室,南京 210023)
0 Introduction
Metal-organic frameworks (MOFs) materials are a new type of inorganic-organic hybrid materials selfassembled from organic ligands and metal ions/cluster centers via coordination bonds and have emerged as one of the most promising alternatives to conventional photocatalysts[1-3].The availability of such ordered crystal networks usually depends on the combination of various functions within them.The design of organic ligands,the choice of metal centers,and the use of synthetic methods play a crucial role in photocatalytic performance.Despite considerable efforts, designing and synthesizing multifunctional MOFs with desirable structures and properties remains challenging[4-6].The development of MOFs that can truly act as multifunctional materials is a demand of current research, thus necessitating the search for more effective synthesis strategies.
Due to the usual propensity of metal complexes,the formation of coordination bonds between metal ions and organic linkers is reversible,which allows the rearrangement of metal ions and organic linkers during the production of highly ordered frameworks[7-8].In recent years, the synthesis of MOFs with structural and functional diversity mainly contained direct solvothermal and post-modification methods[9-11].Ions-exchange reactions have been observed in nanoparticles and other inorganic materials, but are relatively rare in MOFs.It has been shown that MOFs with the feature of stimulusresponse,especially metal ion stimulation,have the following characteristics compared with conventional MOFs: (ⅰ) moderate coordination bond strength, (ⅱ)moderate framework stability,and (ⅲ)obvious visualization appearance[12-14].When such MOFs are immersed in a solution containing other metal ions, due to the exchange between ions and nodes, new structures are ultimately obtained, often accompanied by changes in the appearance of the sample.
Post-synthesis metal ion exchange is an important method to improve the performance of stimuli-responsive MOFs[15-18].In general,metal ion exchange refers to the partial or complete substitution of metal ions on nodes.In addition, under the stimulation of metal ions,the structure of the existing MOFs undergoes a dynamic response that may be disrupted, and the newly added metal ions recombine with the ligand to generate a new structure.In this work,a 2D flexible MOF containing uncoordinated carboxyl groups was obtained by solvothermal self-assembly using 4,4′,4″-(nitrilotris(methylene))tribenzoic acid (H3L) and 4,4′-bipyridine (BPY)as ligands and the transition metal Cd (Ⅱ): {[Cd(HL)(BPY)0.5(H2O)] ·2H2O}n(1).1 can be converted into other MOFs by solvothermal reaction under the stimulation of metal ions: {[Zn3(L)2(BPY)(H2O)]·2H2O}n(2), {[Ni3(L)2(BPY)3(H2O)4]·DMF}n(3), {[Co2(L)(BPY)1.5(NO3)]·H2O}n(4).The performance of the four MOFs as photocatalysts for CO2reduction was further tested.Structure-dependent different catalytic effects contribute to the study of structure-property relationships.
1 Experimental
1.1 Materials and instruments
All reagents are commercially available and can be used without further purification.The single-crystal X-ray diffraction (SCXRD) data sets were measured on a Bruker SMART APEX CCD diffractometer using graphite monochromatic MoKαradiation(λ=0.071 073 nm) at 296 K.Data frames were recorded using the APEX2 program and processed using the SAINT routine in APEX2, with data corrected for absorption based on the multiple scanning technique implemented in SADABS.Structures were solved using the SHELXS direct method and refined using full matrix least squares onF2using the SHELXTL software.All hydrogen atoms are arranged in geometric order.The highly disordered solvent was purified by extrusion in PLATON.Powder X-ray diffraction (PXRD) data were acquired on a Rigaku Ultimate-ⅣX-ray diffractometer operating at 40 kV/30 mA using CuKαradiation (λ=0.154 18 nm).Data were measured at 10(°)·min-1over a range of 5°-50° for more than 5 min.The IR absorption spectra of the compounds were recorded in the range of 400-4 000 cm-1on a Nicolet (Impact 410)spectrometer with KBr pellets (5 mg sample in 500 mg KBr).The thermal stability of synthesized samples was characterized using thermogravimetric analysis (TGA)on a simultaneous thermal analyzer, NETZSCH STA 449 F3, with a heating rate of 10 ℃·min-1in an N2atmosphere and temperatures up to 700 ℃.Fluorescence spectra were recorded on an LS 55 fluorescence spectrophotometer.The UV-Vis spectrum was measured with a Shimadzu UV-2550 UV-visible spectrophotometer.Gas chromatographic analysis was performed on a GC-7860 Plus.
CCDC: 2299888, 1; 2299889, 2; 2299890, 3;2299891,4.
1.2 Synthesis of H3L ligand
4-Bromomethyl benzoic acid (15.96 g, 72 mmol),4-aminomethyl benzoic acid (4.62 g, 30 mmol), and potassium carbonate (13.80 g, 102 mmol) were dissolved in a two-necked flask containing 300 mL of 1,4-dioxane, refluxed at 110 ℃for three days, then cooled to room temperature.1,4-Dioxane was removed by rotary evaporation and potassium carbonate was isolated using methanol.The remaining solid was recrystallized using a mixture of methanol and acetone (1∶1,V/V).The white solid powder (Yield: 10.28 g, 82%) was obtained.MS (EI):m/z=420 (M+).Anal.Calcd.for C24H21NO6(%): C, 68.73; H, 5.05; N, 3.34.Found(%):C,68.81;H,5.16;N,3.39.1H NMR(500 MHz,DMSOd6, room temperature):δ12.84 (s, 3H), 7.94 (d, 6H),7.54 (d, 6H), 3.60 (s, 6H) (Fig.S1, Supporting information).
1.3 Synthesis of complex 1
A mixture of 60.02 mg (0.15 mmol) of Cd(NO3)2·9H2O, 20.96 mg (0.05 mmol) of H3L, and 15.61 mg(0.10 mmol)of BPY was dissolved in 8 mL of dimethylacetamide (DMA)+H2O (1∶7,V/V) mixed solution.The final mixture was transferred to a Teflon-lined stainless steel reaction vessel and heated at 95 ℃for three days,then cooled to room temperature.After washing and drying, white plate-like crystals were obtained (Fig.1).The yield was ca.64%.Anal.Calcd.for C29H25CdN2O7(%): C, 55.60; H, 3.99; N, 4.47.Found(%): C, 55.34;H,3.83;N,4.23.
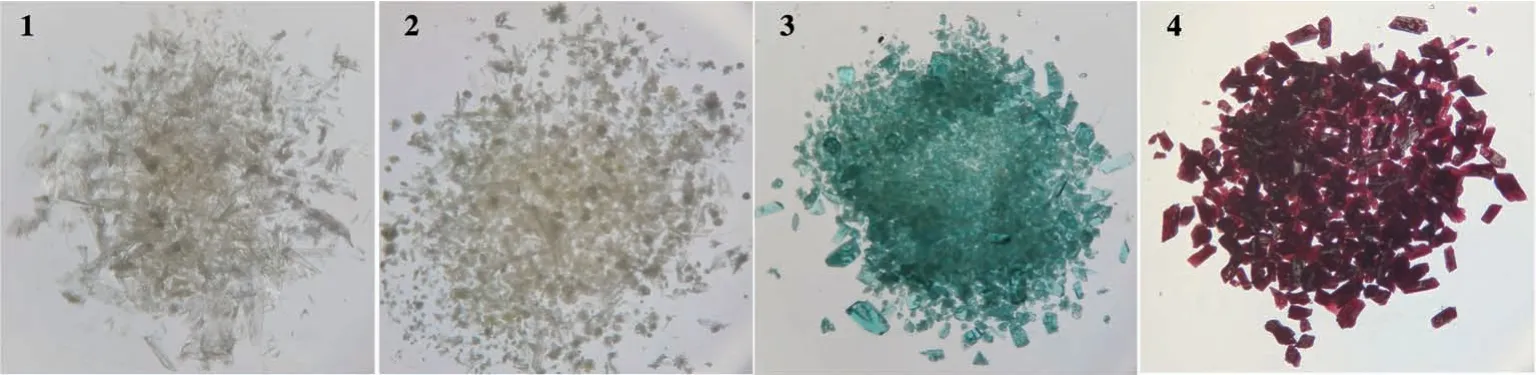
Fig.1 Actual pictures of the crystals of complexes 1-4
1.4 Synthesis of complex 2
An appropriate amount of crystals of 1 and 44.62 mg (0.15 mmol) of Zn(NO3)2·6H2O were added to an 8 mL mixed solution (VCH3CN∶VH2O=1∶7).The mixture was sonicated for 3 min and transferred into a Teflon-lined stainless steel reaction vessel.The vessel was kept at 100 ℃for 3 d, then cooled to room temperature.White cluster-like crystals were obtained (Fig.1).The yield was about 55%.Anal.Calcd.for C116H92N8O26Zn6(%):C, 57.85; H, 3.82; N, 4.65.Found(%): C, 57.43; H,3.56;N,4.43.
1.5 Synthesis of complex 3
An appropriate amount of crystals of 1 and 43.62 mg(0.15 mmol)of Ni(NO3)2·6H2O were added to an 8 mL mixed solution (VDMF∶VH2O=1∶7).The subsequent steps were similar to the preparation of 2, and green crystals were obtained (Fig.1).The yield was approximately 52%.Anal.Calcd.for C78H68N8O16Ni3(%): C, 60.46; H,4.39;N,7.23.Found(%):C,59.87;H,4.11;N,7.13.
1.6 Synthesis of complex 4
An appropriate amount of crystals of 1 and 43.65 mg (0.15 mmol) of Co(NO3)2·6H2O were added to a 6 mL mixed solution (VDMA∶Vethanol=1∶1).The subsequent steps were similar to the preparation of 2.The solvothermal reaction at 95 ℃for 3 d gave purple massive crystals (Fig.1).The yield was approximately 57%.Anal.Calcd.for C39H30N5O9Co2(%): C, 56.35; H, 3.61;N,8.43.Found(%):C,56.01;H,3.23;N,8.22.
1.7 Photocatalytic CO2 reduction reaction test
The photocatalytic CO2reduction test was carried out without adding any photosensitizer and co-catalyst.Complexes 1-4 were heated under vacuum at 160 ℃for 18 h, respectively, and cooled to room temperature to complete the activation.5 mg of the activated complex was added into the photoreactor, then 20 mL of cyclohexanone and 5 mL of triethylamine sacrificial agent were added.The mixture was sealed and evacuated until the mixture was free of gas bubbles and then bulged for 10 min with CO2.The photoreactor was placed under a xenon lamp, stirred, and condensed.The photocatalytic process was monitored using a gas chromatograph.
2 Results and discussion
2.1 Characterization and crystal structure
Crystal data and structural refinement parameters of complexes 1-4 are listed in Table 1, and the bond lengths and angles are listed in Table S1-S8.The SCXRD study reveals that the structure of complex 1 belongs to the triclinic crystal system, with thePspace group.Its asymmetric unit contains a Cd2+ion,half of a BPY ligand, a partially deprotonated HL2-ligand, and a coordinated water molecule.Each Cd(Ⅱ)center coordinates to a nitrogen atom from a BPY ligand, five carboxylate oxygen atoms from three H3L ligands, and an oxygen atom from a coordinating water molecule, forming an irregular pentagonal bipyramidal geometry (Fig.2a).The Cd—O distances range from 0.230 4(2)to 0.250 8(3)nm,and the Cd—N distance is 0.232 5(3) nm.The O—Cd—O angles range from 53.62(8)° to 148.27(9)°, and the N—Cd—O angles range from 87.74(10)° to 167.69(10)°.One partially deprotonated HL2-ligand connects three Cd2+ions,with one carboxylate group chelating in a bidentate (η2)mode to a Cd2+ion, and another carboxylate group bridging in a bidentate and monodentate (μ2-η2∶η1)mode to two Cd2+ions.Cd2+forms a [Cd2O2] SBU (secondary building unit)through two —O— linkages,with a Cd…Cd distance of 0.391 52(5) nm.Each [Cd2O2] is connected to four partially deprotonated HL2-ligands,forming a 1D chain (Fig.2b).In contrast, BPY ligand connects to the 1D chains in a nearly perpendicular direction to the [Cd2O2] SBU, resulting in a 2D network(Fig.2c).From topological analysis, the structure can be simplified to a (2, 6) two-nodes topology with the point symbol:{22·48·65}{2}2(Fig.2d).

Table 1 Crystal data and structural refinement parameters of complexes 1-4

Fig.2 (a)Coordination environment of complex 1(ellipsoid probability of 30%);(b)1D chain formed by[Cd2O2]SBUs and HL2-ligand;(c)2D network formed by 1D chain and BPY ligand;(d)2D topological network
SCXRD showed that complex 1 was converted to complex 2 by stimulation with Zn2+metal ions, changing to a monoclinic crystal system with aP21/cspace group.The asymmetric unit of complex 2 contains three Zn2+ions, a BPY ligand, two deprotonated L3-ligands, and a coordinating water molecule.The structure possesses three different Zn (Ⅱ)coordination environments: two tetrahedral Zn1 and Zn2 and a pentahedral bipyramidal Zn3.The Zn1 coordinates point to one nitrogen atom of the BPY ligand and three oxygen atoms of the three fully deprotonated L3-ligands, the Zn2 coordinates point to four oxygen atoms of the four fully deprotonated L3-ligands, and the Zn3 coordinates point to a single nitrogen atom of the BPY ligand, four oxygen atoms of two L3-ligands and a coordinating water molecule.Zn1 and Zn2 are connected through three —OCO— linkages, forming a [Zn2(CO2)3] SBU,with a Zn1…Zn2 distance of 0.324 66(12) nm (Fig.3a).In complex 2, two different L3-ligands connect to the Zn2+ions.O1-O6 originate from one L3-ligand, while O7-O12 originate from another L3-ligand.O1 and O2(O7 and O8,O9 and O10) bridge (μ2-η1∶η1) to Zn1 and Zn2, O3 bridges in a monodentate (η1) mode to Zn3,O5 and O6 chelate in a bidentate(η2)mode to Zn3,and O11 bridges in a monodentate (η1) mode to Zn2(Fig.3a).The L3-ligand connects with Zn2+ions in different orientations to form a 3D network structure(Fig.3b).From thea-axis direction, it can be observed that different-sized channels are generated in the structure.When BPY ligand coordinates to Zn1 and Zn3,the channels are blocked, resulting in a decrease in porosity(Fig.3c).In this case,the framework forms uniformly sized, well-ordered cavities (Fig.3d).Simplifying the complex SBUs in Fig.3e,the spatial structure of the whole complex can be reduced to a (3,3,3,5) fournode topology with the point symbol: {4·82}{4·83·106}{83}2.
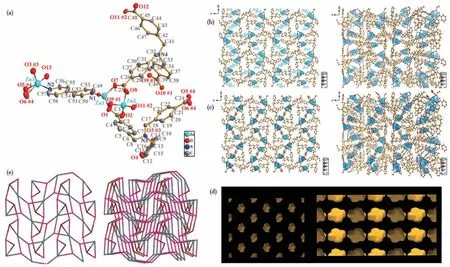
Fig.3 Coordination environment diagram of complex 2(ellipsoid probability of 30%);(b)3D structure formed by L3-coordination anion and Zn2+ion;(c)3D structure formed by L3-coordination anion,BPY ligand,and Zn2+ion;(d)Cavities generated in 2;(e)3D topological network of 2
The metal ion exchange of complex 1 under Ni2+stimulation occurs at the metal nodes,and the structure of complex 3 remains a triclinic crystal system with thePspace group.The asymmetric unit contains three Ni2+ions, one of which is composed of two half Ni2+ions, three BPY ligands, one of which is composed of two half BPY ligands, two deprotonated L3-ligands,and four coordinated water molecules.There are four different coordination environments for the Ni (Ⅱ)ions in the structure, and all four Ni (Ⅱ) ions are sixcoordinated.The two coordinating nitrogen atoms of Ni1 come from two BPY ligands, three of the four oxygen atoms come from two fully deprotonated L3-anions,and one oxygen atom comes from a coordinated water molecule.The two nitrogen atoms of Ni2 come from two BPY ligands, and the four oxygen atoms come from two L3-anions and two coordinated water molecules.The two water molecules coordinated to Ni2 are connected in acismanner, with an O—Ni—O angle of 180°.The coordination atom types of Ni3 are the same as Ni2,but the two coordinated water molecules are connected to Ni3 in atransmanner, with an O—Ni—O angle of 90.541(256)°.The two coordinating nitrogen atoms of Ni4 come from two BPY ligands, and the four oxygen atoms come from two L3-anions.The two BPY ligands and two L3-anions are connected to Ni4 in acismanner(Fig.4a).The L3-anions have multiple different binding modes with Ni2+.Specifically, O1, O2, and O3 are connected to Ni1 through bidentate chelation (η2) and monodentate bridging (η1), and the two carboxyl groups connected to Ni2 are symmetrically structured.O5 is connected to Ni2 through monodentate bridging (η1).O7 (O9) is connected to Ni3 through monodentate bridging (η1), and the two carboxyl groups connected to Ni4 are also symmetrically structured.O11 and O12 are connected to Ni4 through bidentate chelation (η2)(Fig.4a).From the perspective of thea-axis direction,the L3-anions and Ni2+ions form two types of channels:an hourglass-shaped channel and an elliptical-shaped channel (Fig.4b).When the BPY ligands coordinate with the Ni2+ions, the hourglass-shaped channel is divided into a diamond-shaped cavity,and the ellipticalshaped channel is split in the middle, resulting in a decrease in porosity (Fig.4c).In this case, the crystal forms various sizes and shapes of nanocavities (Fig.4d).From topological analysis, after removing seven water molecules, the network structure of this structure can be simplified to a “3D+2D→3D” three-node topology with the point symbol:{4·62}2{42·63·8}2{42·84}(Fig.4e).

Fig.4 (a)Coordination environment diagram of complex 3(ellipsoid probability of 30%);(b)3D structure formed by L3-coordination anion and Ni2+ion(hourglass and oval pore);(c)3D structure formed by L3-coordination anion,BPY ligand and Ni2+ion;(d)Nano cavities in 3;(e)3D topological network of 3
SCXRD shows that complex 4 belongs to the monoclinic crystal system, with theP21/cspace group.Its asymmetric unit contains two Co2+ions, one-half BPY ligand,one deprotonated L3-ligand,and one coordinated nitrate ion.There are two different coordination environments for the Co (Ⅱ)ions in the structure,and both are six-coordinated.The two coordinating nitrogen atoms of Co1 come from two BPY ligands, and the four oxygen atoms come from three fully deprotonated L3-anions.One coordinating nitrogen atom of Co2 comes from the BPY ligand, three oxygen atoms come from three fully deprotonated L3-anions, and the remaining two oxygen atoms come from the nitrate ion.Co1 and Co2 are connected by two carboxyl groups and one oxygen atom of the carboxyl group, forming a[Co2(CO2)2O].The distance between Co1 and Co2 is 0.334 26(9) nm (Fig.5a).In this structure, O1 and O2(O6 and O5) are connected to Co1 and Co2 through bridging (μ2-η1∶η1), and O3 and O4 are connected to Co1 and Co2 through bidentate chelation and monodentate bridging (μ2-η2∶η1).In addition, two oxygen atoms in the nitrate ion are connected to Co2 through bidentate chelation (η2) (Fig.5a).Through the connection of L3-anions with Co2+ions from different directions,a 3D network structure is formed (Fig.5b).From thea-axis direction, it can be seen that two types of channels are formed between Co1 and Co3 through L3-anions: a parallelogram-shaped channel and a square-shaped channel (Fig.5b).When the BPY ligands coordinate with Co1 and Co2, both the parallelogram-shaped and square-shaped channels are divided into two, resulting in a decrease in porosity in the framework (Fig.5c).In this case, a 2D channel is formed in the crystal(Fig.5d).From topological analysis, the network structure can be simplified to a (3,5)two-node topology with the point symbol:{4·52}{4·53·76}(Fig.5e).

Fig.5 (a)Coordination environment diagram of complex 4(ellipsoid probability of 30%);(b)3D structure formed by L3-coordination anion and Co2+ion(parallelogram pore and square pore);(c)3D structure formed by L3-coordination anion,BPY ligand and Co2+ion;(d)2D pores in 4;(e)3D topological network of 4
Based on the experimental results, a possible mechanism for the transformation of MOF under metal ion stimulation was speculated.This Cd-MOF was considered suitable as a parent material for central metal exchange because complex 1 is a stimulus-responsive MOF with moderate ligand bond strengths, moderate framework flexibility, and a distinctly visual appearance,making it structurally compatible with such transformations and easily responsive to external stimuli.When 1 is immersed in a solution containing other metal ions, a new structure is eventually acquired due to the exchange between ions and nodes, usually accompanied by a change in the appearance of the sample(Fig.1).The driving force for this single-crystal-tosingle-crystal conversion stems primarily from the stimulation of metal ions.One speculation is that Cd2+dissociates from the framework, creating vacancies that are subsequently occupied by external Zn2+/Ni2+/Co2+ions.The external metal ion ions first fill the channel and then coordinate with free L3-.Subsequently,the L3-ligand gradually moves towards the MOF skeleton and eventually attaches to the channel wall, and in this way the metal exchange proceeds spontaneously and in an orderly manner.Another speculation is that 1 is completely solubilized by metal ion stimulation and the dissociated ligands with different metals Zn2+/Ni2+/Co2+are obtained by secondary assembly of 2, 3, 4.Singlecrystal-to-single-crystal conversion experiments yielded 2, 3, and 4 all in about 50% yield, with another 50% or so of the material lost as a soluble solution,which may provide evidence for the possibility of dissociation-secondary assembly.
2.2 Characterization of the complexes
The PXRD patterns of complexes 1-4 are shown in Fig.6a,from which it can be seen that the experimental results were in good agreement with the simulated diffraction peaks.This indicates that the prepared samples have a high degree of phase purity.Infrared spectra (Fig.6b) were measured for complexes 1-4 and ligands H3L and BPY in a range of 400-4 000 cm-1.The thermal stability of complexes 1-4 was studied by TGA (Fig.6c).Complex 1 showed a weight loss of 8.76% by 340 ℃, which is attributed to the loss of ligand water molecules and free water molecules (Calcd.8.63%).Subsequently, the rapid weight loss indicates framework collapse.The TGA curve of complex 2 showed a weight loss of 4.66% by 150 ℃, which is mainly attributed to the loss of ligand water molecules and free water molecules (Calcd.4.48%).Again, the rapid weight loss indicates that the complex framework has collapsed.Complex 3 had two weight losses before 160 ℃, totaling about 9.53% weight loss.The main losses are free DMF molecules and coordinated H2O molecules (Calcd.9.36%).The framework collapsed rapidly at temperatures above 340℃.Complex 4 was stable up to 120 ℃, with a weight loss of about 10.0% by 170 ℃, mainly of ligand nitrate ions and free H2O molecules(Calcd.9.63%),after which the structure stabilized.At 325 ℃, the framework collapsed as the weight dropped dramatically.As shown in Fig.6d, under the excitation of 325 nm wavelength, the fluorescence emission wavelengths of complexes 1-4 were 395, 394, 395, and 393 nm, respectively.The fluorescence emission wavelengths of these four complexes were almost indistinguishable, probably because their fluorescence emission is all affected by the ligands H3L and BPY (Fig.S2).However, compared to other complexes, complex 1 underwent a fluorescence burst,which facilitates the inhibition of electron-hole complexation during photocatalysis and promotes the transport of photoelectrons.

Fig.6 (a)PXRD patterns of complexes 1-4;(b)IR spectra of 1-4 and ligands BPY and H3L;(c)TGA curves of 1-4;(d)Fluorescence emission spectra of 1-4
2.3 Performance testing and mechanism analysis of photocatalytic CO2 reduction
To investigate the effect of different MOF structures and metal centers on photocatalytic activity, photocatalytic CO2reduction experiments were carried out for complexes 1-4.As shown in Fig.7a, the catalytic properties of the complexes with different metal centers are not the same.Complexes 1-4 all produced CO, and complex 3 had the highest selectivity for CO, with a maximum yield of 52.4 µmol·g-1·h-1and no production of CH4.Except for complex 3, the other three crystals produced CH4to varying degrees.Among them,the maximum production rate of CO for complex 1 was 63.3 µmol·g-1·h-1, and the maximum production rate of CH4was 14.2 µmol·g-1·h-1; the maximum production rate of CO for complex 2 was 29.4 µmol·g-1·h-1,and the maximum production rate of CH4was 25.5µmol·g-1·h-1; the maximum production rate of CO for complex 4 was 50.6 µmol·g-1·h-1, and the maximum production rate of CH4was 12.5 µmol·g-1·h-1.Hydrogen gas was not detected in the products, indicating that there was no hydrogen evolution reaction during catalysis.As shown in Fig.7b and 7c,the amount of CO and CH4produced increased with time,and the production of CO and CH4for complex 2 followed a nearly linear relationship with time.The production rate of CO for complex 1 decreased slightly with time, while the production rate of CH4increased slowly with time.Complex 3 had a very high selectivity for CO, but its rate was becoming slower.Compared with 1-3,complex 4 had the fastest production rate of CO, while the rate of CH4continued to increase.The recyclability of the catalyst is also very important during the catalytic reaction.Through the cycle test, the stability of complexes 1-4 was greatly maintained within five cycles (Fig.7d).As shown in the PXRD patterns (Fig.8a),the characteristic peaks of complexes 1-4 still existed, indicating that the photocatalytic reaction did not destroy the framework structure of MOF.Therefore, the reduction of catalyst activity during the reaction may be due to the re-coordination of some catalytic active sites with solvent water molecules, resulting in the disappearance of the unsaturated sites.

Fig.7 (a)Maximum CO/CH4 production rate of complexes 1-4 under light;(b)Amount of CO produced by complexes 1-4 under continuous illumination for 3 h;(c)Amount of CH4 produced by complexes 1,2,and 4 under continuous illumination for 3 h;(d)Catalyst cycle stability test
Based on the analysis of the above experimental results, this work explores the possible mechanism of photocatalytic CO2reduction by complexes 1-4.After vacuum activation, the guest water molecules and ligand water molecules were removed, which allowed complexes 1-4 to have an open channel in the structure, while the metal active sites were exposed to some extent.The conjugated system of the ligand traps light under illumination and forms photogenerated electronhole pairs.The electrons and holes are efficiently separated by rapid migration and participate in the CO2reduction and oxidation processes, respectively, allowing the photocatalytic CO2reduction to proceed in a fast and orderly manner.From the fluorescence test, it can be found that complex 1 had a significant burst relative to the others, indicating that it can rapidly transport photoelectrons and reduce the photoelectron-hole complex, allowing more photoelectrons to act on the reactants, thus improving the photocatalytic performance.In addition, the semiconductor properties of complexes 1-4 have been studied using solid-state UV diffuse reflectance and Kubelka-Munk functions.As shown in Fig.8b, the bandgap widths of complexes 1-4 were 2.52, 2.67, 2.72, and 2.66 eV, respectively, and the normal semiconductor bandgap range was 0.5-5.5 eV.Complex 1 had the smallest band gap,which firstly improves the light absorption ability, and the jump energy between the conduction band and valence band decreases, and more electrons can be excited into the conduction band to participate in the photocatalysis,thus enhancing the photocatalytic performance.The above results explain the highest photocatalytic yield of complex 1.The possible intermediates that can be produced during the photocatalytic reaction to generate CO are given:
Continued speculation is made about the intermediates that might be produced during the photocatalytic reaction to produce CH4:
3 Conclusions
In summary, we obtained four new MOFs with different structures by metal ion stimulation, and it is interesting to note that this transformation process was realized in the form of single-crystal-to-single-crystal.The structural stability achieved by metal ion stimulation is increased due to the coordination instability and framework flexibility of the parent structure.This is also evidenced by the lower catalytic activity and higher product selectivity in the photocatalytic CO2reduction reaction.Such structural transformations achieved by external stimulation are undoubtedly practical guidance for precise preparation and controlled synthesis.
Conflicts of interest:All authors claimed no competing interest.
Acknowledgments:The research work was supported by the National Natural Science Foundation of China (Grants No.22101006,21771101),Natural Science Research Major Project of Anhui Provincial Department of Education (Grant No.2023AH040071), and Anhui Provincial Natural Science Foundation(Grant No.1908085QB49).
Supporting information is available at http://www.wjhxxb.cn
猜你喜欢
意林彩版(2022年1期)2022-05-03
安庆师范大学学报(自然科学版)(2021年4期)2021-12-12
化工职业技术教育(2021年5期)2021-11-09
中国石油石化(2021年16期)2021-10-14
化工职业技术教育(2021年1期)2021-03-15
陶瓷学报(2019年5期)2019-01-12
三峡大学学报(自然科学版)(2017年1期)2017-03-20
化工学报(2016年3期)2016-03-14
中国资源综合利用(2016年9期)2016-01-22
应用化工(2014年7期)2014-08-09