
Multi-Perspective Data Fusion Framework Based on Hierarchical BERT:Provide Visual Predictions of Business Processes
2024-03-12 06:11YongwangYuanXiangweiLiuandKeLu
Computers Materials&Continua 2024年1期
Yongwang Yuan ,Xiangwei Liu and Ke Lu,3
1School of Mathematics and Big Data,Anhui University of Science and Technology,Huainan,232001,China
2School of Economics and Management,Anhui University of Science and Technology,Huainan,232001,China
3The Key Laboratory of Embedded System and Service Computing Ministry of Education,Tongji University,Shanghai,201804,China
ABSTRACT Predictive Business Process Monitoring (PBPM) is a significant research area in Business Process Management(BPM) aimed at accurately forecasting future behavioral events.At present,deep learning methods are widely cited in PBPM research,but no method has been effective in fusing data information into the control flow for multi-perspective process prediction.Therefore,this paper proposes a process prediction method based on the hierarchical BERT and multi-perspective data fusion.Firstly,the first layer BERT network learns the correlations between different category attribute data.Then,the attribute data is integrated into a weighted event-level feature vector and input into the second layer BERT network to learn the impact and priority relationship of each event on future predicted events.Next,the multi-head attention mechanism within the framework is visualized for analysis,helping to understand the decision-making logic of the framework and providing visual predictions.Finally,experimental results show that the predictive accuracy of the framework surpasses the current state-ofthe-art research methods and significantly enhances the predictive performance of BPM.
KEYWORDS Business process prediction monitoring;deep learning;attention mechanism;BERT;multi-perspective
1 Introduction
Business Process Management(BPM)is typically monitored by transaction information systems that generate massive datasets called event logs[1–4].Predictive business process monitoring(PBPM),is a crucial research direction in business process management (BPM) [5,6].Accurate prediction of future behavioral events can provide significant support for downstream tasks in BPM,such as conformance checking[7],event log repairs[8],and anomaly detection[9,10].
In PBPM,ensuring the prediction process originates from a global perspective is crucial to enhance the quality and reduce biases or limitations in the predicted outcomes.For instance,by analyzing data information and behavior from different perspectives within the process,a more comprehensive consideration of factors can be achieved,thereby improving the accuracy and credibility of predictions.However,the current field of PBPM research mostly focuses on analyzing from a singular perspective.In recent research,Hinkka et al.[11] have proposed a new clustering technique based on the RNN neural network model.In specific circumstances,by combining the attribute data values of the original events,the prediction accuracy can be improved.In another work,Everman et al.[12]also used the RNN network to predict the next event.The core of their method is to construct RNN input by concatenating attribute data values and encoding in the embedding space to improve the prediction accuracy of the process model.However,they only made process predictions based on a single perspective of attribute data flow,neglecting the process behaviors and logical relationships in the control flow perspective.Tax et al.[13] applied the LSTM network to business process prediction.Their method can predict the next activity and the continuation of the running case until its completion.With the emergence of the attention mechanism[14],researchers have found that it can be applied in BPM with good results.Bukhsh et al.[15]used a Transformer model based on an attention mechanism to predict the next activity in real event logs,which demonstrated good performance.However,they only use control flow to represent the entire event log,neglecting other important attribute values in the data flow.The above methods have their limitations:(i)Analyzing process behavior solely from a single perspective (control flow or data flow) neglects the impact of data information from other perspectives on predictive performance,thus failing to consider all perspectives simultaneously.(ii)Employing RNN or LSTM neural networks poses significant issues such as gradient explosion and lack of parallel processing capabilities.
Effective PBPM methods must be able to simultaneously and comprehensively examine all process perspectives.Therefore,Guzzo et al.[16] and Pasquadibisceglie et al.[17] have employed a multiperspective approach based on deep learning(LSTM) in business processes,analyzing complex and valuable information in event logs and conducting process behavior analysis from multiple perspectives.However,their method simply concatenates attribute data values without deeply learning the correlations between them.It cannot effectively integrate attribute data information into the control flow for multi-perspective prediction.Moreover,RNN and LSTM neural networks do not provide insight into the internal decision-making logic,making them typical black-box models.However,their research still faces critical issues:(i)Lack of in-depth learning regarding the correlation between attribute data and behavior.(ii) LSTM neural networks,being typical black-box models,lack the ability to deeply understand internal decision logic,resulting in poor interpretability of the prediction process.
To address the limitations of the aforementioned methods [11–17] in the PPBM domain,we propose an approach based on hierarchical BERT and multi-perspective data fusion (Abbreviation:HB-MPF framework)to overcome these unique challenges.The HB-MPF framework,unlike previous methods,effectively integrates data flow and control flow through a unique hierarchical BERT network,enabling a comprehensive multi-dimensional perspective analysis.Moreover,it resolves the significant gradient explosion issues present in RNN and LSTM within neural networks.The contributions of this paper are as follows:
1.We propose an HB-MPF framework that can effectively fuse data flow into control flow analysis.
2.Experimental results from five real event logs show that the framework we proposed has significantly enhanced the predictive performance of BPM,with prediction accuracy surpassing the current state-of-the-art research methods.
3.We visualize the multi-head attention mechanism within the framework for analysis,helping to understand the decision-making logic of the framework and providing visual predictions.
4.Our research holds significant importance for the advancement of the PBPM field.The multiperspective behavioral analysis method based on the HB-MPF framework can offer new insights into other domains within BPM.
The remainder of this paper is organized as follows: Related work is provided in Section 2.Section 3 presents background knowledge.Section 4 elaborates on the design framework of the proposed method.Section 5 presents the experiment and evaluation results.Section 6 concludes the paper and discusses future research directions.
2 Related Work
Recently,data generated through process behavior analysis of event logs and monitoring and predicting online business workflows has become a popular topic in the academic sphere.In the past,traditional methods relied on hidden Markov models[18]or explicit process models[19]within state transition systems.Although this approach yields satisfactory predictive results,it is only applicable to concise and simple processes,with significantly reduced accuracy when handling lengthy and complex workflows.
Artificial intelligence technology has achieved notable success in various domains,such as audio recognition [20],semantic recognition [21],and AI algorithms based on immunity,among others[22,23].AI-based deep learning techniques have also been widely applied in process mining and the field of PBPM.Rama-Manarriro et al.[24] provided a comprehensive literature review of methods utilizing deep learning techniques to address predictive tasks.Both references [25] and [26] used initial convolutional neural network models for event activity prediction,aiming to compare them with recurrent neural networks (RNNs).Lin et al.[27] employed an RNN-based predictive model to encode multiple attributes as additional information for events to predict the next event and its associated attributes.They assessed the significance of each attribute about events by analyzing the relative weights assigned to them.Jalayer et al.[28] incorporated a two-layer attention mechanism on top of LSTM to elucidate the significance of different categorical attributes and each event.Liu et al.investigated network enhancement algorithms[29–31],where in reference[30],a novel class of hierarchical networks with scale-free and fractal structures was proposed.This hierarchical network inspired our research.Camargo et al.[32] employed LSTM neural networks in conjunction with novel preprocessing and post-processing techniques to predict multiple categorical attributes of the subsequent event within a case,as well as the remaining event sequence.
Numerous tasks in natural language processing have demonstrated that the Transformer exhibits superior feature extraction capabilities compared to LSTM.Bukhsh et al.[15] proposed a PBPM method utilizing the Transformer network,which consists of multiple layers of encoders,decoders,and self-attention mechanisms.These components are employed for feature vector extraction and learning of enhanced correlations.Chen et al.[33] proposed a multi-task prediction approach for business processes based on BERT and transfer learning.They leveraged the BERT model and integrated transfer learning concepts,enabling rapid and effective application in tasks such as predicting the next activity and forecasting case outcomes.Multi-perspective learning is a well-established domain in machine learning that allows for a comprehensive exploration of feature diversity within each perspective,free from the curse of dimensionality [34].In references [35,36],they apply multiperspective techniques to BPM,enabling a more comprehensive analysis of process behaviors.
3 Background Knowledge
3.1 Definition
In this section,we will introduce some fundamental concepts [37] required for this paper,as defined below:
Structure of Event Logs: Processes are composed of cases,and cases are comprised of events,with each event uniquely associated with a single case.Events within cases are denoted by traces,the sequence of (unique) events.Events possess attributes,with common attribute labels encompassing activities,timestamps,cases,and resources.
Definition 1:(Events and Attributes):Events are associated with activities in the business process.An event E is represented by attributes: a,c,and t.Here,a ∈A represents the activity attribute associated with the executing event,c ∈N represents the case attribute,and t ∈N represents the timestamp attribute of the event.
Definition 2:(Case,Trace,Event Log):A case,denoted as c,symbolizes an execution of a process model.Each event within an event log necessitates a corresponding case.Cases,akin to events,bear attributes.A case c is represented by the tuple c=n,σ,where n ∈N+signifies the attribute identifier of the case.Every case is endowed with a distinctive mandatory attribute-the traceσ.
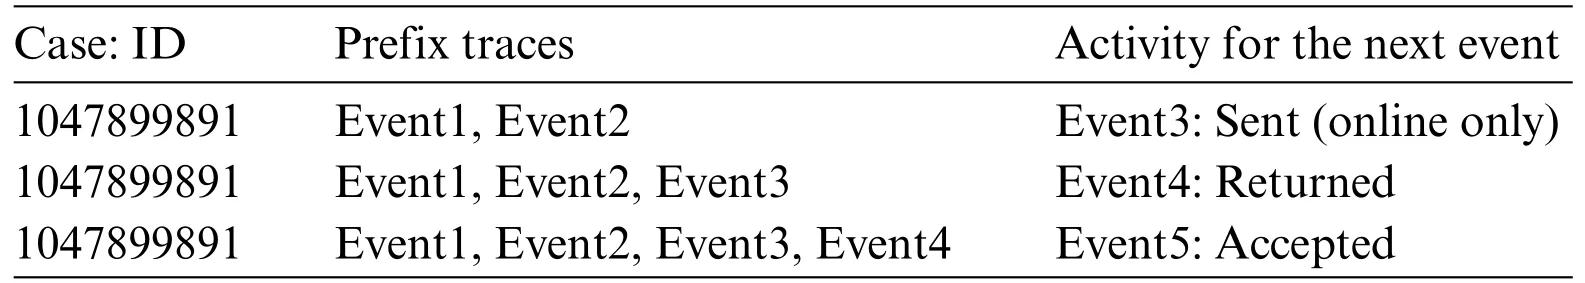
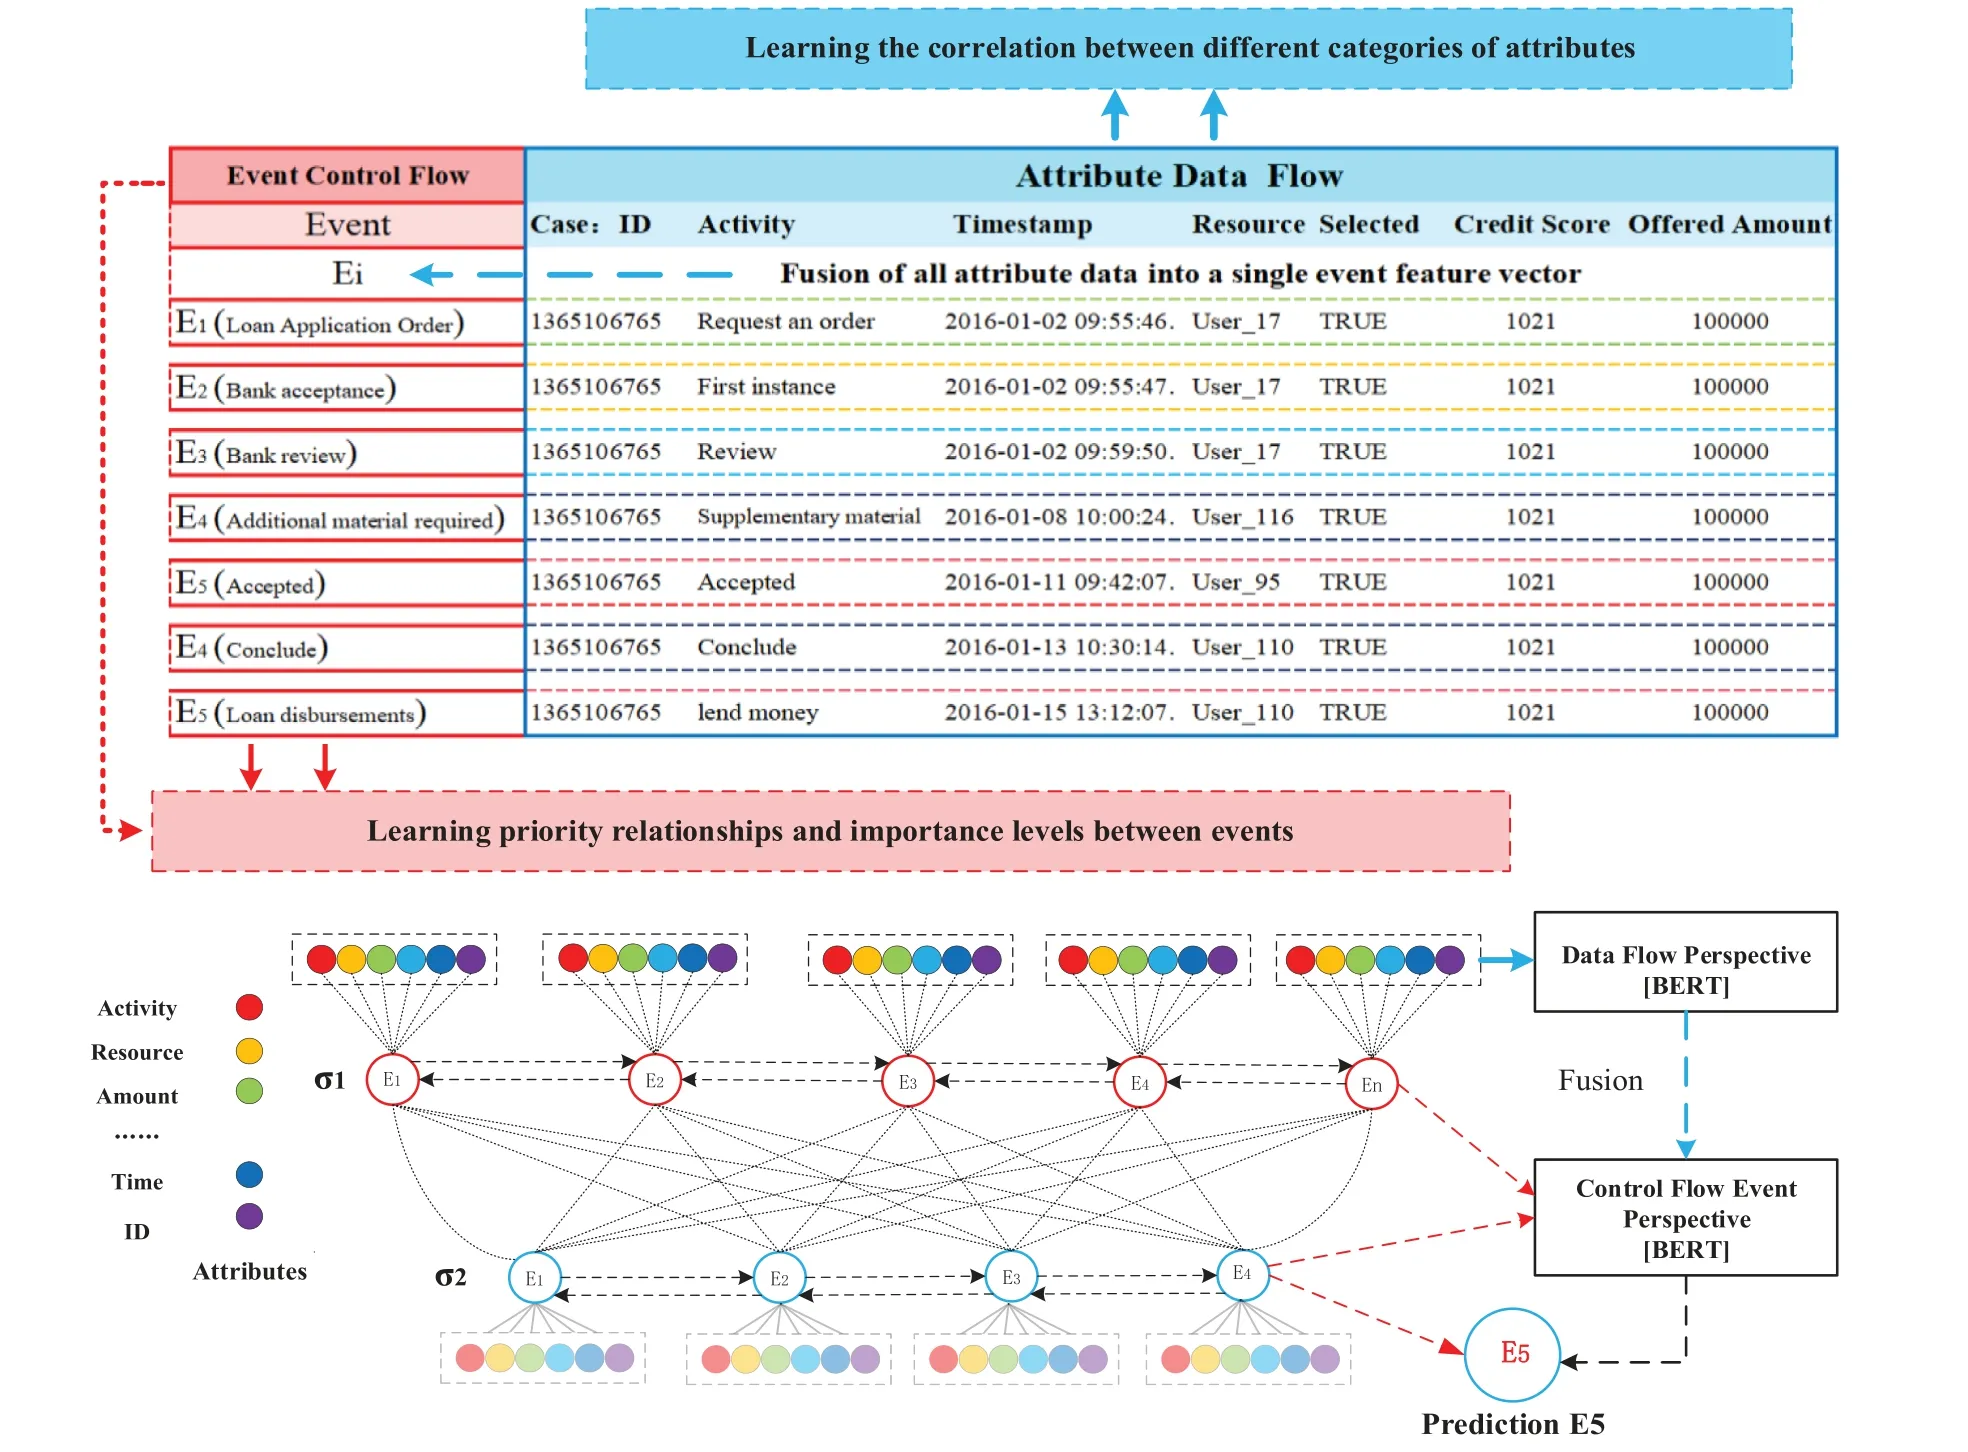
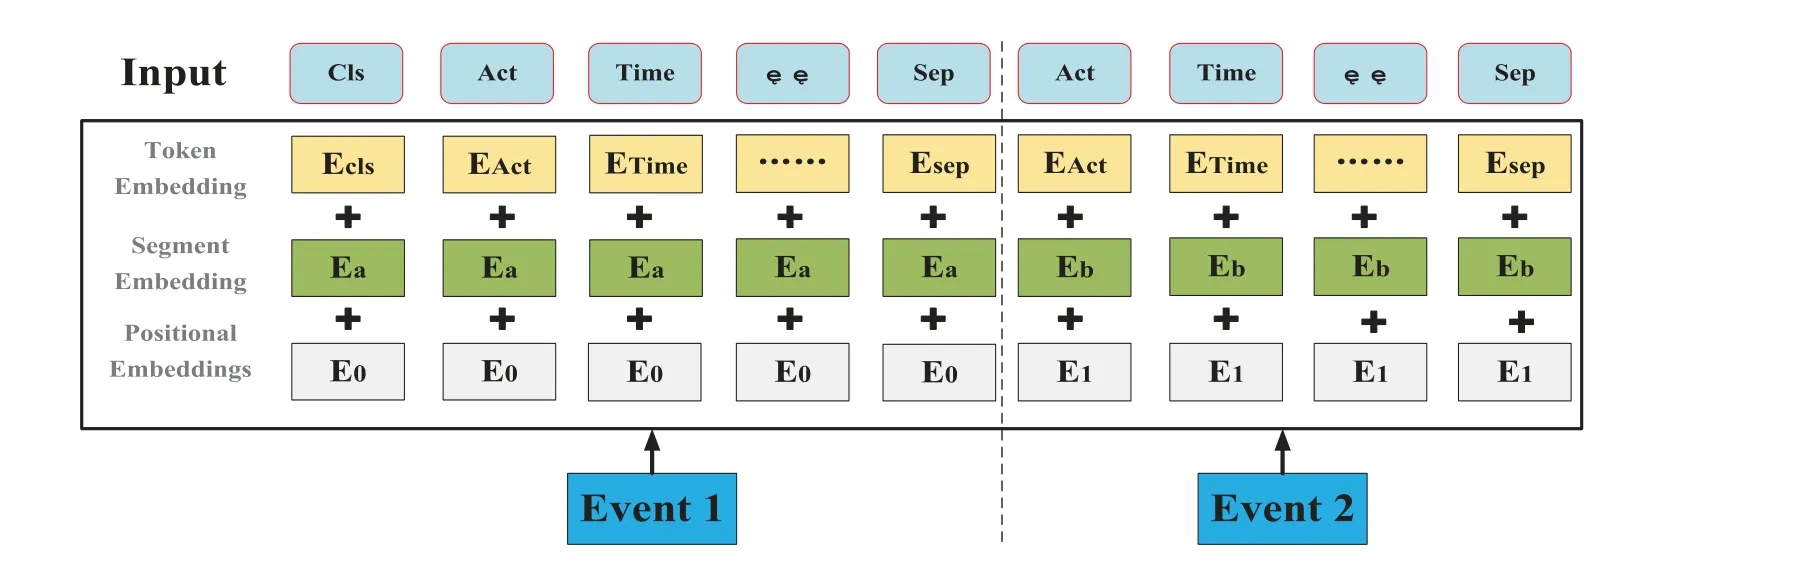
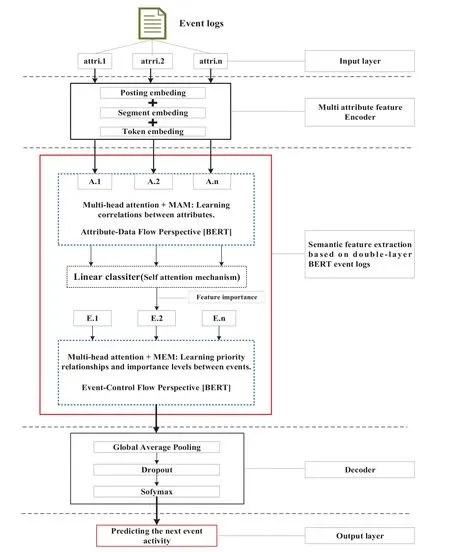
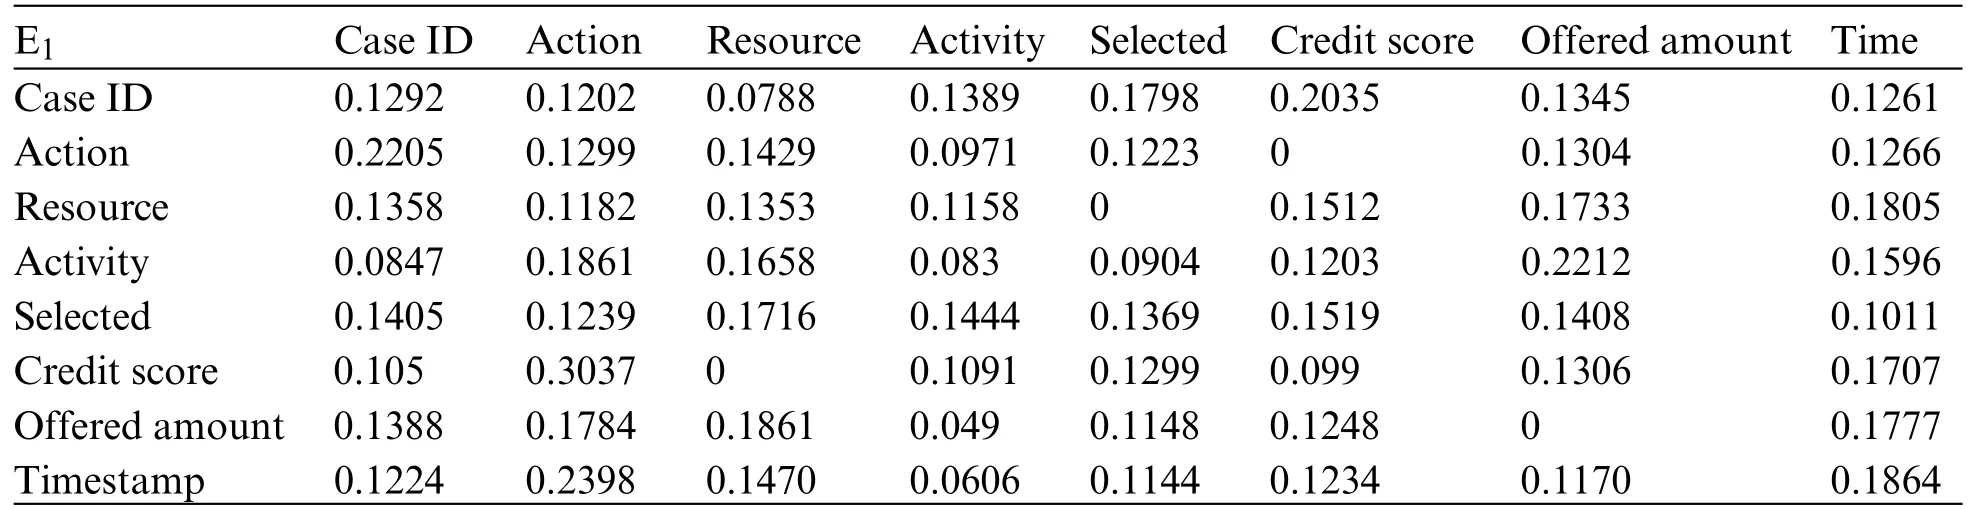
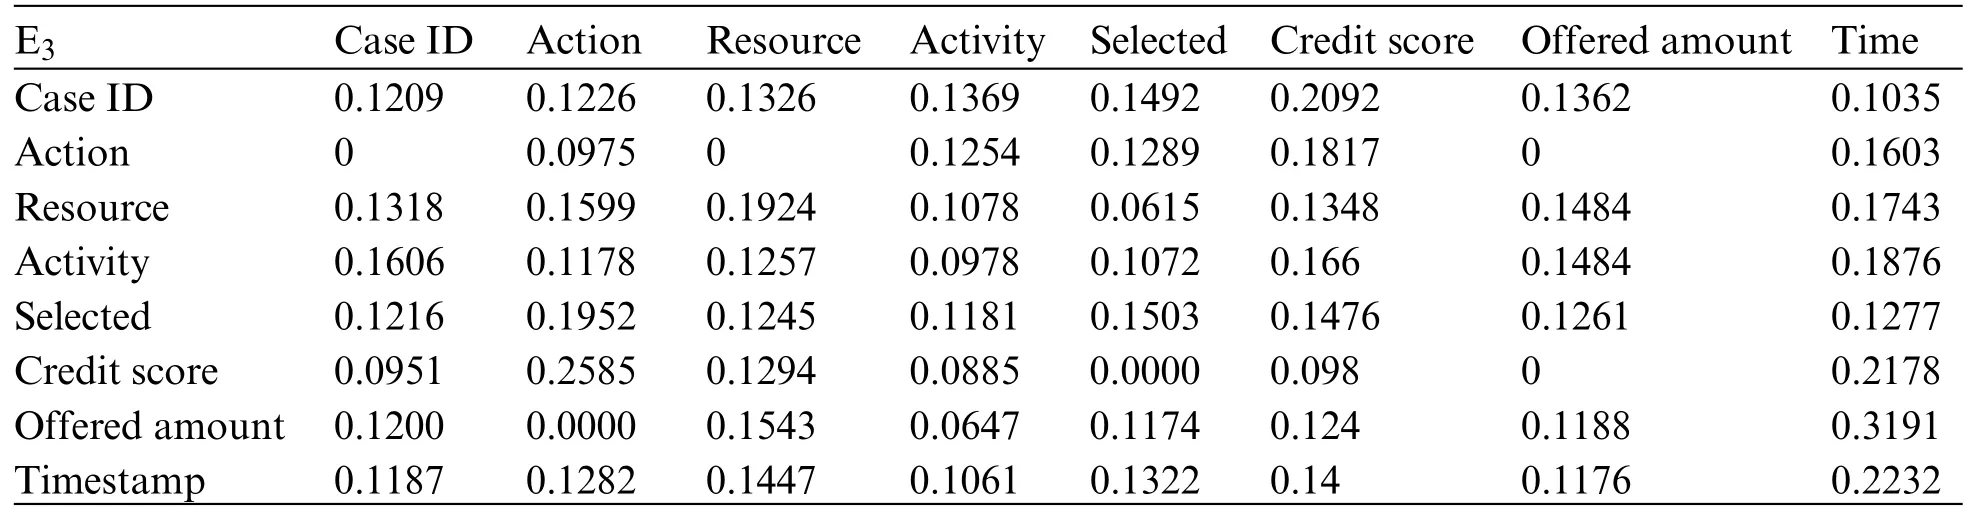
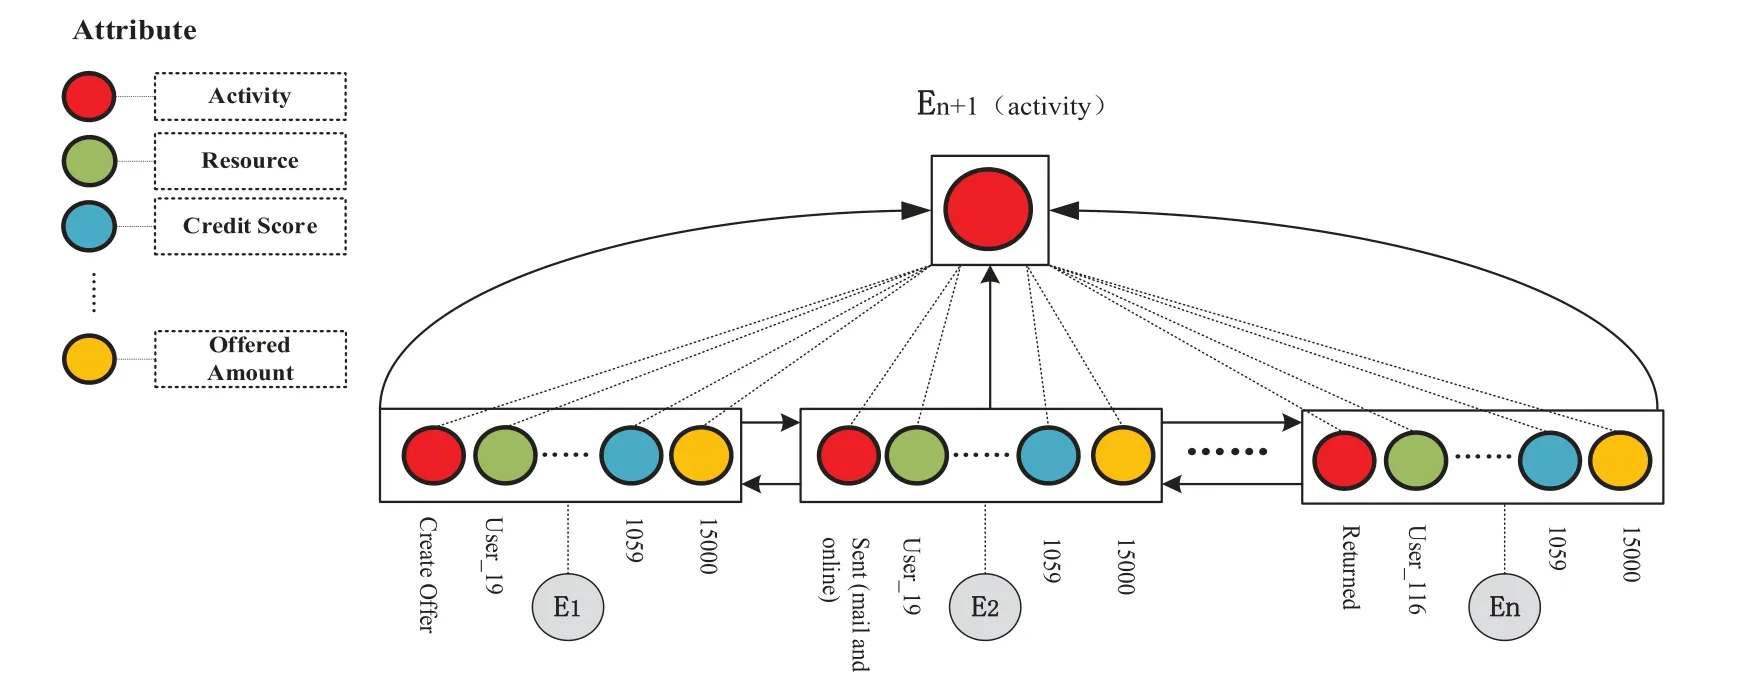
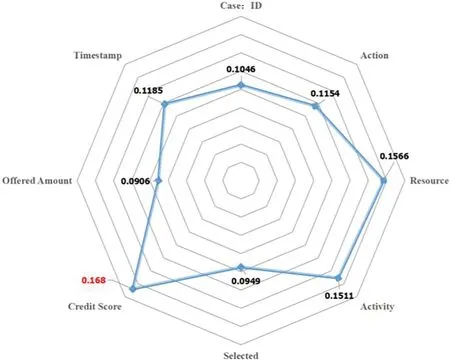
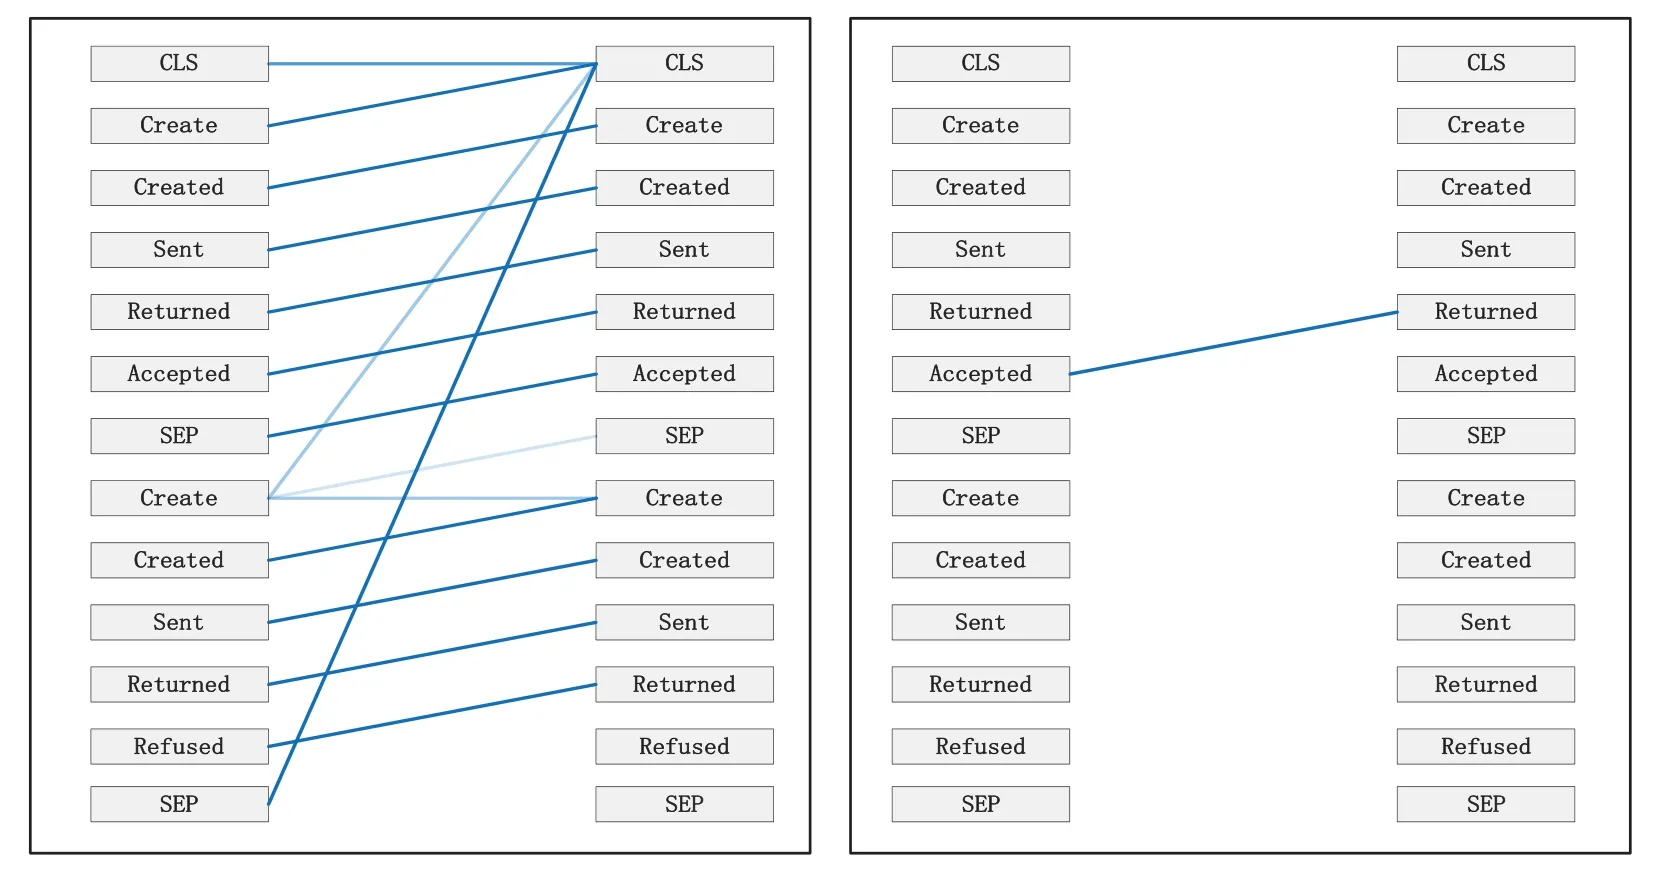
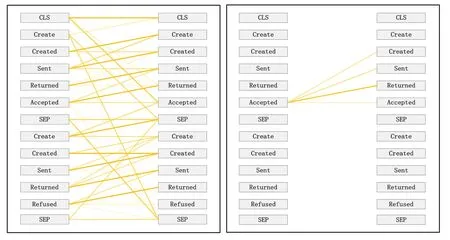
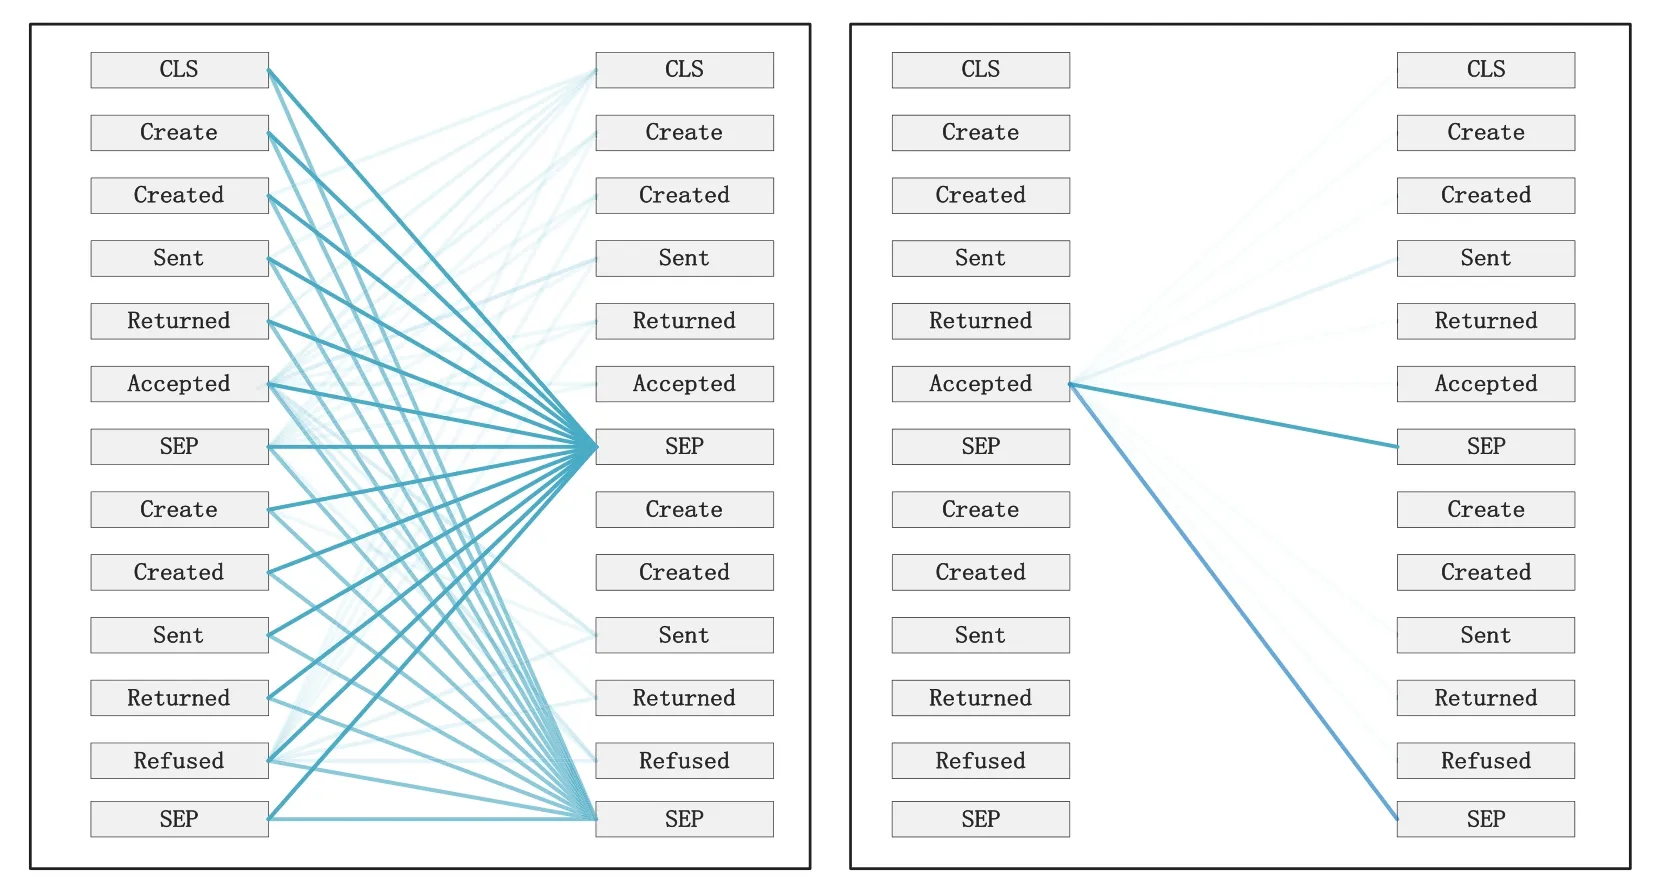
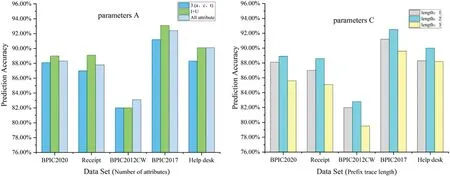
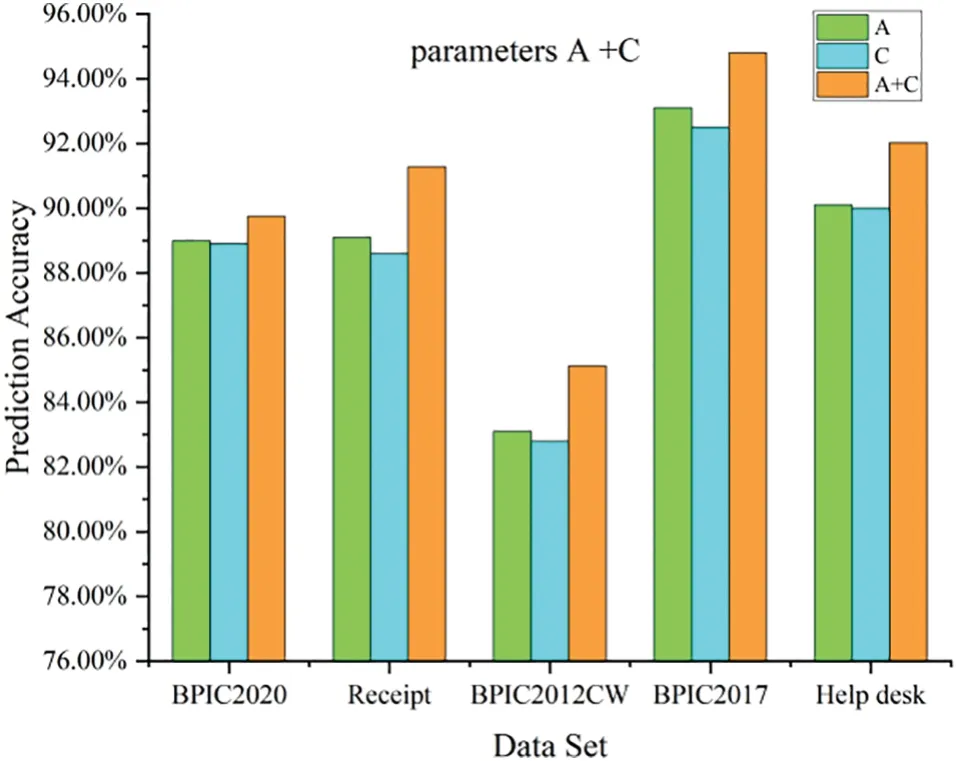
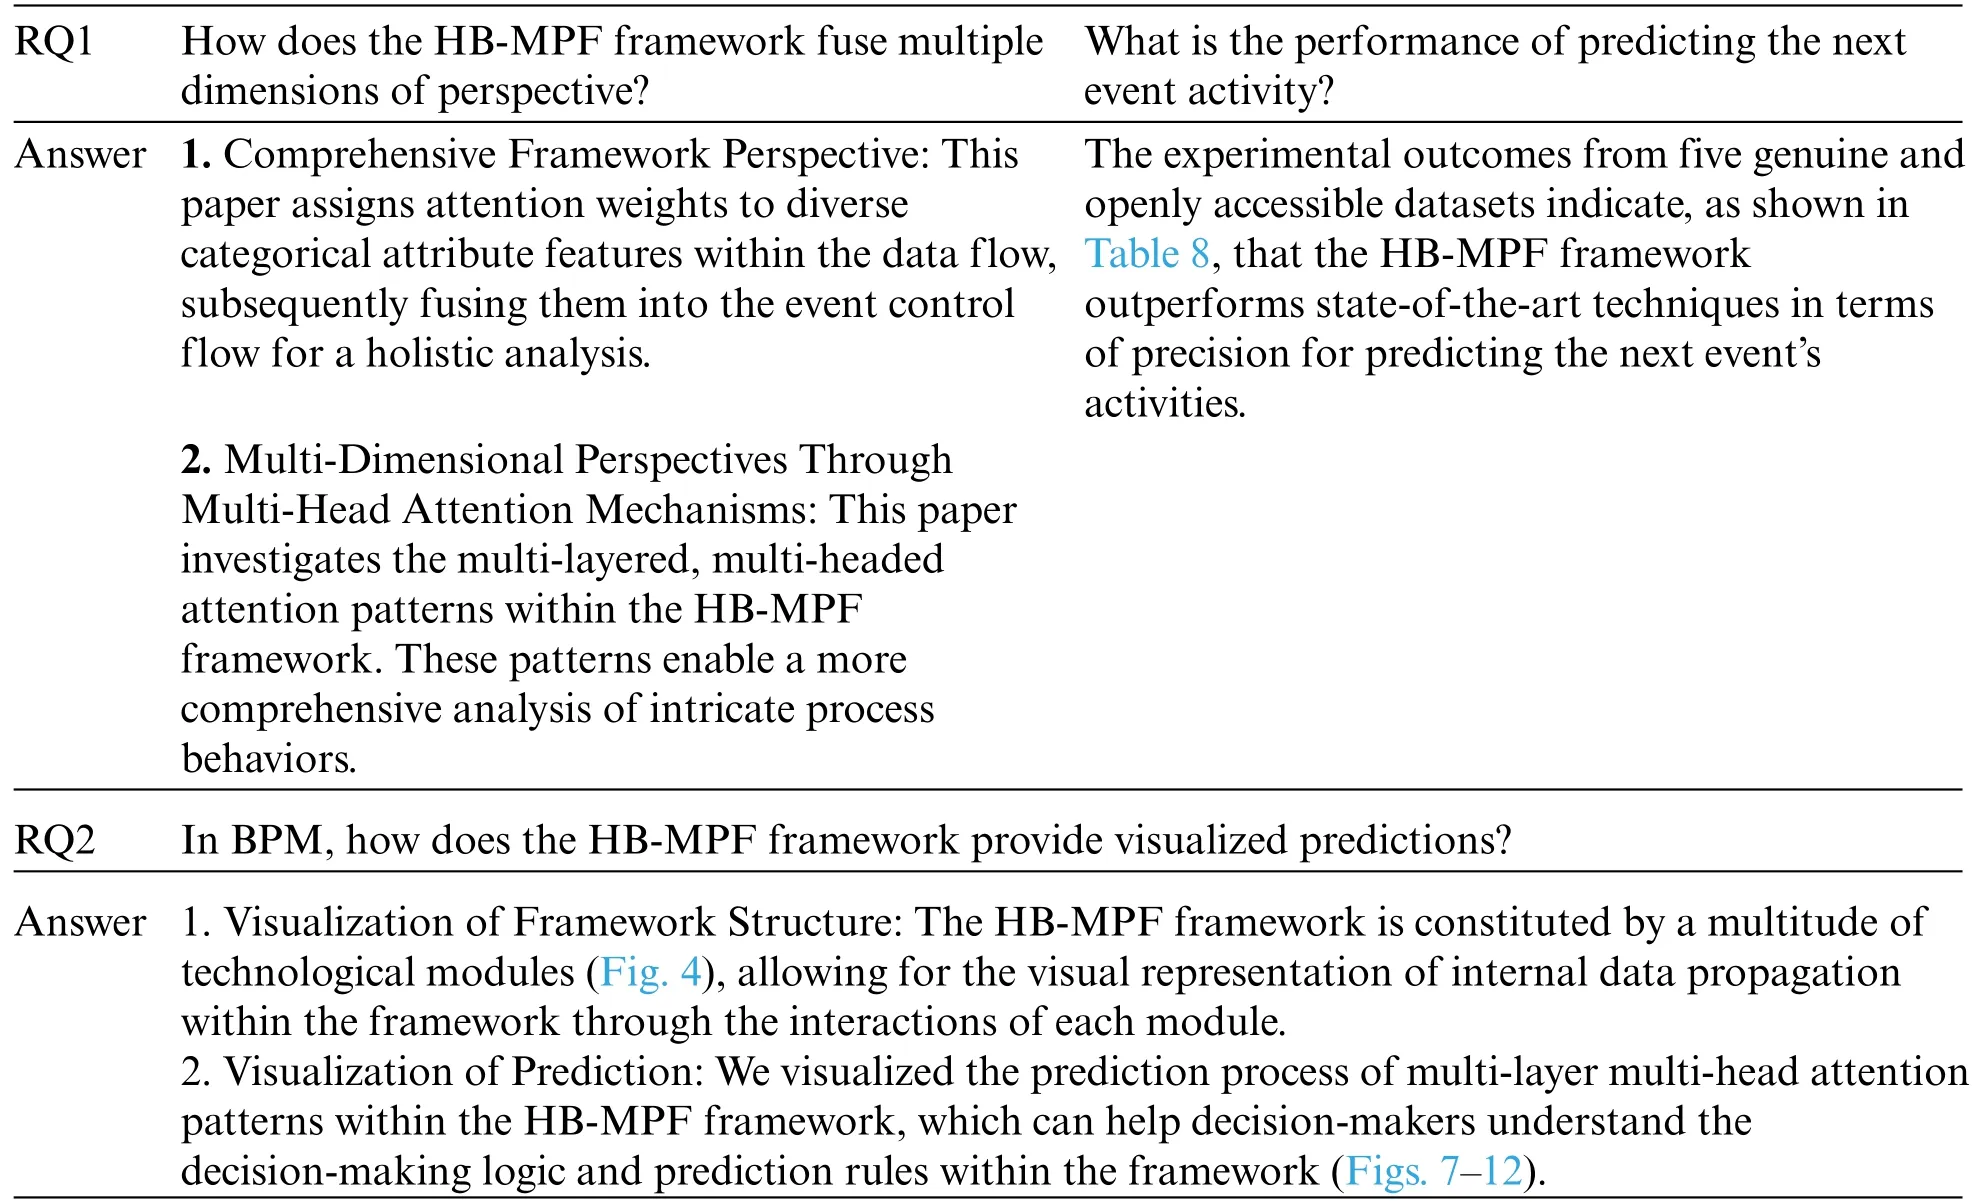
A trace is a finite sequence of events denoted asσ=E1,E2,...,E|σ|,where each event occurs only once,i.e.,for ∀1 ≤i An event log Table 1 constitutes a collection L of cases c,where each event occurs at most once within the entire log.In other words,for any c1,c2∈L,it holds that c1/=c2. Table 1: Event log BPIC2017 Definition 3:(Prefix Trace): A prefix traceσnis the subsequence of the first n events starting from the beginning event of traceσ.In other words,σn=E1,E2,...,En(1 ≤n ≤|σ|).Therefore,a trace represents a complete case,including the start and end events,while a prefix trace represents an ongoing case that corresponds to a case. Definition 4:(Next Event Activity Prediction): This entails the combination of preceding trace sequences from the event log.For instance,predicting“Event3”necessitates the prior trace“Event1”,or “Event2”.Consequently,a preprocessing step is applied to the event log.A minimal prefix trace length,denoted as Lσ(Lσ: >=2),is set,and values of all traces less than Lσare disregarded.The optimal value for Lσis determined through experimentation,as excessively large Lσvalues could lead to a reduction in the sample size of the training dataset.Refer to Table 2 for specific details(Table 1 encompasses distinct attribute categories within each Event entry). Table 2: Event log an example of pre-processed prefix traces in BPIC2017 The Transformer model [14],proposed by A.Vaswani et al.,is a sequence-to-sequence model based on the self-attention mechanism.It has achieved remarkable success in machine translation tasks and stands as a significant milestone in the field of Natural Language Processing(NLP).The core idea of the Transformer is to completely abandon traditional recursive and convolutional operations and instead establish associations between different positions in a sequence through the self-attention mechanism.The self-attention mechanism is the cornerstone of the Transformer model.In the encoder,self-attention allows each word at a given position to interact with words at other positions within the sequence. BERT[38]is a Transformer-based pre-trained language model introduced by J.Devlin Compared to traditional language models,BERT’s breakthrough lies in its adoption of a bidirectional pre-training approach.Unlike conventional language models that only utilize context information from either the left or right side,BERT incorporates both left and right context information,hence referred to as“bidirectional”.As shown in Fig.1.In specific tasks,the pre-trained BERT model can be employed as a feature extractor or fine-tuned for downstream applications.Through fine-tuning,BERT can adapt to various domain-specific tasks.In this paper,BERT is utilized as a feature extractor to encode input event logs into vector representations,which are subsequently used for task-specific training and prediction. Figure 1:BERT This paper describes the advanced perspective of the HB-MFP framework,as shown in Fig.2.Firstly,using multi-attribute feature encoder technology,the features of the different category attributes of each event in the event log are extracted for encoding.All these attributes are then input into the dual-layer BERT model for semantic feature extraction of the event log,which aims to capture the correlation between the attribute-data flow and the event-control flow.Finally,the main focus of this paper can be divided into the following two aspects:1.In comparison to existing advanced research methodologies,this study aims to evaluate whether the HB-MPF framework enhances the predictive performance of BPM.2.This paper enhances the transparency of the black box model through the utilization of the FPM framework,while also providing visualization of the internal predictive process within the framework. Figure 2:Presenting the HB-MPF framework based on a financial lending example Compared to the limited consideration of a single perspective in existing methods,the framework proposed in this paper preserves the integrity of event logs maximally and enables the analysis of data information generated from process behavior from a global perspective,as detailed in Fig.2.Fig.2 is a partial representation of the event log,with each event containing different categories of attributes(Case: ID,Activity,Timestamp,Resource,Credit Score,Offered Amount,Accepted...and other unlisted attributes).Each trace contains a sequence of eventsσ={E1,E2,...,En} with continuous time series.Therefore,it is important to consider not only the control flow perspective represented by the activity names but also the attribute-data stream perspective in the events,such as the high or low credit score and the size of the offered amount,which can affect whether the loan application process is accepted or rejected.The following sections will provide a detailed description of each technical module in the design framework and its respective function. The event logs are pre-processed and converted into a data set in XES data file format.The dataset is then divided into two parts:80%is used as a BERT model in the pre-training professional field for the prediction tasks,and the remaining 20%is used as a test validation set. Input Layer:Extract features from different categorical attributes (e.g.,Table 1) in the event log as inputs to the framework,X={att1,att2,...,attn}.These attributes include Case ID;Activity;timestamp;Resource;Credit Score;Selected;Offered Amount,etc. Multi-Attribute Feature Encoder:The extracted features from different categorical attributes in the events are input to this layer.Additionally,for computational convenience,the length of the input vectors must be kept consistent.Since the number of attribute categories varies across different event logs,the calculation should consider the maximum number of possible values and use it as the input vector length.Padding is used for a smaller number of attribute categories to make them have the same length.Therefore,the calculation method for the length of the input vector is as follows: lens (each attribute’s input vector)=max({count(unique(attn))}). Fig.3 illustrates the specific encoding approach used in the multi-attribute feature encoder. Figure 3:Multi-attribute feature encoder Token Embeddings:Each attribute is transformed into a fixed-dimensional vector.In the BERT model of the pre-training professional field,each attribute is converted into a 128-dimensional vector representation(the optimal value is determined through training). Segment Embeddings:They allow BERT to handle classification tasks that involve different events in the inputs.These tasks include determining whether two events in a trace are similar.In the event log trace,two events are simply concatenated and fed into the model. Position Embeddings: Position embeddings enable the BERT model to capture the positional information vector of each input attribute,allowing it to learn the attribute-data information of the input event flow.The final encoding layer synthesizes the representations as follows. These representations will be element-wise summed to obtain a composite vector Aiof size(1,n,128),where 1 represents the batch size,n represents the number of input attributes,and 128 represents the vector dimension.Similarly,X′={A1,A2,...,An},where each Airepresents the corresponding attribute embedding vector,and denotes the output of the attribute feature encoder.Subsequently,the embedded attribute Aiis input into the next layer. The first layer BERT model learns attributes—the weight allocation of attributes of different categories in events from the attribute-data flow perspective to interpret which attributes or data account for a larger proportion.Therefore,we take the vectors Aiof different categorical attributes from the output of the multi-attribute feature encoder as inputs and feed them into the first layer of the BERT model for pre-training,as shown in Fig.4,the attribute-data flow perspective. BERT consists of multiple transformer encoder layers,each equipped with multi-head attention mechanisms.These attention mechanisms enable BERT to learn attribute data from different perspectives and automatically assign proportional weights to each attribute.By stacking multiple layers,BERT can learn and discover hidden correlations between attributes at deeper levels.Each attribute vector Aiis passed through three distinct linear layers,denoted as AQ,AK,and AV,resulting in three separate vectors:attribute query Q,attribute key K,and attribute value V,with dimensions dQ,dK,and dV,respectively.The scaled dot-product attention block calculates the dot product between K and Q,divides each key by a √and applies a softmax function to obtain the attention scores as weight values.The specific formula is as follows[14]: In the training process,backpropagation and gradient calculation are necessary.Setting attention scores to zero would impede effective gradient propagation.Therefore,attention scores are assigned an extremely small value instead of zero.Dividing by√ensures stable computation and propagation of gradients.BERT employs multi-head attention,enabling simultaneous focus on information from different representation subspaces at various positions. In the above equation,the parameter matrices for projection are denoted as WiQ∈Rdmoedl×dk,WiK∈Rdmoedl×dk,WiV∈Rdmoedl×dvand WO∈Rdmoedl×hdv.Here,dmodelrepresents the input dimension of the model,and dkrepresents the query dimension.The dimension of the parameter matrix WOis dmoedl×hdv,where hdvrepresents the product of the number of attention heads and the dimension of values.The headncorrespond to the number of attention heads.WOis utilized to perform linear transformations on the output of multi-head attention,resulting in the final model output.It is important to note that Wiand WOare typically learnable parameters that are updated and optimized through backpropagation during the model training process.BERT Masked Attribute Modeling(MAM)mechanism allows it to learn the importance of different categorical attributes for an event.The masking operation[MASK]with the token is performed as follows:M={A1,A2,...,An}. Figure 4:Deep neural network-based two-layer BERT,a multi-perspective framework for fusing data flow and control flow Randomly,15%of tokens(attributes)in an event are replaced with the following criteria: 1.80%chance of being replaced with[MASK]. 2.10%chance of being replaced with any other token. 3.10% chance of remaining unchanged.The model is then trained to predict and restore the masked or replaced parts.During loss calculation,only the masked or replaced parts in step 1 are considered,while the remaining parts do not contribute to the loss calculation.Thus,any output for the unaffected parts does not impact the loss. This mechanism indeed forces the model to encode the sequence of attributes by considering their context(other different categorical attributes)rather than relying heavily on the current attribute alone.It enables the model to perform‘corrections’based on the context information.Finally,the learned representations of the different categorical attributes Ai′={A1′,A2′,...,An′} are output to the next layer. Fine-tuning+Self-Attention Mechanism: Fine-tuning BERT only requires modifications to downstream tasks(self-attention mechanism).Therefore,after training and learning in the first layer of the BERT model,the learned representations of different categorical attributes Ai′are used as inputs.These inputs are then passed into the self-attention mechanism layer,where feature selection is performed.This layer pays more attention to attributes with higher allocation weights and weights their importance accordingly.It is important to note that this paper does not interfere with determining the allocation weights for each attribute.Therefore,this process is entirely automated.Self-attention formula(4) After the first layer of the BERT model analyzes and learns from the attribute data of complex process behaviors,it generates an event vector Ei.Similarly,other event vectors in the trace are also obtained in this way,σ={E1,E2,...,En},and this vector serves as the feature vectors of the respective events,which are then inputted into the next layer. The second layer of the BERT model,in the Event-Control Flow Perspective,learns the importance and correlations between different events in predicting future events when multiple consecutive events occur.It aims to explain the impact and priority relationship of each event in predicting future events.This perspective is illustrated in Fig.4,the Event-Control Flow Perspective.The event vector Ei,which is the output of the previous layer of the BERT model after training and fine-tuning,is used as the input for this layer.Similarly,event vectors for all other events in the trace are created,σ={E1,E2,...,En}.The event vector Eicontains the feature information of all categorical attributes,and the timestamp attribute records the temporal sequence of events.All the contextual event vectors Eiare input into the second layer of BERT in parallel.Similar to the first layer of BERT,the Masked Even Modeling(MEM)mechanism masks 15%of the events in complete trace,M={E1,E2,...,En}.After pre-training,the BERT model can automatically learn the priority sequence,concurrency,asynchrony,and cyclic logical relationships among events in the trace.For example,when multiple consecutive events occur,the second layer of the BERT model learns the correlations between different events in predicting future events and automatically assigns different weights to each event in the trace.These weights reflect the importance of different events and explain the impact of different events on predicting future events. The final output layer takes the output from the second layer of BERT and passes it to the next activity prediction module.The next event prediction module consists of a global average pooling layer,a dropout layer,and a softmax layer. The highest-probability activity is chosen as the final output,representing the activity of the next event in the trace.The weight matrix WEcorresponds to the events within the trace. The proposed dual-layer BERT model employs an event-control flow architecture,with attributedata flow serving as the carrier.The event flow contains rich multi-attribute data feature information,enabling a multi-perspective analysis that integrates both control flow and data flow.The final output is the prediction of the En+1(activity),represented by its activity name,rather than predicting all attributes of the event.This approach significantly reduces training time,enabling a more efficient and accurate implementation of process monitoring and prediction tasks. In this section,we will outline the experimental setup used to evaluate the effectiveness of our approach.The experiments were conducted on five datasets,all derived from publicly available real event logs from the 4TU Research Data Center.Subsequently,we will discuss the results of the experimental activities,to provide answers to the following research questions. RQ1:How does the HB-MPF framework fuse perspectives from multiple dimensions,and what is its performance in predicting the next event’s activity? RQ2:In BPM,how does the framework perform visualized predictions? The remaining sections of this chapter are as follows: Section 5.1 provides an overview of the datasets and experimental configuration used in the methodology.Section 5.2 presents the visual prediction of HB-MPF framework fusion from multiple perspectives Section 5.3 presents the evaluation results of the experiments and discusses the impact of crucial parameters on prediction accuracy.Lastly,Section 5.4 summarizes the experimental findings and addresses the research questions about the HB-MPF framework. The experimental evaluation of the methodology in this paper is drawn from five different realworld datasets published by 4 tu.Research Data,each representing a different domain.Table 3 provides reference specifications for these datasets. Table 3: Reference specifications for event logs Help Desk1https://doi.org/10.4121/uuid:0c60edf1-6f83-4e75-9367-4c63b3e9d5bb: This data set pertains to ticket management processes in an Italian software company’s helpdesk.It consists of a concise case and a limited number of activities. BPIC20122https://doi.org/10.4121/uuid:3926db30-f712-4394-aebc-75976070e91f:This data set focuses on the application process for personal loans or overdrafts within a global finance institution managed by a Dutch financial institution.Specifically,this study utilizes the BPI2012WComplete variant,which includes traces of subprocess W while retaining the completed events. Receipt3https://data.4tu.nl/articles/dataset/Receipt_phase_of_an_environmental_permit_application_process_WABO_CoSeLoG_project/12709127/2: Derived from the CoSeLoG project executed under the NWO project number 638.001.211,this data set investigates the (differences) similarities between several processes in different cities in the Netherlands.The logs capture the execution records of the receipt phase in a building permit application process conducted by an anonymous municipal authority. BPIC20174https://data.4tu.nl/articles/dataset/BPI_Challenge_2017/12696884:This data set encompasses the loan application process of a Dutch financial institution.It includes all applications received through an online system in 2016,along with subsequent activities until February 01,2017,at 15:11. BPIC20205https://data.4tu.nl/articles/dataset/BPI_Challenge_2020_Request_For_Payment/12706886/1Payment Requests:This dataset comprises events related to payment requests that are unrelated to travel.Events were collected for two departments in 2017 and for the entire university in 2018.The process involves various licenses and declarations(domestic and international declarations,advance travel expenses,and payment requests). 5.1.1 Experimental Configuration Environment and Pre-Processing The HB-MPF method was implemented in Python 3.8 for this study.Table 4 presents the hyperparameter configuration used in the experiments,while Table 3 displays the hyperparameter configuration for other research methods.To predict the next event activity,it is necessary to consider the prefix traces occurring in the event log.For instance,predicting Event3 requires the prefix traces Event1 and Event2,and predicting Event4 requires Event1,Event2,and Event3.Therefore,the event log is preprocessed by setting a minimum prefix length,denoted as L(L:>=2).All traces with a length smaller than L are disregarded.The optimal value for L is determined through experimentation.Setting L too high may result in a reduction of samples in the training dataset.Further details can be found in Table 1(Each event in Table 1 contains attributes of different categories). Table 4: Hyperparameter configuration Table 5: Self-attention scores for different categorical attributes in E1 Table 6: Self-attention scores for different categorical attributes in E2 Table 7: Self-attention scores for different categorical attributes in E3 Illustrating with the event log BPIC2017(Fig.2),which pertains to the loan application process of a Dutch financial institution,this study exemplifies how enterprises forecast loan application processes for distinct clients.The objective is to predict the final approval outcome of loan applications from various clients,thus mitigating resource wastage and identifying bias. Building upon the research of[39,40],this study employs the multi-head attention mechanism of BERT to present the interplay of data information and visualize the internal operational processes of the model.Firstly,an analysis from the perspective of attribute-data flow is conducted.Events are compositions of attributes.Diverse categories of attribute data are inputed into the framework for training,whereby the self-attention mechanism intuitively focuses on which attributes-data elements carry the most substantial impact on prediction outcomes (refer to Fig.3).Then,computation of feature weight values (determined through attention scoring) elucidates the significance of distinct attribute categories and the interrelationships between them.Thirdly,the visualization of internal operations from the perspective of attribute data flow is shown in Fig.5.Subsequently,the event streams E1,E2,and E3are further transformed into vectors composed of attributes from different categories for comparison. Figure 5:Attribute-data flow perspective for internal operations visualization In Tables 5–7,noticeable variations can be observed in the self-attention score weights for different attribute categories in events E1,E2,and E3.This is because different attributes are focused on in different events to determine which attributes-data have a higher degree of influence.The utilization of multi-layer,multi-head attention enables the learning of associations between attributes and data from multiple perspectives.By executing multiple self-attention mechanisms in parallel,the model simultaneously focuses on different perspectives of the input sequence,capturing the semantic information of the input event logs from various angles,thus enhancing the model’s representational capacity.Furthermore,as each attention head can specialize in different segments,the multi-head attention mechanism excels at handling long-range dependencies within the input sequence.Finally,the outputs from these diverse attention heads are concatenated along the feature dimension and subjected to another linear transformation to obtain the final output. The BERT model outputs these attribute data,which are subsequently subjected to weighted through a neural network layer utilizing a self-attention mechanism module.This process yields the proportional weight relationships among different attributes within events,as depicted in Fig.6,enabling the identification of attributes with higher weight proportions and greater impact.In Fig.6,it can be observed that the attention weights for the Credit Score attribute are 0.168,for Resource are 0.1566,and for Activity are 0.1511.This indicates that these three attributes have received more attention within the events and carry greater weight in influencing future events.Conversely,attributes with smaller attention weights receive less focus.These attention weights are automatically obtained through training as optimal weights.This further confirms the effectiveness of the HB-MPF model,as the Credit Score significantly affects the success of loan applications,and Activity represents the sequence of activities in loan applications,which directly impacts subsequent events.The attributesdata within the event stream directly influence future events,thereby indirectly affecting the outcome of the process.Therefore,it is crucial to analyze events from both the control-flow perspective and the attribute-data perspective,as this enables a more comprehensive understanding of complex event logs and results in more accurate predictions. Figure 6:The relationship between the weight of different categories of attributes in the event Using the data flow as a basis,further analysis of the event-control flow is conducted.The HB-MPF framework captures how the event flow information interacts between different traces.By employing the visualization of multi-layer,multi-head self-attention in the second layer of BERT,six key pattern perspectives are presented,for example,Figs.7–12.These patterns further elucidate the internal workings of the HB-MPF framework.They aid in understanding how the framework extracts semantic features from event logs,conducts behavioral analysis from different perspectives,and achieves higher prediction accuracy. Figure 7: Pattern 1: attend to the preceding event.Left: attention of all event streams in the trace.Right:attention weight of the selected event(accepted) Figure 8: Pattern 2: attend to the succeeding event.Left: attention of all event streams in the trace.Right:attention weight of the selected event(refused) Figure 9:Pattern 3:attend to events in the prefix trace.Left:attention of all event streams in the trace.Right:attention weight of the selected events(accepted) Figure 10:Pattern 4:attend to identical(including activities in other traces)or correlated events.Left:attention to all event streams in the trace.Right:attention weights of selected events(refused) Taking the event log BPIC 2017 as an example,to interpret the internal workings of the framework,this study replaces the entire event representation with the activity names within the events (note that each event contains attributes from different categories).Events with temporal sequences such as O-Create Offer,O-Created,O-Sent,O-Returned,O-Accepted,or O-Refused are represented as Create,Created,Sent,Returned,Accepted,and Refused,respectively.In the following Figs.7–12[41],the color transparency of the connecting lines between events represents the magnitude of attention weights(higher transparency corresponds to lower attention weights),and different colors are used to indicate attention interaction connections between different layers. Figure 11:Pattern 5:attend other events capable of predicting the current event.Left:attention of all event streams in the trace.Right:attention weights of selected events(refused) Figure 12: Pattern 6: attention separator.Left: attention of all event streams in the trace.Right:attention weight of the selected events(accepted) Pattern 1(Fig.7):Attend the previous event.In this pattern,each position primarily attends to the preceding event(token)in the sequence.For example,in the 5th head of the 3rd layer in the diagram,the attention is mostly focused on“Returned,”which is the next event in the sequence.The left side of the diagram displays the attention for all event flows,while the right side shows the attention for a specific event. Pattern 2 (Fig.8): Attend the next event.In this pattern perspective,each position primarily attends to the next event in the sequence.For instance,in the 0th head of the 2nd layer in the diagram,most of the attention is directed towards“accepted,”which is the next event in the trace. Pattern 3(Fig.9):Attend to events in the prefix trace.This pattern,represented by the 11th head in the 6th layer,exhibits attention from “returned”primarily focusing on events in the prefix trace,enabling analysis and learning from previously occurred events. Pattern 4 (Fig.10): Attend to the same (including identical event activities in other traces) or related events.This pattern perspective,illustrated by the 11th head in the 1st layer,does not exhibit a prominent concentration of attention like some other patterns.Attention is dispersed across many different events.This pattern could be particularly useful for tasks involving the prediction of the next event activity(as part of the BERT pre-training task)as it helps identify relationships between different traces. Pattern 5(Fig.11):Attend other events that can predict the current event.This pattern perspective,represented by the 9th head in the 4th layer,seems to pay more attention to other relevant events that can predict the current event.For example,events such as“created”and“sent”in the prefix trace could be used to predict the“returned”event. Pattern 6 (Fig.12): Attend to separators.In this pattern perspective,most of the attention for events is focused on the separator tokens ([CLS] or [SEP]),as depicted by the 2nd head in the 9th layer.This might be a way for the model to propagate the event flow state of a trace to individual events. In the preceding text,we elucidated how the attention mechanisms of BERT manifest various patterns.For instance,one attention head predominantly focuses on the subsequent event within the sequence,while another attends to the preceding event.In both scenarios,BERT learns the intricate behavioral processes within the event log.We visually represented 6 distinct patterns of the internal attention structure in BERT,which aid in comprehending how multi-head attention captures correlations amid process behaviors.These patterns can embody a multitude of diverse relationships,such as sequence,recursion,concurrency,conflict,and other types of associations. To assess the HB-MPF capability in predicting the subsequent event activity in event logs,this study employed the accuracy metric.Thus,upon completion of the training phase,selected traces from the test set were provided to the model one by one,and the model’s predictions of the next event activity were compared to those of other state-of-the-art methods.The accuracy formula is as follows: The ablation experiments were analyzed for the HB-MPF framework,where the baseline criteria for this experiment were set as follows:the number of attribute categories was fixed at 3(representing the fundamental activities,cases,and timestamps within the event log),and the minimum prefix length was set to 1. Attribute data analysisinvolved comparing the number of distinct attribute categories present in the event log(parameter A).To ensure the integrity of the event log and the uniqueness of attributedata values,duplicate attribute-data entries were eliminated.The BPIC2012 dataset comprised 5 distinct attribute categories,BPIC2017 had 8 attribute categories,BPIC2020 featured 7 distinct attribute categories,and both the Help Desk and Receipt datasets consisted of 7 and 8 attribute categories,respectively. As shown on the left in Fig.13,the predictive performance was lowest when the number of attributes was 3.This can be attributed to the limited information provided by the key attribute data.However,as the number of attributes increased in the dataset,the prediction accuracy also improved,highlighting the criticality of preserving the integrity of attribute data within the event log.Nevertheless,including all attributes from the event log as inputs increased the computational complexity within the framework and introduced more noise,resulting in decreased prediction accuracy. Figure 13:Left figure:effect of the number of attributes of different categories on prediction accuracy(data flow perspective parameter A).Right figure:effect of setting the minimum length of prefix traces on prediction accuracy(control flow perspective parameter C) Event-control flow analysis involved setting the minimum length of events in the input prefix traces(parameter C)to 1(Event1),2(Event1,Event2),and 3(Event1,Event2,Event3),respectively. On the right side of Fig.13,it is evident that when the minimum length of events in the input prefix traces was set to 1,the predictive accuracy for all five real datasets was significantly lower compared to when the event length was set to 2.This discrepancy arises from the insufficient information provided by the data behaviors in the analysis of business process flows,resulting in lower prediction accuracy compared to the latter scenario.Furthermore,when the minimum length of events in the prefix traces was set to 3,the predictive accuracy reached its lowest point.This can be attributed to the limited sample size,leading to underfitting during training. Multi-perspective fusion analysis combined the analysis of the number of different attribute categories in the data flow and the length of prefix traces in the control flow to determine the optimal parameters A (I+U) and parameters C (2).The results presented in Fig.14 demonstrate the performance improvement achieved by these parameters in the HB-MPF framework,thereby validating the effectiveness of the proposed multi-perspective fusion approach. Finally,to demonstrate the HB-MPF framework’s ability to comprehensively analyze complex process behaviors and achieve higher accuracy in predicting the next event activity,a comparison was made between this study and existing state-of-the-art methods.Table 8 demonstrates that,compared to a single control flow(or data flow)perspective,the HB-MPF-based approach exhibits higher accuracy in predicting the next event activity.This further highlights the effectiveness of multi-perspective fusion behavior analysis,as opposed to solely considering a single perspective. Figure 14:Effect of parameters A on prediction accuracy Table 8:Comparison of the best prediction accuracy of the HB-MPF framework experimental results with other current state-of-the-art methods The following summarizes the main experimental results of Sections 5.3 and 5.4 to provide a clear answer to the research question defined at the beginning of this section. This paper proposes a process prediction method based on the hierarchical BERT and multiperspective data fusion(Abbreviation:HB-MPF framework).This framework can fuse data flow with control flow,providing a more comprehensive multi-dimensional analysis.The first layer BERT model learns attributes—the weight allocation of attributes of different categories in events from the attributedata flow perspective to interpret which attributes or data account for a larger proportion.The second layer BERT model learns events—when multiple continuous events occur,the importance degree and precedence relation of different events on the prediction of future events from the event-control flow perspective to interpret the importance degree and priority relationship of each event on predicting future events.We visualized the prediction process of multi-layer multi-head attention patterns within the HB-MPF framework,which can help decision-makers understand the decision-making logic and prediction rules within the framework.Thus provides visual predictions of business processes. Based on experimental analysis conducted on five real event logs,our proposed HB-MPF framework demonstrates superior predictive performance compared to current single-perspective methods,exhibiting higher prediction accuracy.Additionally,ablation experiments indicate that the number of different attributes in data streams and the length of prefix traces in control flows have an impact on predictive performance.This signifies that behavioral and data information from various perspectives influences predictive performance.Consequently,the multi-perspective fusion approach shows fewer limitations,higher comprehensiveness,and increased accuracy in comparison to single-perspective methods.Our research has advanced the development of PBPM by addressing the limitations associated with solely employing a single perspective for prediction.Simultaneously,it has brought new insights into other aspects of the BPM domain.For instance,offering a more comprehensive multidimensional behavioral analysis,along with integrating the multi-head attention mechanism for visual analytics,aids in addressing the issue of poor interpretability of deep learning techniques in BPM applications. In future work,the goal is to utilize HB-MPF as a model framework for analyzing process behavior in event logs and apply it to other relevant tasks in business process management.For example,multi-perspective event log repair,which involves restoring missing attributes in event log traces,and multi-perspective anomaly detection for detecting abnormal behavior based on multiple perspectives[42–44]. Acknowledgement:The authors would like to thank the editors and reviewers for their valuable work.We are also immensely grateful to Dr.Xianwen Fang for his guidance. Funding Statement:Supported by the National Natural Science Foundation,China (No.61402011)and the Open Project Program of the Key Laboratory of Embedded System and Service Computing of Ministry of Education(No.ESSCKF2021-05). Author Contributions:Yongwang Yuan: Conceptualization,Methodology,Data curation,Writingoriginal draft preparation,Investigation.Xiangwei Liu: Funding acquisition,Supervision.Ke Lu:Supervision. Availability of Data and Materials:A publicly available dataset was utilized in this study.These data can be found from:1.https://doi.org/10.4121/uuid:0c60edf1-6f83-4e75-9367-4c63b3e9d5bb.2.https://doi.org/10.4121/uuid:3926db30-f712-4394-aebc-75976070e91f.3.https://data.4tu.nl/articles/dataset/Receipt_phase_of_an_environmental_permit_application_process_WABO_CoSeLoG_project/12709 127/2.4.https://data.4tu.nl/articles/dataset/BPI_Challenge_2017/12696884.5.https://data.4tu.nl/articles/dataset/BPI_Challenge_2020_Request_For_Payment/12706886/1. Conflicts of Interest:The authors declare that they have no conflicts of interest to report regarding the present study.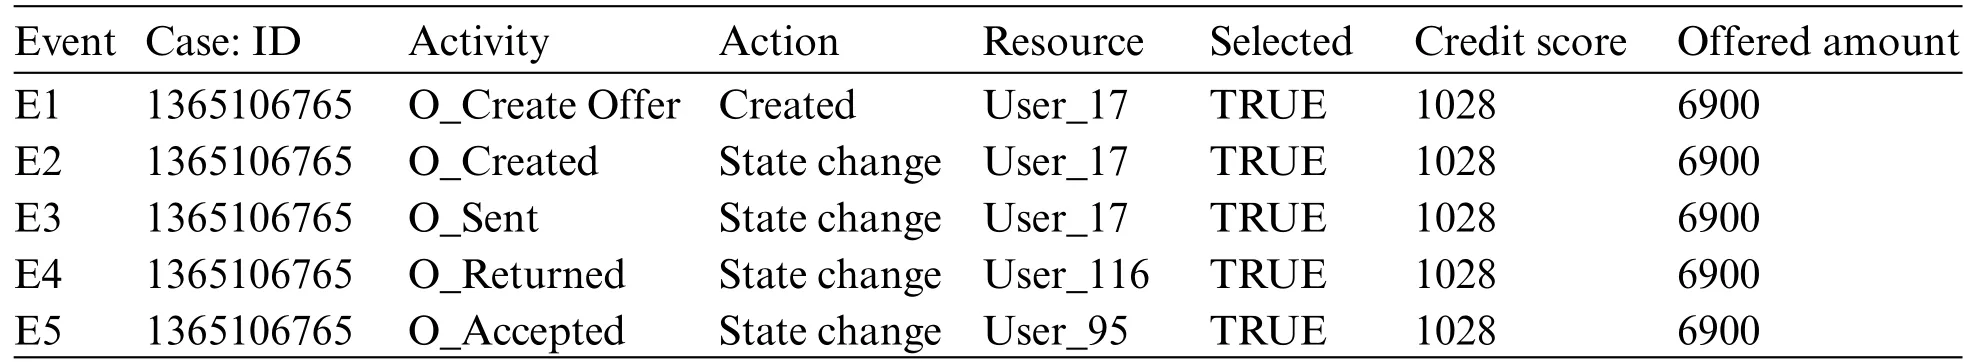
3.2 Deep Neural Network

4 Proposed HB-MPF Framework
4.1 Multi-Attribute Feature Encoder
4.2 Semantic Feature Extraction for Event Logs Based on Two-Layer BERT
4.3 (Decoder)Fine-Tuning Layer+Predicting the Activity of the Next Event
5 Experiment Evaluation
5.1 Data Set


5.2 Visualization Analysis from the Perspective of Attribute-Data Flow
5.3 Visualization Prediction from the Perspective of Event-Control Flow


5.4 Ablation Experiment

5.5 Discussion
6 Conclusion and Future Work
 Computers Materials&Continua2024年1期
- Computers Materials&Continua的其它文章
- Fuzzing:Progress,Challenges,and Perspectives
- A Review of Lightweight Security and Privacy for Resource-Constrained IoT Devices
- Software Defect Prediction Method Based on Stable Learning
- Multi-Stream Temporally Enhanced Network for Video Salient Object Detection
- Facial Image-Based Autism Detection:A Comparative Study of Deep Neural Network Classifiers
- Deep Learning Approach for Hand Gesture Recognition:Applications in Deaf Communication and Healthcare