
Simultaneously Designing and Targeting for Networks with Multiple Resources of Different Qualities*
2009-05-14 03:04LIUZhiyong刘智勇LIYanmei李艳梅ZHANGGuanglin张广林andYANGYuzhen杨玉桢
LIU Zhiyong (刘智勇), LI Yanmei (李艳梅), ZHANG Guanglin (张广林) and YANG Yuzhen(杨玉桢)
Simultaneously Designing and Targeting for Networks with Multiple Resources of Different Qualities*
LIU Zhiyong (刘智勇)1,**, LI Yanmei (李艳梅)1, ZHANG Guanglin (张广林)2and YANG Yuzhen(杨玉桢)3
1School of Chemical Engineering, Hebei University of Technology, Tianjin 300130, China2Department of Scientific Research Management, Hebei University of Technology, Tianjin 300130, China3School of Management, Hebei University of Technology, Tianjin 300130, China
This paper presents a new design procedure for the networks with multiple resources, such as hydrogen and water, of different qualities. The minimum consumption targets of the resources and pinch-causing sources can be identified as well during design. The objective of this work is to reduce the consumption of the resources with higher quality due to their higher cost. A few examples are investigated to show the proposed method. For a network of single resource with single contaminant, there is often only one pinch point for the resource. On the other hand, for a network of multiple resources with single contaminant, there might be a few different pinch points. Each resource might have its own pinch point, if its amount is sufficient. The contaminant concentration of the pinch-causing source for a resource with lower concentration will be below that of the higher-concentration resource(s).
fresh resource target, multiple resources, multiple pinch points, pinch analysis
1 Introduction
The reduction of fresh resource consumption and waste discharge in chemical industry is imperative under the situation of the stricter environmental protection and the rising cost of waste treatment. Since Wang and Smith [1] presented water-pinch-analysis, many approaches have been proposed to design or find the minimum freshwater consumption targets for the networks with single freshwater resource [2-11]. Alves and Towler [12] addressed the minimum consumption target for hydrogen networks. Agrawal and Shenoy [10] proposed an approach to target and design water and hydrogen networks.
In the literature, most researches focus on single fresh resource systems. Wang and Smith [9] discussed the networks with multiple fresh resources briefly. However, no detailed research was carried out. For the single fresh resource networks, most of researchers considered the resource as 100% pure, such as 100% purity freshwater. In fact, the fresh resource is often not 100% pure in industrial practice. Most importantly, there are often several fresh resources with different qualities available. Generally speaking, the higher the quality of the fresh resource, the more expensive it is. Therefore, the use of the higher quality resource should be minimized at the expensing of lower quality ones. This means that, in the targeting and design of the resource-using network with multiple fresh resources of different qualities, the quality of the resources should be considered as well.
Recently, a few researchers addressed impure fresh resource or multi-resource problems. Shenoy and Bandyopadhyay [13] developed a methodology to target multiple resources through the source composite curves in order to minimize the operating cost of the overall process. The methodology was presented in both graphical and algorithmic forms. A few examples were investigated to demonstrate that the method can be applied to the problems of material management through appropriate reuse and recycle. Alwi and Manan [14] developed a graphical method, based on some heuristic rules, to determine the minimum flow rate targets for a single resource (or utility) and multiple resources using source and sink (demand) water composite curves. Foo [15] addressed the problems for single and multiple feeds of impure fresh water by using the numerical targeting tool of water cascade analysis technique [4]. A three-step procedure was proposed based on the modified water cascade analysis technique, which leads to the minimum pure and impure fresh water resources. Other researches on multi-resource targeting include the water source diagram proposed by Gomes. [16] and an algebraic approach proposed by Almutlaq and El-Halwagi [17].
The research mentioned above mainly addressed the resource-using networks of single contaminant. For the water-using networks of multiple contaminants, many approaches have also been proposed [18-28].
This paper presents a new method to design and target the networks with multiple resources of different qualities. The procedure proposed is simple to use compared to the literature methods.
2 Theory of the new method
In a resource-using network, there is a set of resource-related units. The inlet stream of each unit is called demand because it will need fresh resource or reuse the outlet streams of other units. The outlet stream of each unit is called internal source, because it can be reused for the other units. Some outlet (or source) streams cannot be reused by the demands because their qualities are too low and will be discharged as waste. Therefore, the waste belongs to sources instead of demands, as pointed out by Liu. [8]. There are also a few external sources with different qualities which can be used as source streams with or without flow rate limitations. In order to distinguish the external sources from the internal ones, the external sources are defined as Resources. The objective is to design the networks with the minimum consumption of the resources by considering both the amounts and the qualities of the resources.
Generally speaking, external sources are more expensive than internal sources, if they have the same quality, because of the following reasons: internal sources are “generated” in the network, because they are the outlet streams of the resource-using-units, and external sources are often purchased; external sources need shipment cost and storage cost. For a single contaminant system, concentration of the contaminant is often the most important factor of stream quality. For example, in a water-using network, the lower the concentration of the contaminant, the higher the quality of the water stream, and the more expensive of the stream.

Compared to the networks with single resource, a network with multiple resources often has special features. For a network with single resource, there is often only one pinch point. However, for a network with multiple resources, there might be a few different pinch points. Each resource might have its own pinch point, if its amount is sufficient. The concentration of the pinch-causing source of a resource will be below that of the higher-concentration resource (s). This is similar to the situation as discussed by Feng. [29] for regeneration target problems.
In the targeting and design procedure, it should be emphasized that the higher quality resource should be saved as much as possible. Therefore, a demand can be satisfied by the sources in analogy with the nearest neighbors approach proposed by Prakash and Shenoy [6], who have proved that the nearest neighbors approach can provide optimal solution for the water- using networks of single contaminant. In nearest neighbors approach, a demand with concentrationdwill be satisfied by a source whose concentration is just higher thandand a source whose concentration is just lower thand. For convenience, the source whose concentration is just higher thandis named as the higher concentration source (HCS) and the source whose concentration is just lower thandas the lower concentration source (LCS). If the concentration of the resource and that of the internal source are the same, the internal source will be reused first as discussed earlier. In fact, a demand stream might need a few source streams and a source stream might be reused by a few demand streams. However, in order to simplify the design procedure, only satisfying a demand stream by its HCS and LCS in each operation is considered. When satisfying a demand with its HCS and LCS, often only one of the streams is the determining-stream, which will determine the amount of the other two streams.
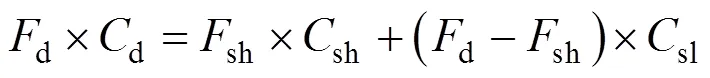
Now, the determination of the determining-stream and the calculation of the amounts of the other two streams are considered based on the amount of the determining-stream. The concentrations of the demand, its HCS and LCS are presented byd,sh, andsl, respectively. The mass load, flow rate and concentration of a stream have the following relationship:

If a demand stream with amount ofdcan be satisfied by its HCS with amount ofshand its LCS with amount ofsl, their relationship can be expressed as follows:


The amounts of the streamsd,shandslare named as Matched-stream Amounts, and the streams as Matched-streams, if they meet the conditions of both Eqs. (2) and (3). By solvingslandshfrom Eq. (2) and substituting them to Eq. (3), the following calculations can be obtained:


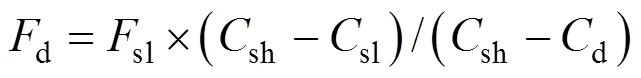
The following ratios can be written from Eqs. (5-7):


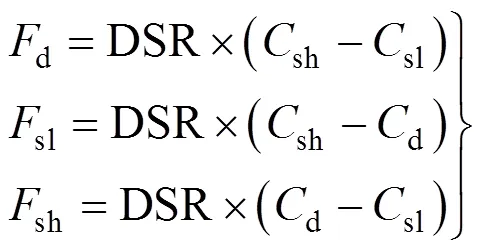
When the determining-stream is found, the amounts of the non-determining-streams can be calculated by using the following equations:
When a demand stream with amount ofdis satisfied by its LCS and HCS with matched amountsslandsh, respectively, the determining-stream is used up. The remainder amounts of the non-determining- streams will be the factual amounts for next step. For a resource with unlimited amount, it will not be a determining-stream.
The design and targeting procedure is as follows:
(1) Arrange the demand and source streams in ascending order of the concentration, respectively;
(2) For each demand stream, find its HCS and LCS. Identify the determining-stream according to Eq. (10), and calculate the matched amounts of the non-determining-streams by using Eq. (11);
(3) Subtracting the matched amount from the factual amount for each stream and the result is the factual amount of the stream for the next step. Go back to Step (2);
The maximum cumulative amount of each fresh resource will be its target; and the source corresponding to the target will be the pinch-causing source. The detailed calculation for Step (3) will be illustrated in the examples.
3 Case studies
3.1 Example 1
The example is a hydrogen network and taken from Alves and Towler [12]. In this example, the fresh resource has a 5% (by mol) impurity. Table 1 lists the original data for this example. Table 2 lists the generated data for this example. In Table 2, the streams with the same concentration in Table 1 have been lumped as one stream. In Table 2, the demand and source streams are arranged in ascending order of their concentrations, respectively.

Table 2 Generated data for Example 1
For the first demand of 19.39%, its HCS and LCS are the sources of 20% and 7%, respectively. Here, the source of 7% is the internal source whose concentration is just lower than 19.39%. DSR can be calculated from Eq. (10):
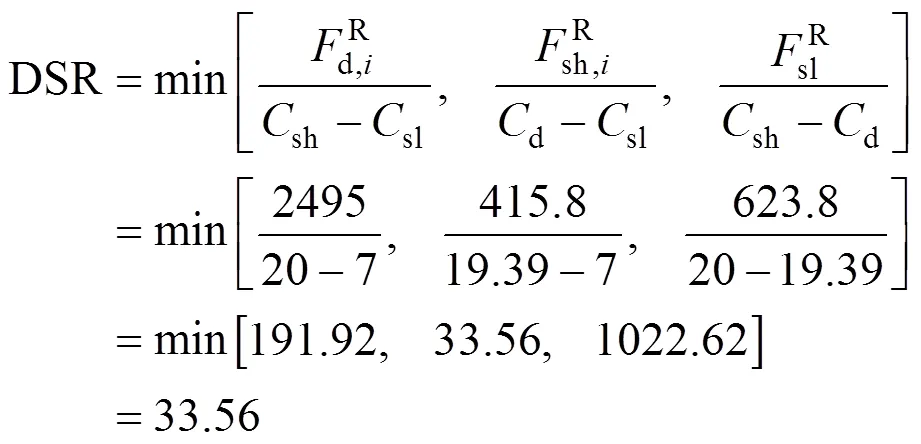
Thus the HCS, the source of 20%, which corresponds to the DSR, is the determining-stream.dandslcan be obtained from Eq. (11):
The results for Step (1) are listed in row 1 of Table 3. The determining-stream, the HCS in Step (1), is used up. Then the source stream of 25% will be the HCS for Step (2). For a non-determining-stream, its remainder amount in a step will be its factual amount for the next step. For example, the demand stream of 19.39% is a non-determining-stream. The remainder amount of the demand in Step (1) will be:
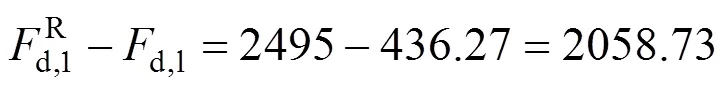
The amount of 2058.73 mol·s-1will be the factual amount of the demand in Step (2). Similarly, the factual amount of the LCS can be obtained.
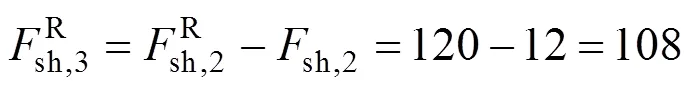
All the factual amounts of the demand, the HCS and the LCS are listed in row 2 for Step (2). Then the calculation for Step (2) can be started. For Step (2), the demand is 19.39%, and the HCS and LCS are the sources of 25% and 7%, respectively. The determining-stream for Step (2) corresponds to:
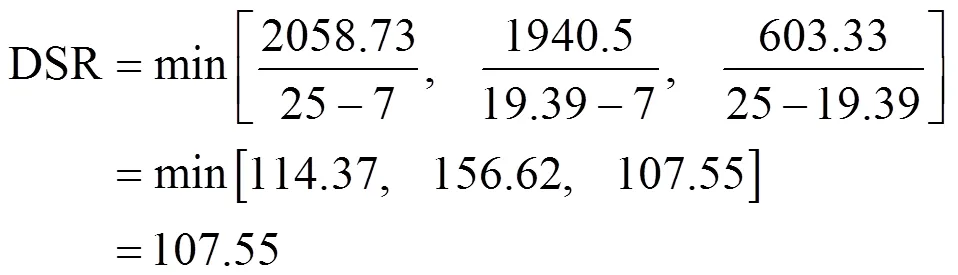
Then, the LCS, which corresponds to the DSR, is the determining-stream. Similar procedure can be carried out to calculate the amounts of the non-determining- streams and the amounts of the next step. The results are listed in row 2 of Table 3.
Now the LCS of 7% is used up. The LCS for Step (3) will be the 5% impure fresh resource, whose amount is much enough for the process. Therefore, the LCS will not be the determining-stream. The determining-stream will be either the demand stream or the HCS. The calculation procedure is the same as above. Table 3 lists the matched data and factual data of the demand, the HCS and LCS streams for this example. The determining-stream for each step is printed in bold in Table 3.
From the data in Table 3, it is found that the target (or the maximum cumulative amount) of the fresh resource of 5% will be:
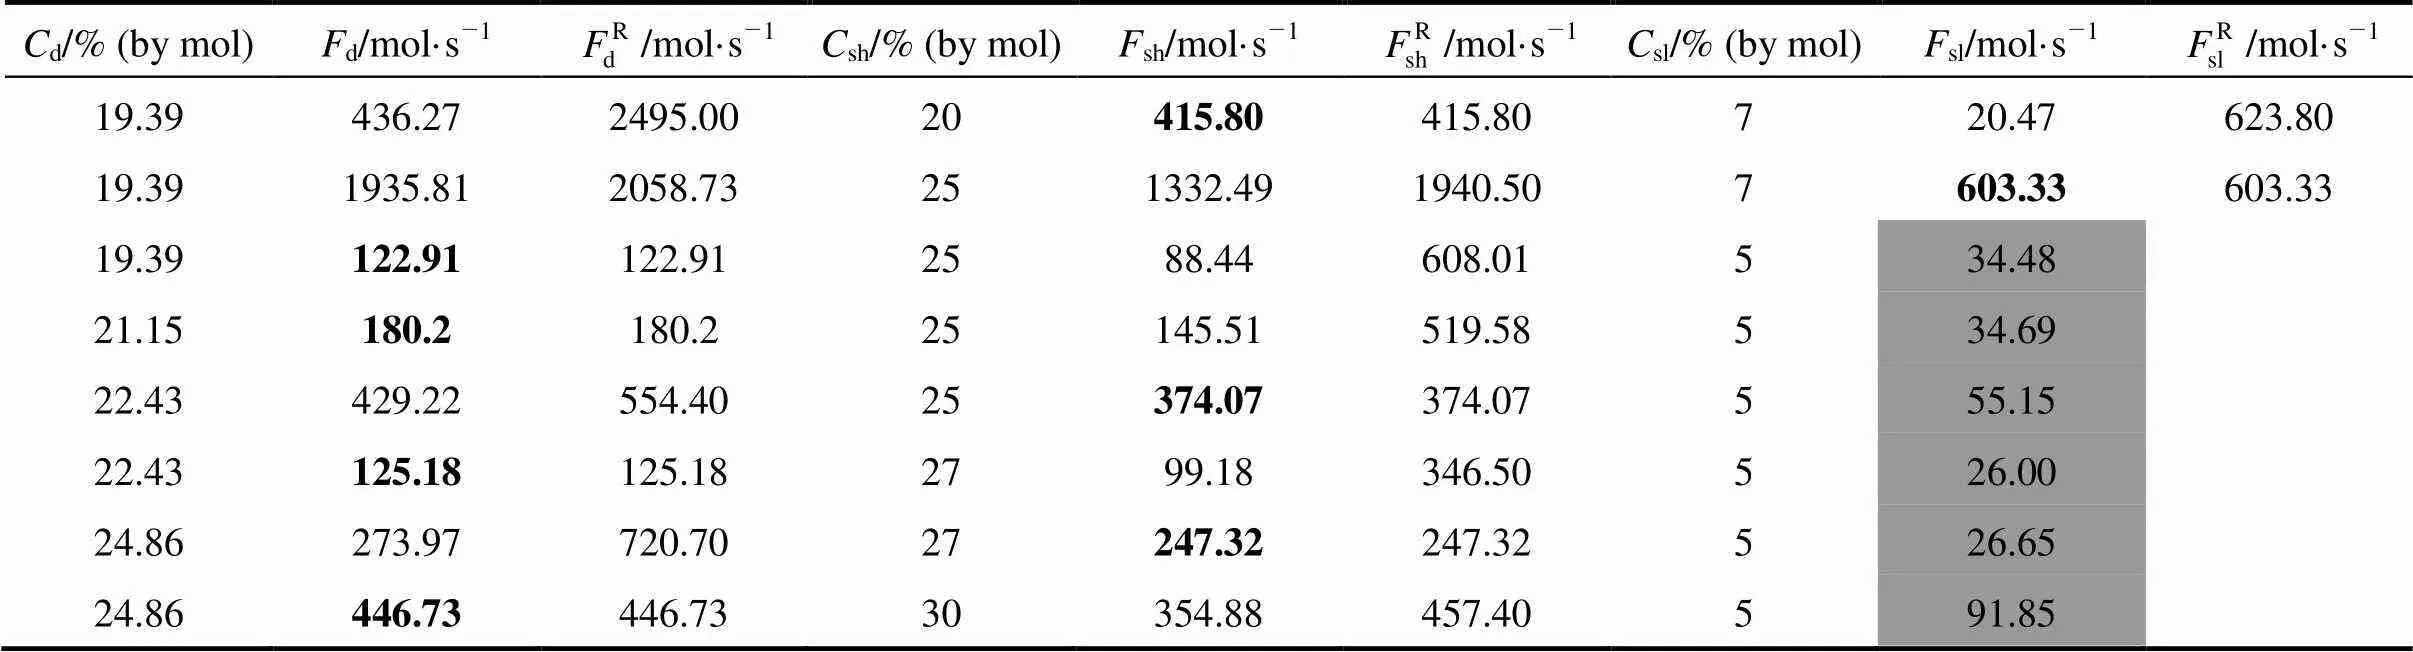
Table 3 The matched data of the demand, HCS and LCS streams for Example 1

Figure 1 The structural design for Example 1 (The values show flow rate in mol·s-1with contaminant mol percentage concentrations within braces)
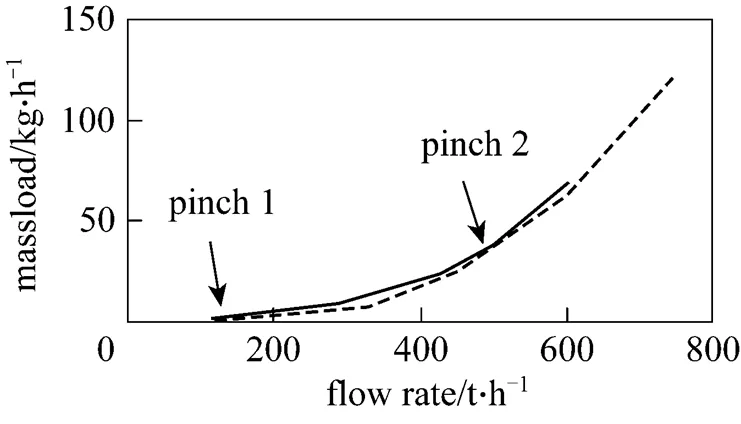
where the flow rates of the fresh resource streams included in the calculation are shadowed in Table 3. The result obtained is the same as that obtained by El-Halwagi. [3], Alves and Towler [12] and Shenoy and Bandyopadhyay [13]. A design obtained is shown in Fig. 1. Fig. 2 shows the shifted composite curves for this example. The detailed discussion about the composite curves can be found in the work of El-Halwagi[3].


3.2 Example 2
The data of Example 2 are shown in Table 4. There are two fresh resources with infinite amounts: a source of impure resource stream with concentration of 40 mg·L-1and a hundred-percent fresh resource stream.
From Table 4, it can be seen that the first demand stream only needs the pure resource. For the demand stream of 50 mg·L-1, its HCS and LCS are the sources of 150 mg·L-1and 30 mg·L-1, respectively. Here the internal source of 30 mg·L-1is used before the external source of 40 mg·L-1, because the internal one is cheaper than the external one as discussed earlier. DSR can be calculated from Eq. (10):
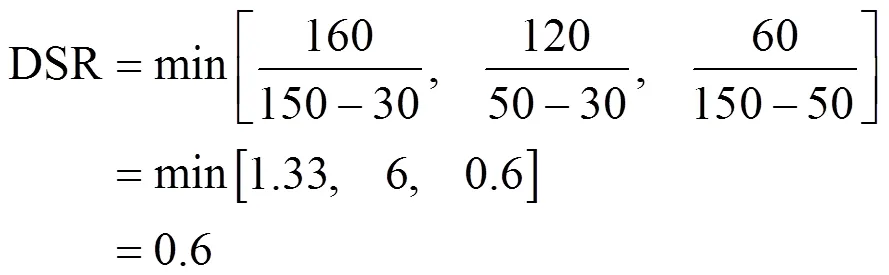
The LCS, the source of 30 mg·L-1corresponding to the DSR, is the determining-stream. The DSR value can be used to calculate the matched amounts of the other two streams:
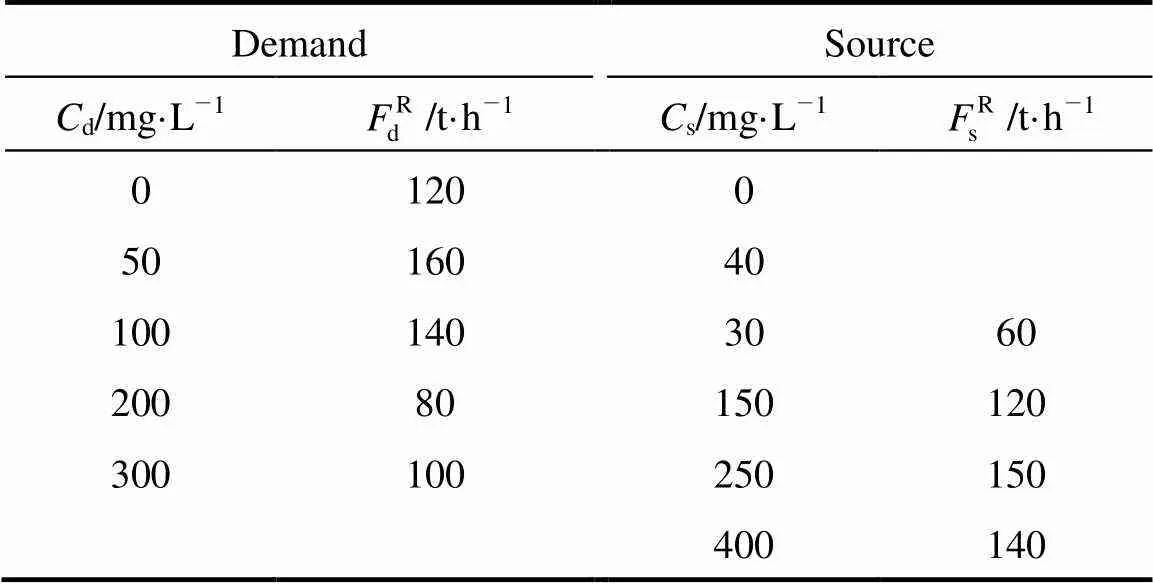
Table 4 Original data for Example 2
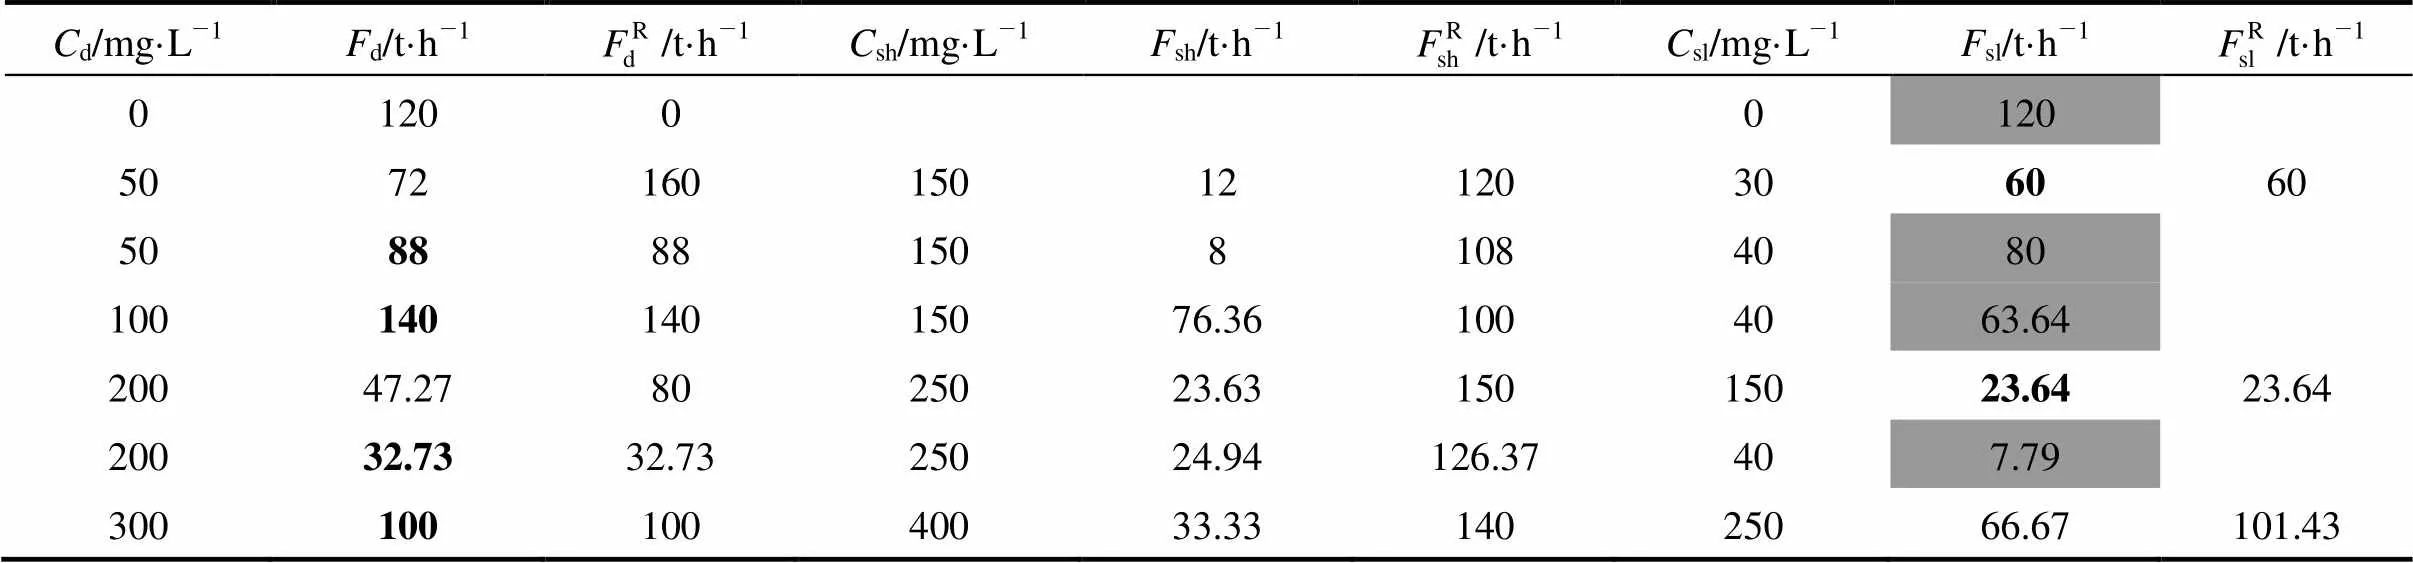
Table 5 The matched data of the demand, HCS and LCS streams for Example 2

Figure 3 The structural design for Example 2 (The values show flow rate in t·h-1with contaminant concentrations in mg·L-1within braces)


The LCS is used up, now. Then the LCS for the next step is the infinite source of 40 mg·L-1. As discussed above, the infinite source will not be the determining- stream. The remainders of the non-determining-streams are:

Similar procedures can be carried out for the following steps.

3.3 Example 3
This example has three external fresh resources: a resource of 100% purity with infinite amount, a resource of 30 mg·L-1impurity with flow rate of 50 t·h-1, and a resource of 25 mg·L-1impurity with infinite amount. Table 6 lists the original data for this example. Table 7 lists the generated data for this example.
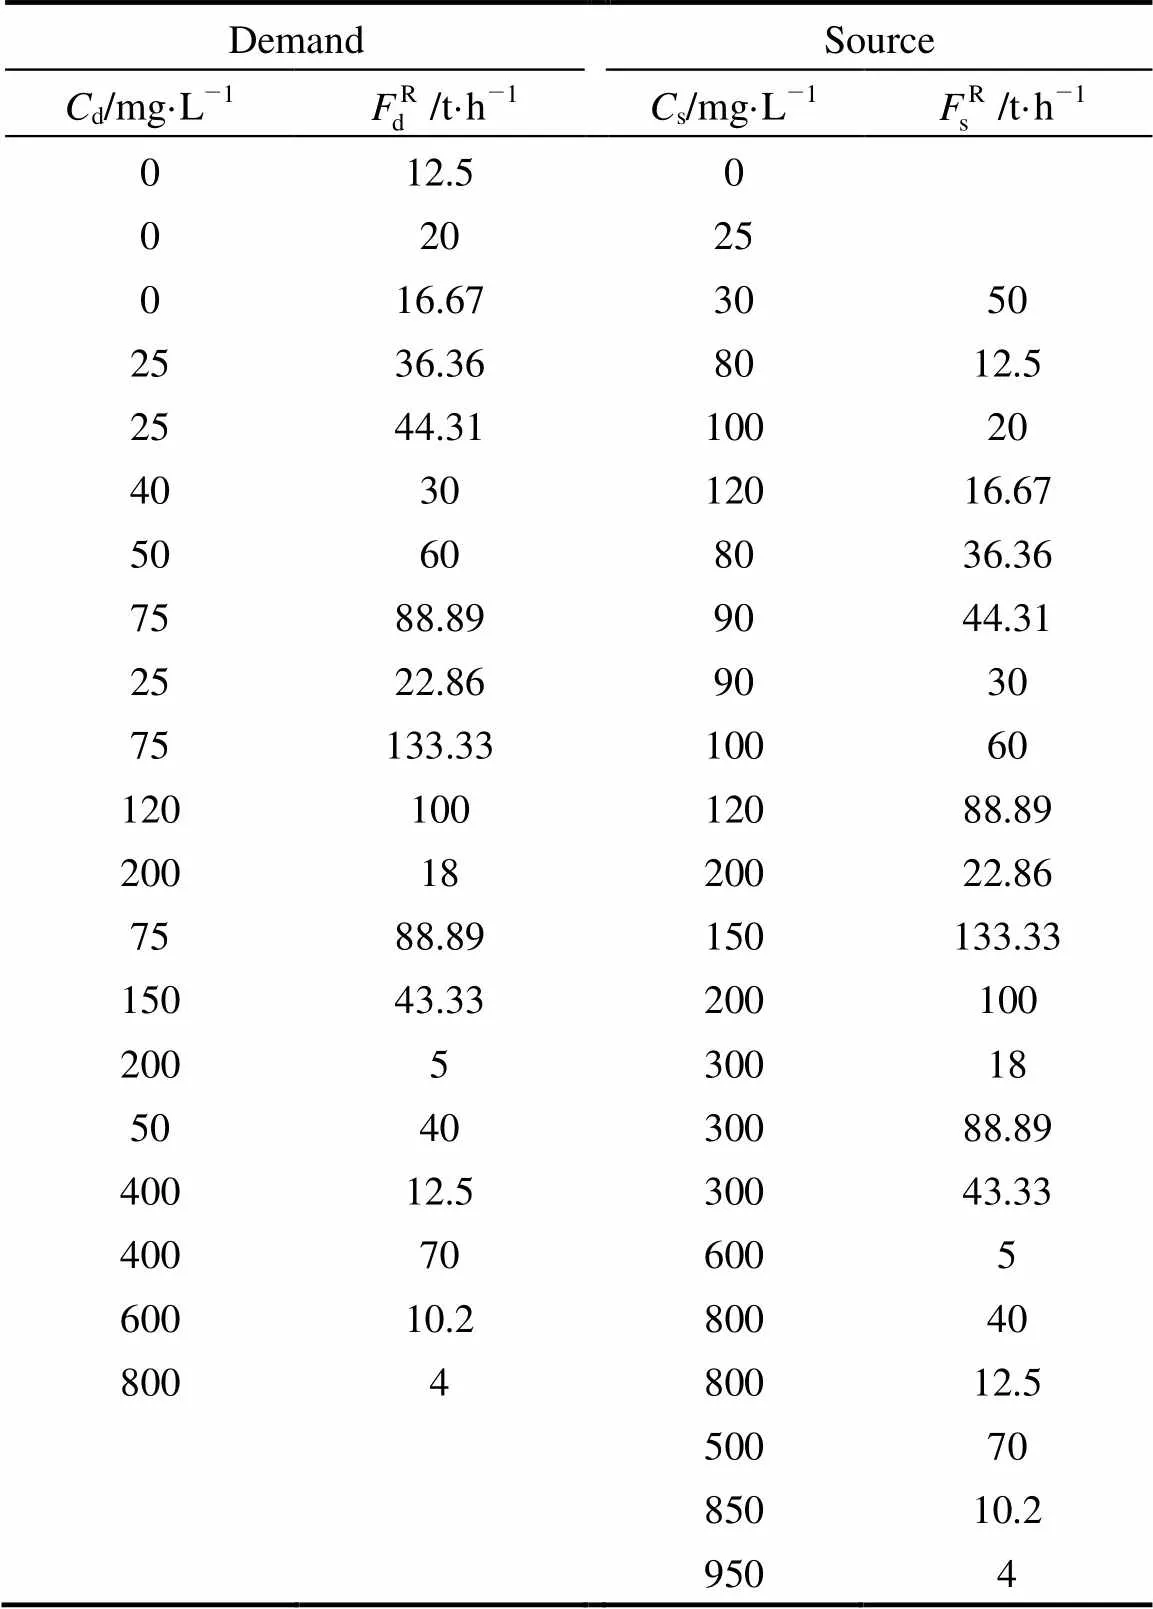
Table 6 Original data for Example 3

Table 7 Generated data for Example 3
In Table 7, the data of the demand and source streams are arranged in ascending order of their concentrations, respectively. From Table 7, it can be seen that the first demand stream needs hundred-percent fresh-resource only. For the demand stream of 25 mg·L-1, it can be satisfied by the external source of 25 mg·L-1. For the demand stream of 40 mg·L-1, its HCS and LCS are the sources of 80 mg·L-1and 30 mg·L-1, respectively. DSR can be calculated from Eq. (10):

Then the demand stream is the determining-stream. The amounts of the non-determining-streams can be calculated as follows:


The remainder amounts of the non-determining- streams of the source of 80 mg·L-1and 30 mg·L-1are:

In the next step, the HCS and LCS for the demand stream of 50 mg·L-1are the sources of 80 mg·L-1and 30 mg·L-1, respectively. Similar procedures can be carried out for this step.
Now as the external resource of 30 mg·L-1is used up, the LCS will be the infinite external resource of 25 mg·L-1. For the demand streams of 150 mg·L-1, 200 mg·L-1, 600 mg·L-1and 800 mg·L-1, they will be satisfied by the internal sources without using the external resource. Table 8 lists the matched data and factual data of the demand,the HCS and LCS streams. The determining-stream for each step is printed in bold in Table 8.

Table 8 The matched data of the demand, HCS and LCS streams for Example 3
From the data in Table 8, it can be seen that the concentration of the pinch-causing source for the 100% purity fresh resource is 0 mg·L-1, because the fresh resource is only used in Step (1). The pinch-causing source for the impure resource of 25 mg·L-1is 150 mg·L-1. The minimum fresh resource consumption target of the 100% purity fresh resource is 49.17 t·h-1, and that of the resource of 25 mg·L-1will be:

where the flow rates of the impure resource of 25 mg·L-1included in the target calculation are shadowed in Table 8.
Figure 5 shows the shifted composite curves for Example 3. A design of the network is shown in Fig. 6. For this example, the resources of 0 mg·L-1and 25 mg·L-1have their pinch points, because their amounts are infinite. The external source of 30 mg·L-1has no pinch point due to its limited amount. The concentration of the pinch-causing source of the resource of 0 mg·L-1is below 25 mg·L-1, the concentration of another infinite resource.

4 Discussion
From the illustrated examples, it can be seen that the procedure proposed can be used for design and targeting the resource networks with multiple resources effectively. Compared to the graphical methods [13, 14], the method proposed in this work is an numerical one. Compared to the method of numerical method of Foo [15], the method proposed in this work is much simpler because the water cascade analysis technique [4] is tedious, as pointed out by Foo[30]. For a network with multiple resources, there might be many different designs with the same resources consumption. The method proposed in this work can provide one of the designs. The approach proposed by Prakash and Shenoy [31] can be used to generate alternative designs from the design obtained.
5 Conclusions
In this paper, a new method is proposed to design the networks with multiple resources of different qualities. The pinch points and targets of the minimum consumptions of the resources can be determined simultaneously in the design procedure. Compared to the networks with single resource, the networks with multiple resources often have special features. For a network of single resource with single contaminant, there is often only one pinch point for the resource. On the other hand, for a network of multiple resources with single contaminant, there might be a few different pinch points. Each resource might have its own pinch point, if its amount is sufficient. The contaminant concentration of the pinch-causing source for a resource will be below that of the higher-concentration resource(s).
From the examples investigated, it can be seen that the design procedure proposed is easy to use. The other important issues in the networks, such as minimum piping, minimum total cost,., will be addressed in the future work.

Figure 6 The structural design for Example 3 (The values show flow rate in t·h-1with contaminant concentrations in mg·L-1within braces)
NOMENCLATURE
dconcentration of the demand stream
shconcentration of the HCS
slconcentration of the LCS
demand
d,imatched flow rate of the demand stream of step
sh,imatched flow rate of the HCS of step
sl,imatched flow rate of the LCS of step
resource
source
1 Wang, Y.P., Smith, R., “Wastewater minimization”,..., 49, 981-1006 (1994).
2 Hallale, N., “A new graphical targeting method for water minimization”,., 6, 377-390 (2002).
3 El-Halwagi, M.M., Gabriel, F., Harell, D., “Rigorous graphical targeting for resource conservationmaterial recycle/reuse networks”,...., 42, 4319-4328 (2003).
4 Manan, Z.A., Tan, Y.L., Foo, C.Y., “Targeting the minimum water flow rate using water cascade analysis technique”,., 50, 3169-3183 (2004).
5 Olesen, S.G., Polley, G.T., “A simple methodology for the design of water networks handling single contaminants”,., 75, 420-426 (1997).
6 Prakash, R., Shenoy, U., “Targeting and design of water networks for fixed flow rate and fixed contaminant load operations”,..., 60, 255-268 (2005).
7 Savelski, M., Bagajewicz, M., “Algorithmic procedure to design water utilization systems featuring a single contaminant in process plants”,..., 56, 1897-1911 (2001).
8 Liu, Z.Y., Yang, Y.Z., Zhang, Y., “Determining the pinch point qualitatively and calculating the targets of freshwater and wastewater numerically”,...., 85, 1485-1490 (2007).
9 Wang, Y.P., Smith, R., “Wastewater minimization with flow rate constraints”,, 73, 889-904 (1995).
10 Agrawal, V., Shenoy, U.V., “Unified conceptual approach to targeting and design of water and hydrogen networks”,., 52, 1071-1082 (2006).
11 Bai J., Feng X., “Analysis on the interaction of parameters of single-contaminant regeneration recycling water systems”,...., 16 (1), 21-25 (2008).
12 Alves, J.J., Towler, G.P., “Analysis of refinery hydrogen distribution systems”,...., 41, 5759-5769 (2002).
13 Shenoy, U.V., Bandyopadhyay, S., “Targeting for multiple resource”,...., 46, 3698-3708 (2007).
14 Alwi, S.R.W., Manan, Z.A., “Targeting multiple water utilities using composite curves”,...., 46, 5968-5976 (2007).
15 Foo, D.C.Y., “Water cascade analysis for single and multiple impure fresh water feed”,...., 85, 1169-1177 (2007).
16 Gomes, J.F.S., Queiroz, E.M., Pessoa, F.L.P., “Design procedure for water/wastewater minimization: Single contaminant”,..., 15, 474-485 (2007).
17 Almutlaq, A.M., El-Halwagi, M.M., “An algebraic targeting approach to resource conservationmaterial recycle/reuse”,...., 29, 4-18 (2007).
18 Alva-Argáez, A., Kokossis, A., Smith, R., “The design of water-using system in petroleum refining using a water-pinch decomposition”,..., 28, 33-46 (2007).
19 Alva-Argáez, A., Vallianatos, A., Kokossis, A., “A multi-contaminant transshipment model for mass-exchange networks and wastewater minimisation problems”,.., 23, 1439-1435 (1999).
20 Dhole, V.R., Ramchandani, N., Tainsh, R.A,. Wasilewski, M., “Make your process water pay for itself”,.., 96 (2), 47-52 (2000).
21 Doyle, S., Smith, R., “Targeting water reuse with multiple contaminants”,, 75, 181-189 (1997).
22 Liu, Z.Y., Yang, Y., Wan, L.Z., Wang, X., Hou, K.H., “A heuristic design procedure for water-using networks with multi-contaminant”,., 55, 374-382 (2009).
23 Liu, Z.Y., Zhang, Z.S., Hu, L.N., Wu, Z.L., “Wastewater minimisation using a heuristic procedure”,.., 2, A25 (2004).
24 Zheng, X., Feng, X., Shen, R., Seider, W.D., “Design of optimal water-using networks with internal water mains”,...., 45, 8413-8420 (2006).
25 Arwa, H.R., El-Halwagi, M.M., “Synthesis and scheduling of optimal batch water-recycle networks”,...., 16 (3), 474-479 (2008).
26 Liu, Y., Yuan, X.G., Luo, Y.Q., “Synthesis of water utilization system using concentration interval analysis method (I) Non-mass-transfer-based operation”,...., 15 (3), 361-368 (2007).
27 Liu, Y.Z., Duan, H.T., Feng, X., “The design of water-reusing network with a hybrid structure through mathematical programming”,...., 16 (1), 1-10 (2008).
28 Luo, Y.Q., Yuan, X.G., “Global optimization for the synthesis of integrated water systems with particle swarm optimization algorithm”,...., 16 (1), 11-15 (2008).
29 Feng, X., Bai, J., Zheng, X.S., “On the use of graphical method to determine the targets of single-contaminant regeneration recycling water systems”,..., 62, 2127-2138 (2007).
30 Foo, D.C.Y., Kazantzi, V., El-Halwagi, M.M., Manan, Z.A., “Surplus diagram and cascade analysis technique for targeting property-based material reuse network”,..., 61, 2626-2642 (2006).
31 Prakash, R., Shenoy, U.V., “Design and evolution of water networks by source shifts”,..., 60, 2089-2093 (2005).
2008-05-16,
2009-03-20.
the National Natural Science Foundation of China (20776036), the Research Foundation for Returned Scholars from Overseas of Human Resources Department of Hebei Province, the Natural Science Foundation of Hebei Province and the Soft-Science Research Projects of Hebei Province (08457253D).
** To whom correspondence should be addressed. E-mail: liuzhiyong@hebut.edu.cn
猜你喜欢
新疆艺术(2022年2期)2022-04-23
Chinese Physics B(2022年3期)2022-03-12
考试与评价·高一版(2021年3期)2021-08-14
应用数学(2020年1期)2020-01-10
陶瓷科学与艺术(2019年10期)2019-12-18
华人时刊(2017年15期)2017-10-16
初中生世界·七年级(2016年10期)2016-11-07
快乐作文·低年级(2016年7期)2016-09-22
兽医导刊(2015年5期)2016-01-04
长江大学学报(自科版)(2011年1期)2011-04-01
 Chinese Journal of Chemical Engineering2009年3期
- Chinese Journal of Chemical Engineering的其它文章
- On-line Monitoring for Phosphorus Removal Process and Bacterial Community in Sequencing Batch Reactor*
- Mechanism Study of Rice Straw Pyrolysis by Fourier Transform Infrared Technique*
- Modeling and Control of Nonlinear Discrete-time Systems Based on Compound Neural Networks*
- Effect of Doping Cerium in the Support of Catalyst Pd-Co/Cu-Co-Mn Mixed Oxides on the Oxidative Carbonylation of Phenol
- Biodegradation of Aniline by a Newly Isolated Delftia sp. XYJ6*
- Combination of Supercritical Fluid Extraction with Ultrasonic Extraction for Obtaining Sex Hormones and IGF-1 from Antler Velvet*