
空气系统引气对压气机性能影响的数值研究
2011-04-19 10:38李绍斌李秋实
赵 斌 李绍斌 李秋实 周 盛
(北京航空航天大学航空发动机气动热力科技重点实验室,北京,100191,中国)
INTRODUCTION
Air system is essential to the safe and reliable operation of aircraft engines.Air with proper pressure and temperature is used for cabin air conditioning,engine inlet anti-ice and cooling of high temperature components[1].Ref.[2]showed that the bleed air from the high pressure compressor took up 3%—5%of the main flow.Although the percentage is relatively small,the air coming from such an important part of the engine generates the great impact on the compressor performance[3-6].
During recent years,the aspirated technology is widely applied to the turbo-machinery for flow control,and offers a new approach to study the impact of air system bleeding on compressor performance. Refs.[7-9]improved the blade loaded by controlling the blade surface and the end-wall separation through the boundary layer suction.Ref.[10]performed a numerical simulation on a transonic fan rotor ATS-2 and proved that the boundary layer bleeding could greatly enhance the pressure ratio and efficiency.Ref.[11] showed that boundary layer bleeding was an effective solution for separation and stall of the cascade with large turning angles.It can be concluded from the previous studies that it is very likely to improve compressor performance by studying air system bleeding.
Current studies in this field mainly focus on how high temperature components make efficient use of mass flow in the air system for cooling, and analytical calculation on the loss along air system network.Very few of them touched on the influence of air bleeding on compressor performance.However,the air is bled from such an essential part of the engine and there must be continuous and enough air supply for the engine to run normally.Therefore,this paper tries to explore the impact of different bleeding rates and structures on the compressor totalpressure increase and stability margin.
1 ANALYSIS OF BLEEDING MECHANISMS
Air bleeding improves the compressor performance through removing the low-energy fluid from critical regions of blades and altering the incidence angle of blades.The former one has been widely used in the external and internal flow control since Prandtl′s boundary suction experiment in 1904.This section mainly analyzes how bleeding influences the blade incidence angle.
Fabri′s experiment summarized the features of bleed flow,as shown in Fig.1.The main upstream flow in the bleeding slot flows faster under the suction of bleeding; The main downstream flow slows down after the main flow decreases in air bleeding.In Fig.2,the air flows into the rotor in the axial direction with a velocity of V0.In the case that bleeding slot is located upstream of blade leading edge,the inlet axial velocity of blade increases to V1,the rotation speed U remains the same after bleeding,and the inlet flow angle Uis smaller.There is a smaller blade incidence angle when the stagger angle is constant. On the other hand,if the blade leading edge is located downstream of the bleeding slot,the inlet axial velocity of blade decreases to V2after bleeding and the blade incidence angle increases.The case is also applies to stators.Therefore,the influence mechanism of bleeding on the main flow can be concluded as:the blade incidence angle can be changed by altering the relative position of bleeding slot to the blade leading edge.

Fig.2 Influence on inlet air angle by axial velocity changes
For the transonic and subsonic compressor rotors,most of the blade passage losses result from the blockage caused by the interaction of tip leakage flow and end-wall boundary layer,and stall usually starts from the blade tips.When air is extracted from the rotor casing,the main flow rate upstream increases,and the incidence angle and blockage from tip clearance leakage can be reduced[12-13].The stator performance is mainly restrained by the blockage on the end-wall near suction surface[14-15].Bleeding in the stator end-wall area can increase the stator inlet flow rate,decrease the incidence angle,and remove the lowenergy fluid from the end-wall area.Blockage can be reduced by end-wall bleeding for stators.The analysis above indicates that the compressor performance is very likely to be improved by bleeding.For stators with large separation in the corner,how do end-wall bleeding location and rate influence the compressor performance?Is there an optimum value for bleeding location and rate? This paper takes the low-speed single-stage compressor in Beijing University of Aeronautics and Astronautics(BUAA)as the research object,and builds a stator flow field with large separation in the corner.Six air bleeding structures are presented,one of which is numerically studied under five bleeding rates.
2 NUMERICAL ANALYSIS PLAN
2.1 Low-speed single-stage compressor
The low-speed single-stage compressor in BUAAis used in this experiment.Its structure is shown in Fig.3.The design mass flow rate is 2.80 m3/s at a rotational speed of 3 000 r/min, thus providing a total pressure increase of 1 500 Pa.Details of the compressor geometry,the op-erating conditions,and the experimental data can be found in Ref.[16].Information on the compressor stage is listed in Table 1.

Fig.3 Schematic layout of test rig
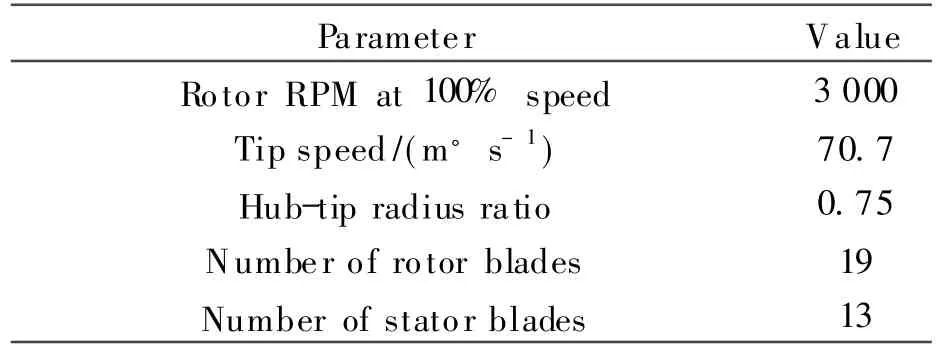
Table 1 Design performance of low speed axial compressor
2.2 Numerical model and reliability analysis
The experimental measurement sections at the inlet and outlet of compressor are selected for the calculation field boundary. The space discretization of the compressor mesh is generated by the pre-processing module AutoGrid5.The calculation is performed on a single rotor and stator passage.The total mesh point number is about 600 000.Simulations of the steady 3-D viscous flow field are carried out on the compressor by using the 3-D CFD package Numeca Fine Turbo.A cell-centered second-order finite volume discretisation is employed.The turbulence model is Spallart-Almaras.Perfect air is selected as working substance.In order to ensure the simulation accuracy,the simulation is amended by low Mach number flow.The atmospheric pressure and the temperature ofexperimental environments are 102 510 Pa and 285.15 K,respectively,held as inlet boundary condition.Concerning the radial equilibrium equation,the static pressure at the mean radius is held as outlet boundary condition. During the simulation,the main operating point of the compressor characteristic curves is obtained by changing the static pressure at the outlet.
The definition of numerical stall point in this paper is basically the same as that in Refs.[17-18].When the back pressure increases in the compressor outlet to obtain near stall characteristics,even by 0.01% of the inlet total pressure, the mass flow rate,the pressure ratio and the efficiency of compressor keep on decreasing with the number of iterations increasing,and numerical calculation cannot converge.Therefore,it can be concluded that the calculation is divergent.So the last convergence solution before divergence corresponds to the near-stall condition. The Surge Margin calculation formula is as follows
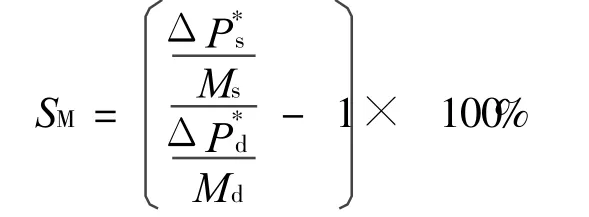
where SMis short forSurge Margin,Msand ΔPs*are the flow rate and the total pressure increase at the near-stall point,MdandΔPd*the flow rate and the total pressure increase at design point.
Fig.4 shows a comparison between the numerical simulation and the experimentally measured value over the 100% speedline of the lowspeed axial compressorcharacteristics without bleeding.In this paper,compressor characteristics of numerical calculations and experiment are conducted non-dimensionalized by a reference value:the abscissaOis the inlet flow coefficient Vx/ Um,and the ordinate jis the total pressure increase coefficient ΔP*/d Um2. On the design point,the simulation matches well with the experimental data of jwith a relativeerror of 1.2%. At the near-stall point,flow range in the simulation is smaller than the experimentally measured value because of the single passage steady simulation.Fig.5 shows the comparison of the radial distributions of total pressure increase at the outlet of the compressor between the simulation and the experimentally measured value on the design point(O=0.538).It is clear th at the simulation values agree well with the measured average values obtained from the four total pressure combs with circumferential averaged-distribution in the experiment.The above analysis shows that simulation calculation results are very close to the experimentlly measured results.In other words, the numerical calculation can approximatively reproduce the experimental results,and the numerical simulation is a reliable way to study the influence of bleeding on the compressor overall performance.
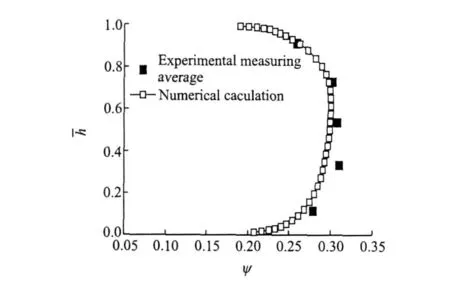
Fig.5 Radial distributions of total pressure increase on design point at outlet of compressor
2.3 Building and analysis of stators with large corner separation
The stall is induced by the leakage of the rotor blade tip of the compressor above.In order to study the influence of bleeding structure,location and rate on the stator corner separation,another compressor is needed where there is large separation in the near-stall stator corner.Therefore, based on the reliability of the numerical method, a new compressor is built with large separation in the stator corner on the near-stall point.The ratio of rotors to stators is modified into 18∶ 12, and the stator inlet setting angle is cut by 2°.The new compressor is used as the baseline,upon which all numerical studies below are conducted.
Fig.6 shows the skin friction line on the blade suction surface of the baseline at near-stall point. There are serious separations on stator corners.On stator suction surface,two obvious separating lines roll up from boundary layer of the suction surface and grow into the shedding vortex,thus taking along a large number of low-energy fluid to the downstream.It aggravates the stator losses.The separation on the upper half of the stator starts from 15% of the chord,and the outlet separation covers up 40% to 100% of the stator radial range.It is a typical closed form of separation.In the lower half of the stator,there is obvious separation and the radial flow.Fig.7 shows that there is the contours of the total pressure increase coefficient at stator outlet,where SS means the suction surface and PS the pressure surface.The location and the trend of corner separation at stator suction surface match well with those shown in Fig.6.The separation in the upper half of the stator outlet covers about 35% of the pitch range in circumferential.

Fig.6 Skin friction line on stator suction surface of baseline approaching stall point
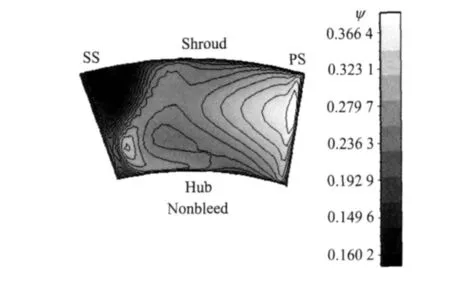
Fig.7 Stator exit total pressure increase coefficient contours of baseline approaching stall point
The complicated stator cornerseparations cause a huge increase in the loss.It is the most likely cause of the decrease in the compressor performance under the low flow rate condition.In this case,can these bleeding structures and rates effectively control the stator flow? And what influence does each plan have on the compressor performance?Answers are given in the comparative analysis on numerical calculation results of each bleeding plan below.
3 INFLUENCES OF BLEEDING STRUCTURES
3.1 Bleeding structure plans
Six air bleeding structure plans are presented in this paper according to the bleeding mechanisms above.In each plan,bleeding slots are located downstream of the leading edge of stator blades.Information on the plans is given in Table 2,and Fig.8 shows the structure of bleeding slots.In plans a and b,the bleeding slot is about 5% chord of stator and located at 10% and 20% chord from leading edge in the casing.The bleeding location in plan c is at the trailing edge in the casing,about 5% chord of stator.In plan d,the bleeding slot is rectangle-shaped,and located near the suction surface in the casing.The length is about 59% of the stator chord,and the width is about 15% of the stator chord.The bleeding location of plan e is at the stator suction surface near the hub.The air is bled out from the casing through the internal cavity of the stator.The plan f is basically a combination of plans d and e. It controls the flow in both the casing corner and the hub corner at the same time.From plan a to plan e,2.5% of the main flow is bled out.In plan f,1% of the main flow is bled from the casing and the blade suction surface.
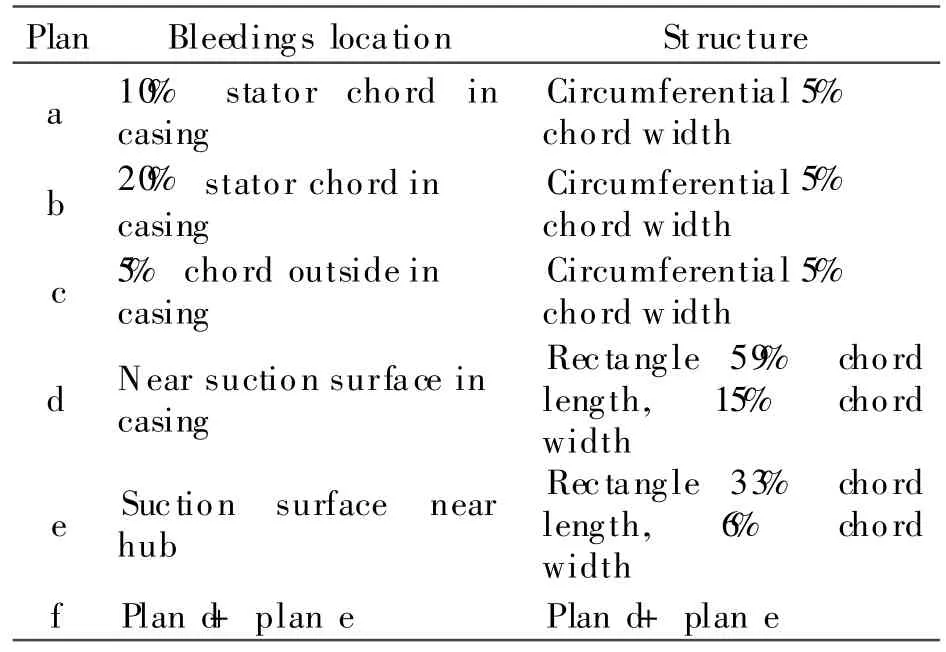
Table 2 Bleeding location plans
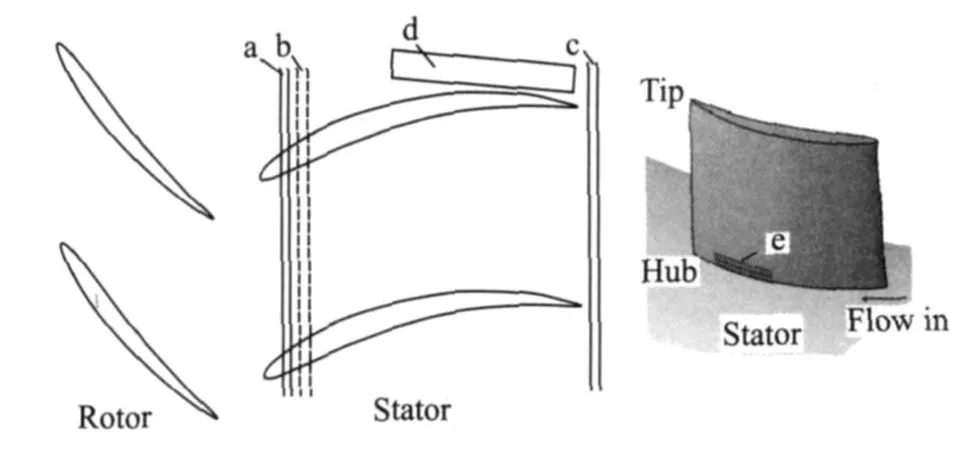
Fig.8 Structure of bleeding location plans
3.2 Influence on total pressure increase and surge margin
Figs.9,10 show the overall characteristics of total pressure increase in each bleeding plan.And Table 3 lists out different surge margins in each plan.The surge margin in the calculation of the baseline is 30.3%.It can be seen from Figs.9,10 and Table 3,only plan f manages to enhance both the total pressure increase and the surge margin, and improves the flow condition at the near-stall point.In this plan,the total pressure increase grows by 5.88% than the baseline,the mass flow range expands by 4.25%,and surge margin reaches 44.12%,which is a 45.47% increase on the baseline.In plans a and b,there is only the total pressure with a tiny increase.Two SMin both plans enhance very little,only by 2.52% and 4.06%,respectively.In plans c and d,the mass flow range is expanded at the cost of a reduction in the total pressure increase,but the surge margin decreases by 2.68% and 1.73% respectively.In plan e,the total pressure increase rises a little at near stall point,but the mass flow range decreases,so the relative surge margin reduces by 1.31%.
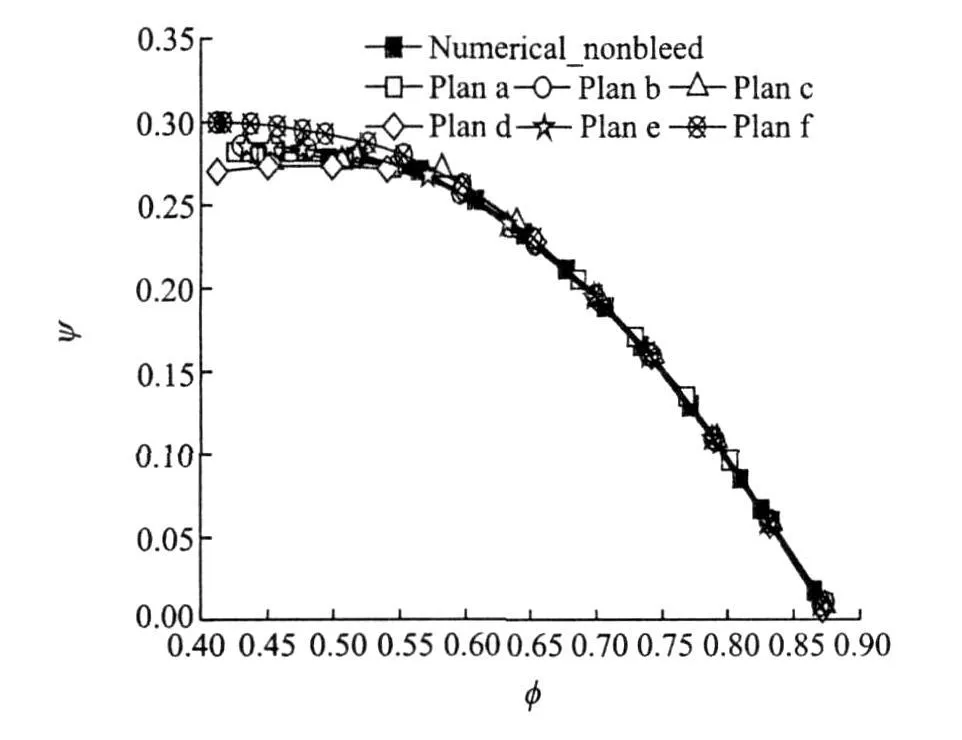
Fig.9 Performance of total pressure increase in each bleeding location plan

Fig.10 Performance of total pressure increase in plan f
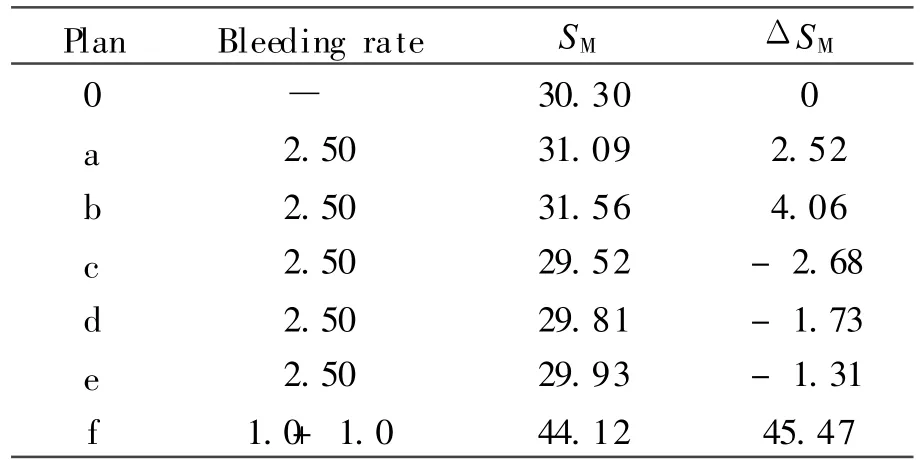
Table3 Relative increment of stability margin in each bleeding location plan %
3.3 Influence on stator flow field
Fig.11 shows the total pressure increase coefficient contours near stall(O=0.425)at stator outlet in each bleeding plan,where LE means the leading edge and TE the traling edge.In plan f, bleeding on the casing effectively removes a large number of low-energy fluid accumulation in the casing corner.Meanwhile,bleeding at the stator suction surface near hub eliminates the separation from the local small region,and effectively weakenes the radial flow caused by casing bleeding in the main flow.The stator flow obtains an overall improvement.The plans a and b both extract air at the entrance of stator leading edge.They reduce the incidence angle in the tip region,push back the starting location of the boundary layer separation near the casing,and reduce the large separation region on the stator casing in the radial and circumferential scale,but the large local separation of the casing still cannot be completely eliminated.In plans c and d,the large separation in the casing suction surface corner is completely removed,and the tip blockage is alleviated.However,the reduction of tip blockage and the suction effect cause the strong radial flow in the hub region.Under these influences,a large separation comes about in the suction surface corner near hub region.It indicates that there is an optimal value of bleeding rate to control the stator casing corner separation.The influence of bleeding rate on the main flow field is explored afterwards. The plan e only controls the flow in suction surface near hub region,and the large separation in the shroud corner still exists.
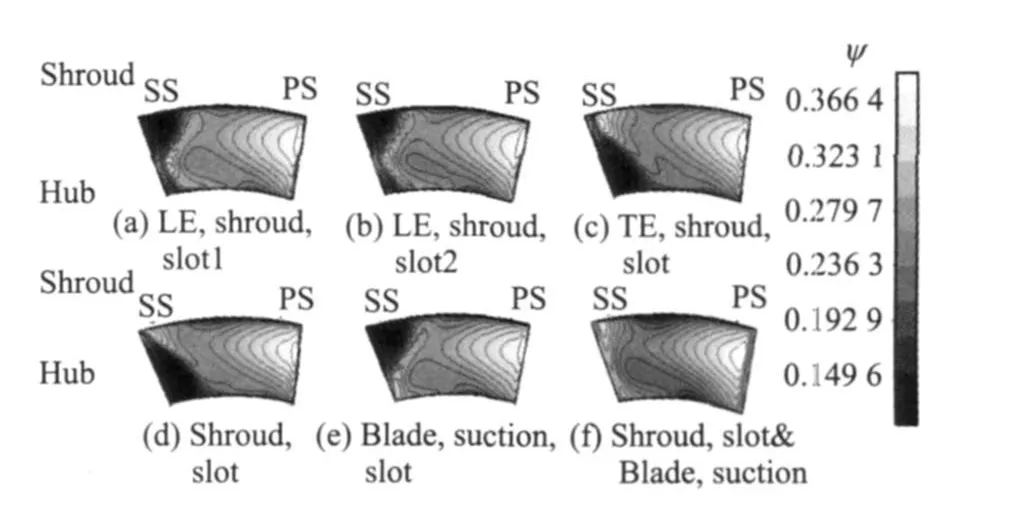
Fig.11 Stator exit total pressure increase coefficient contours near stall in each bleeding location plan

Fig.12 Radial distributions of stator total loss coefficient near stall in each bleeding location plan
Fig.12 shows the radial distribution of the near-stall statortotal loss coefficient in each plan.In the equation of the total loss coefficients of the stators,P*inand Pinare the inlet total pressure and the static pressure of the stators,P*outis the outlet total pressure.In plan f,it is apparent that there is a great reduction in the flow loss in the areas above 40% of the blade span,and the losses in the area below 20%of the blade span are under better control.The removal of the separation and the decrease in the loss greatly improves the stator flow.
It can be concluded that both flow mechanisms can effectively reduce the corner separation,and enhance the compressor performance. During the research,reducing the incidence angle alone cannot completely remove the large separation area near the casing.It only pushes back the starting location of the boundary layer separation on the tips near the casing and reduces the scale of separation. The compressorsurge margin hardly has any improvement. However,if the low-energy fluid in the critical area can be eliminated at the same time when the incidence angle is reduced,there is a better stator flow as the lowenergy fluid is removed and the separation is inhibited.The compressor has a comprehensive improvement in total pressure increase and surge margin.The research also indicates that too large bleeding rates bring about intensive radial flow, destruct the main flow,and increase the risk of large separation in hub region.In other words, there is an optimum value in the bleeding rate controlling the stator casing corner separation.
4 INFLUENCES OF BLEEDING RATES
There are different stator flow fields in plans d and f due to different bleeding rates in the analysis above.What are the similarities and dissimilarities in the stator flow field under different bleeding rates? What is the optimum bleeding rate?In order to explore the influence of different bleeding rates on the stator flow field and the performance,5 bleeding plans are presented with the same bleeding structure and location of plan d. These plans are referred to as d1—d5,and corresponding bleeding rates are 0.3%,0.6%,1%, 2% and 3%,respectively.
4.1 Influence on total pressure increase
Table 4 lists out the total pressure increase coefficient in each bleeding rate plan at the design point.In plan d1,the total pressure increase coefficient rises by 0.75% under a bleeding rate of 0.3%.The coefficient rises by 0.65% in plan d2 where the bleeding rate increases to 0.6%.In plan d3,the coefficient grows only by 0.15% while the bleeding rate reaches 1.0%.In plans d4 and d5,the coefficients decrease by 0.59% and 1.5% respectively when the bleeding rates keep increasing.In conclusion,there is increase in the coefficient when the bleeding rate is under 1.0%. The coefficient starts to decrease when the bleeding rate exceeds 1%.Therefore,there is an optimum value in the bleeding rates,and it is not the more the better.
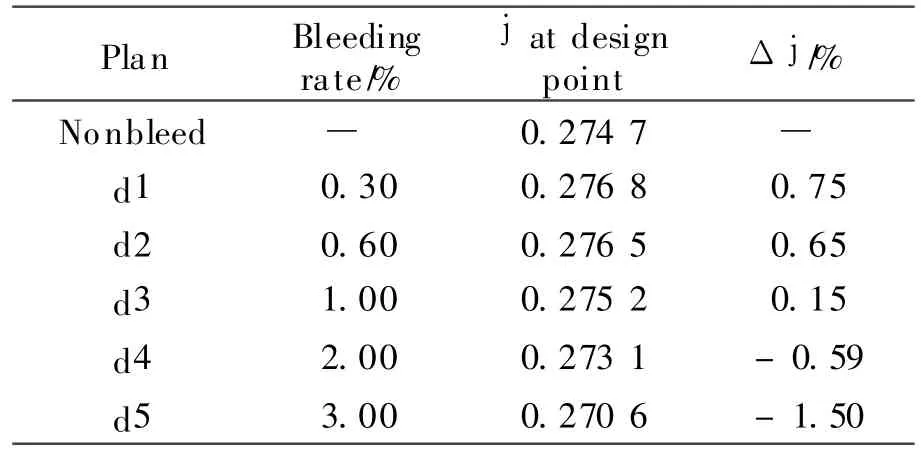
Table4 Relative value of total pressure increase coefficient in each bleeding rate plan at design point
4.2 Influence on stator flow field
Fig.13 presents the skin friction on the stator suction surface at the design point in each plan.Fig.14 shows the stator exit total pressure increase coefficient contours at the design point in each plan.With the bleeding rate increasing,the casing separation area starts to shrink along the radial and circumferential direction.The casing corner separation is under better control in plan d3.Its radial range is cut to 90% to 100% of the blade span,and the circumferential range also shrinks.However,the radial flow in the hub region starts to intensify and the separation area also expands when the bleeding rate grows.In plan d3,the radial range of the separation area increases to 60% of the blade span,compared to 20% of the blade span in the baseline.The circumferential influence covers up 20% of the pitch range.When the bleeding rates reach and exceed 1%,the casing corner separation gradually disappears,and the separation and the radial flow in the hub intensify.In plan d5,the casing separation completely disappears under the 3% of the bleeding rate,but larger hub separation appears and grows to 75% of the blade span.
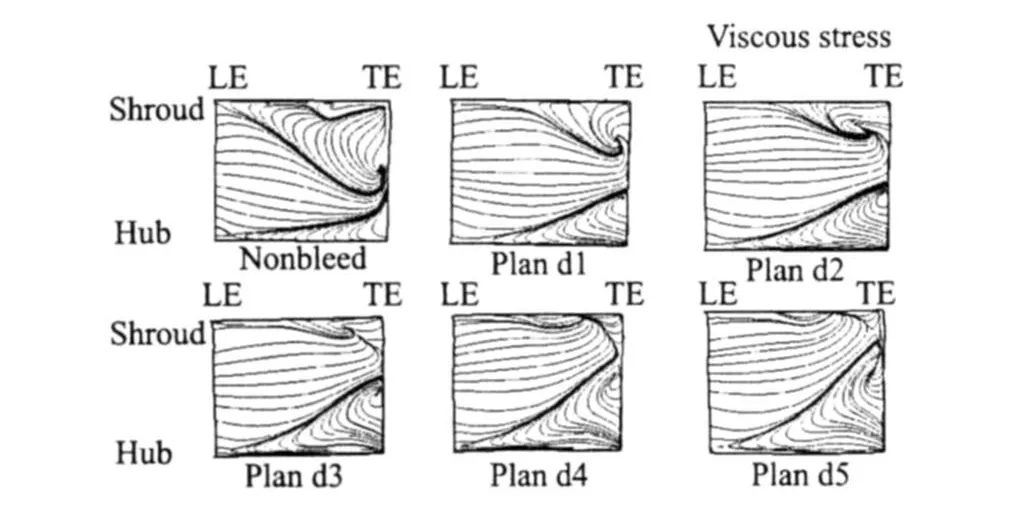
Fig.13 Skin friction on stator suction surface at design point in each plan
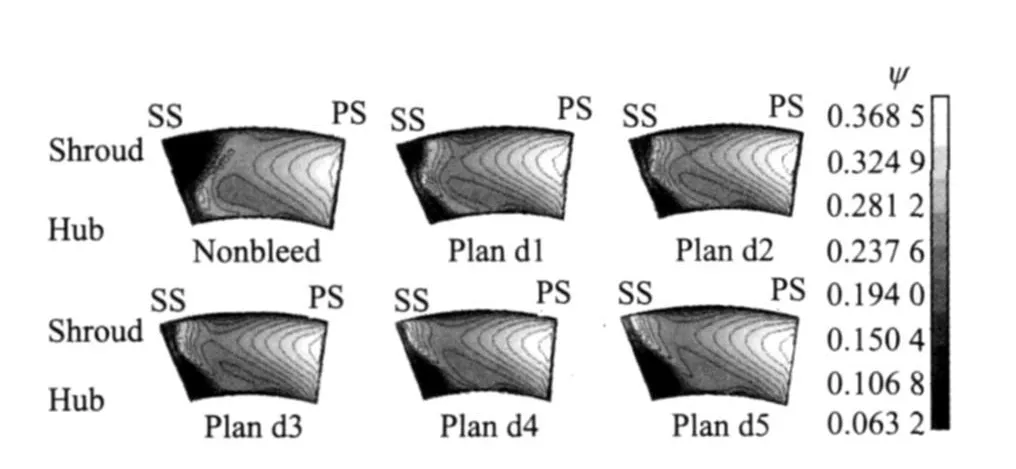
Fig.14 Stator exit total pressure increase coefficient contours at design point in each bleeding rate plan
Fig.15 shows the radial distributions of the stator total loss coefficient at the design point in each plan.The stator total loss coefficient in the upper half of the blade span apparently decreases with an increase in the casing bleeding rate.At the 90% of the blade span,the loss coefficient in plan d1 decreases to 0.1 from 0.3 in baseline. However,there is no significant decrease in the loss coefficient when the bleeding rate continues to grow.The loss coefficient in the lower half of the blade span increase together with the bleeding rates.The bleeding rate influences the stator total loss coefficient in the same way that stator flow field changes as shown in Figs.13,14.They both reflect how bleeding rate influences the stator flow field,and explain why the total pressure increase changes on the design points of each plan.
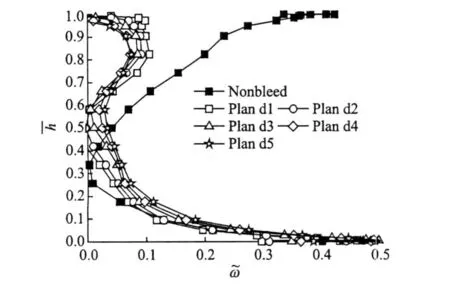
Fig.15 Radial distributions of stator total loss coefficient at design point in each bleeding rate plan
In conclusion, too much bleeding brings about intensive radial flow when removing the local separation.Furthermore,when there is large incidence angle in stators or separationin hub corner,large bleeding rates in the casing corner destroy the main flow and cause an even larger hub separation.Therefore,there is an optimum value in the bleeding rate controlling the stator casing corner separation.The value depends on the flow of the stator flow field.
5 CONCLUSIONS
(1)In both mechanisms about how bleeding improves the compressor performance,the elimination of low-energy fluid by bleeding plays a dominant role.The influence of bleeding on the blades incidence angle can determine the location of bleeding device.The compressor has a much better performance if both mechanisms are taken into consideration during design.
(2)A joint bleeding structure plan bleeds 1% of the air from both the stator casing near suction side and the stator suction surface near the hub region.This plan succeeds in rising both the total pressure increase and the surge margin of compressor at the same time.Compared with the baseline condition,the total pressure increase rises by 5.88%, the flow range expands by 4.25% and the overall surge margin increases by 45.47%.
(3)There is an optimum value in the bleeding rate controlling the stator casing corner separation.Too much bleeding brings about intensive radial flow when removing the local separation. Furthermore,when there is the large incidence angle in stators or the separation in hub corner, large bleeding rates in the casing corner destroy the main flow and cause an even larger hub separation.
[1] Yang Yansheng,Wu Xiangyu,Lu Haiying,et al. Design manual of aircraft engine,16th volumes:Air systems and analysis of heat transfer[M].Beijing: Aviation Industry Press,2001:1-11.(in Chinese)
[2] Zhao Bin,Li Shaobin,Hou Anpin,et al.The research on air bleed of air system in aero-engine[C]// Academic ExchangingMeeting of 15th Turbomachinery Committee of Aviation Institute.China: CSAA,2009:190-198.(in Chinese)
[3] Andrew JY,Ronald J R.Effects of bleed air extraction on thrust level of the F404-GE-400 turbofan engine[R].NASA TM-104247,1992.
[4] Alison B E.The effects of compressor seventh-stage bleed air extraction on performance of the F100-PW-220 afterburning turbofan engine[R].N ASA CR-179447,1991.
[5] Wellborn S R,Michael L K.Bleed flow interactions with an axial-flow compressor powerstream[R]. AIAA Paper 2002-4057,2002.
[6] Kerrcbroek J L,Reijnan D P,Ziminsky W S,et al. Aspirated compressors[R].ASM E Paper,GT-97-525,1997.
[7] Merchant A A,Drela M,Kerrebrock J L,et al. Aerodynamic design and analysis of a high pressure ratio aspirated compressor stage[R].ASM E Paper, GT-2000-619,2000.
[8] Zhou Hai,Li Qiushi,Lu Yajun.Prospects of numerical analysis of an aspirated transonic fan rotor [J].Journal of Aerospace Power,2004,19(3):408-412.(in Chinese)
[9] Wang Songtao,Qian Jiru,Feng Guotai,et al.The research about loss reduction and separation suppress by wall suction[J].Journal of Engineering Thermophysics,2006,27(1):48-50.(in Chinese)
[10]Conan F,Savarese S,Moteurs S.Bleed airflow CFD modeling in areodynamics simulations of jet engine compressors[R].ASM E Paper,GT-2001-0544, 2001.
[11]Saathoff H,Stark U.Tip clearance flow in a low speed compressor and cascade[C]//Fourth European Conference on Turbomachinery.Firenze,Italy:[s. n.],2001:81-91.
[12]Gummer V,Swoboda M,Goller M,et al.The impact of rotor tip sweep on the three-dimensional flow in a highly-loaded single stage low-speed axial compressor— Part1:design and numerical analysis[C]// Fifth European Conference on Turbomachinery. Prague,Czech Republic:[s.n.],2003.
[13]Zhao Bin,Li Shaobin,Li Qiushi,et al.Unsteady numerical research into the impact of bleeding on axialcompressorperformance[C]//Proceeding of ASME2010 3rd Joint US-European Fluids Engineering Summer Meeting.Montreal,Canada: [s.n.], 2010:FEDSM-ICNMM2010-30228.
[14]Joslyn H D,Dring R P. Axial compressor stator aerodynamics[J].ASM E Journal of Heat Transfer, 1985(107):485-493.
[15]Kang S,Hirsch C.Three dimensional flow in a linear compressor cascade at design condition[R]. ASME Paper,GT91-114,1991.
[16]Li Zhiping,Li Qiushi,Yuan Wei,et al.The experimental research on a new method for extending the axial-compressors stallmargin[J]. Journalof Aerospace Power, 2006,21(3): 485-491.(in Chinese)
[17]Hall E J,Crook A J,Delancy R A.Aerodynamic analysis of compressor casing treatment with a3-D navier-stokes solver[R]. AIAA Paper 94-2796, 1994.
[18]Yang H,Nuernberger D,Nicke E A.Numerical investigation of casing treatment mechanisms with a conservative mix-cell approach[R].ASM E Paper, GT-2003-28483,2003.
猜你喜欢
北京航空航天大学学报(2022年8期)2022-08-31
北京航空航天大学学报(2022年5期)2022-06-06
建材发展导向(2022年6期)2022-04-18
燃气涡轮试验与研究(2021年4期)2022-01-18
煤气与热力(2021年10期)2021-12-02
北京航空航天大学学报(2021年4期)2021-11-24
北京航空航天大学学报(2021年9期)2021-11-02
航空发动机(2021年1期)2021-05-22
航空发动机(2020年3期)2020-07-24
中国宝玉石(2018年3期)2018-07-09
 Transactions of Nanjing University of Aeronautics and Astronautics2011年1期
- Transactions of Nanjing University of Aeronautics and Astronautics的其它文章
- 由火焰聚心和激波聚焦诱导的爆震波研究
- 高温下IC10合金的动态再结晶特性研究
- 纤维失效对陶瓷基复合材料准静态加卸载迟滞回线的影响
- 一种控制微涡轮叶尖泄漏流的新技术
- 正交铺设陶瓷基复合材料基体裂纹演化研究
- 内乘波式进气道与内型侧压式进气道性能分析