
基于因果图的微小型涡喷发动机安全性分析
2011-05-05 22:55水汀鲍梦瑶
水汀 鲍梦瑶
(北京航空航天大学能源与动力工程学院,北京,100191,中国)
INTRODUCTION
Recent studies of micro turbojetengines draw increasing interests due to their tiny designed sizes and special purposes.However,the study in this field is not trivial because of the consideration in the design step of extreme high rotating speed and small body size requirements.Furthermore,the complex working environment causes quite a few issues,such as shorter life cycle,difficulty in maintenance,as well as high cost for the damage.Since applications for the micro turbojet engines are extended,the difficulties in the structural design,the failure modes and the connections among these failure modes increase a lot,which require more considerations in the design and manufacture process.All of these lead to a more detailed study requirement of safety analysis of aero engines.In addition,there is no study approach is generated for the use in micro turbojet engines while most of the current methods are generated for the usual jet engines.For the reasons mentioned above,the lacking in complete understanding in this area drives more attention and research in the safety analysis of micro turbojet engines[1-2].
T he safety analyses of civil aerospace system and equipments are described in Ref.[3].Based on this reference,the traditional methods such as FTA,RBD and Markov,are not quite excellent fit into the micro turbojet engines and the main disadvantages are reviewed as below.Firstly,for the complex analytical cases,the CPU requirement for the calculation grows high and relations are still difficult to achieve.Moreover,for the coupling causes of the safety issues,the results might not be reliable enough.In addition,the relation consideration of time and conditional probabilities is neglected in these approaches.The causal diagram introduced in this paper is a loop directed graph,which introduces logic gates into the network and dynamic characteristics into topology.The results show that this diagram can give effective corrections for the disadvantages mentioned above.
T his paper presents an improved safety analysis approach based on the causality diagram,which is verified by test case,such as rupture or pentration of receiver of micro turbojet engine casing.With the description of the analytical pro-cess,the comparisons are also made with the results produced from the traditional FTA method.
1 HAZARD OF MICRO TURBOJET ENGINE
In this paper,a certain turbojet engine with a structure assembling integral guiding vanes and turbines as a whole component is researched as a case.T he vanes also serve as stator casing.T he structure sketch is shown in Fig.1.In the design process of components of micro turbojet engine turbine,turbine rotor is the key component for safety analysis which determines the failure mode″rupture or penetration″of turbojet engine casings(noncontainment).T his failure mode is one of the most hazardous failures,thus it should be eliminated during design process.T herefore,the safety analysis for turbine casing must be conducted.In the following sections, the causal graph theory for safety analysis is applied.
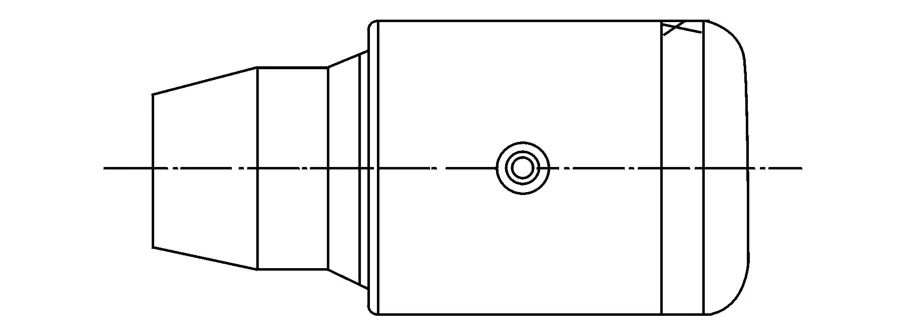
Fig.1 Structure of micro turbojet engine
2 CAUSALITY DIAGRAM THEORY
2.1 Basic concept of causality diagram theory
Firstly,the causality diagram[4-6]is based on the probability theory,which is a solid theoretical foundation including Boolean logic operation and has no restriction for network topology.Hence the causality diagram[2,4]can establish network according to actual situation.Secondly,the causality diagram introduces logic into network and implies straight causal level rather than conditional probability to avoid related issues at the given time.Thirdly,the causality diagram approach is also a kind of flexible deductive analysis,which obtains the causes from results and results from reasons,thus solving causes mixing problems[5-8].T herefore,for turbojet engines,this approach is consistent with the practical requirements of complex systems[9],and effectively simulates the actual failure modes.
2.2 Models of causal graph theory
In order to conduct the safety analysis for noncontainment of micro turbojet engine casings,a causality diagram for the″rupture or penetration of turbojet engine casings″is established and shown in Fig.2.According to the causal graphstructure,reasons for rupture orpenetration,their internal relations,and the correlations between failures are clearly illustrated.
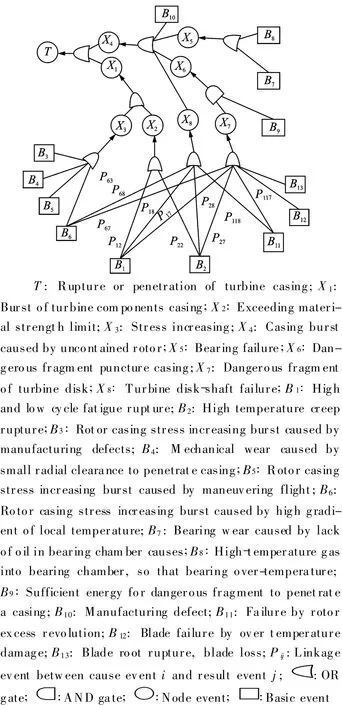
Fig.2 Causelity diagram of rupture or pentration of turbojet engine casings
2.3 Reasoning process in causality diagram
The calculation process in the causality diagram is divided into following four steps:
(1)Calculation of the first-order cut set expressions of node events.
Definition 1 The cut set Ciis defined as a set of events(including basic events Bi,node events Xi,logic events Gi,and linkage events Pij)combined with logic relation″AND″.T he relation between different cut sets is logic relation″OR″.T he cut set which is comprised merely by events adjacent to a certain node event is defined as the first-order cut set.
(2)Calculation of the final cut set expression of node events.
Definition 2 The cut set which is expressed merely by basic events and connected events is called the cut set of node events.
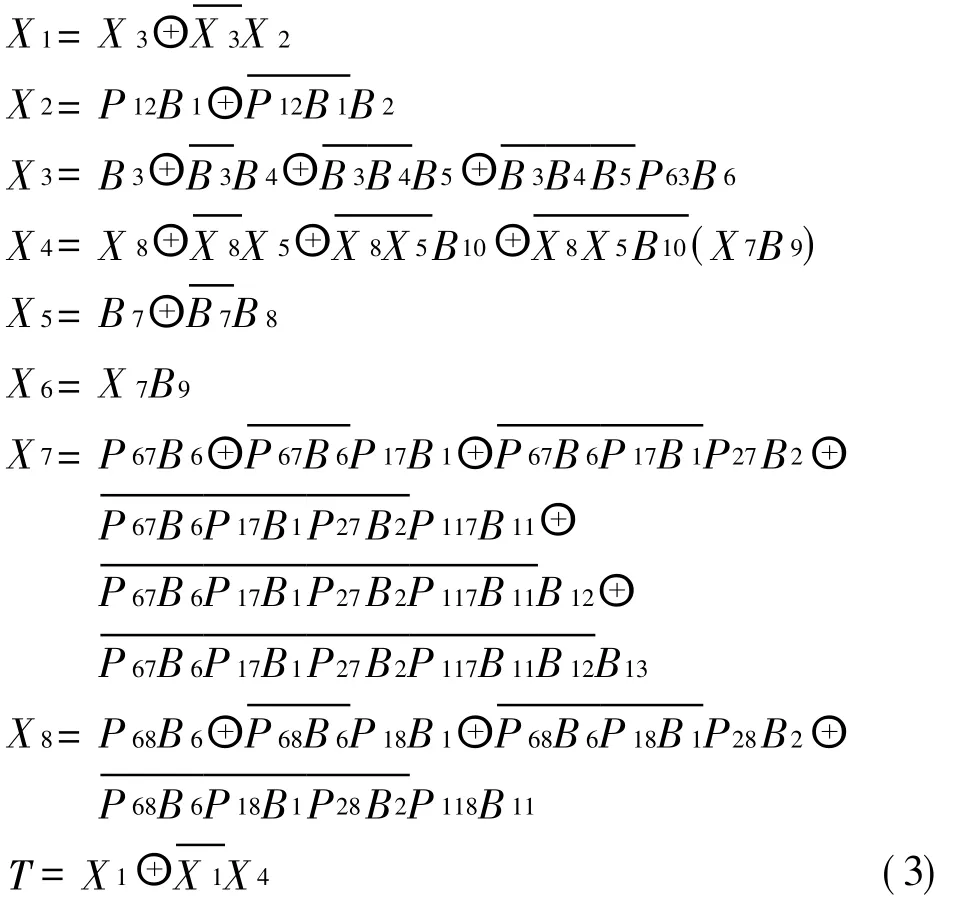
(3)Calculation of the nonintersect cut sets of node events.
(4)Calculation of the probability of top event P(T)and corresponding quantitative calculation.
2.4 Model calculations in causality diagram theory
As a kind of the equivalent expression of the causality diagram,causal trees(based on events or variables)can be used to calculate the occurrence probability of top events.T herefore,the causality diagram shown in Fig.2 can be simplified to the micro causal trees illustrated in Fig.3.Each node event(or variable)in the causality diagram corresponds to a micro causal tree.T he root of each micro causal tree is the corresponding node event(or variable).Essentially,for the causal trees,note events are roots,while the adjacent node events are input events.
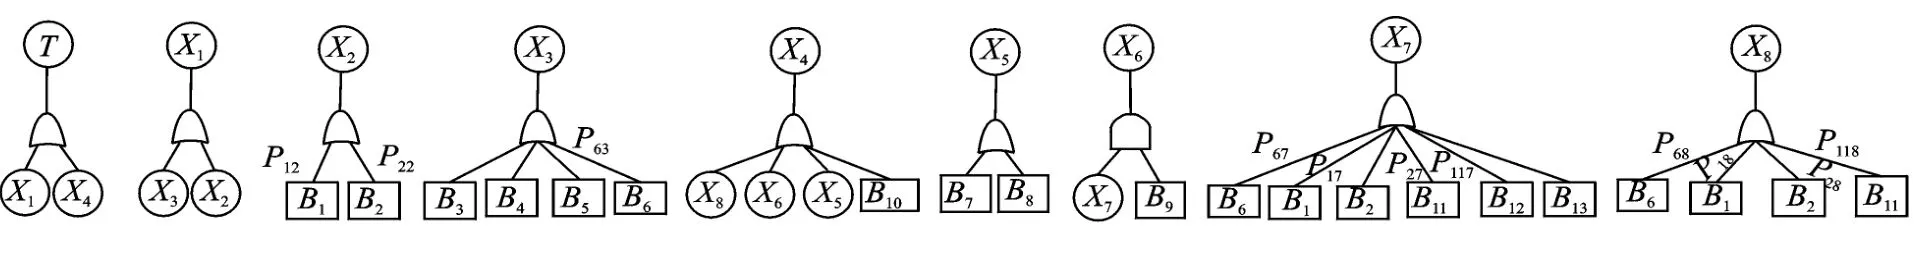
Fig.3 Micro causal trees
The whole causality diagram is shown in Fig.4 corresponding to the micro causal trees,from which the relationships among reasons of failures can be determined clearly.
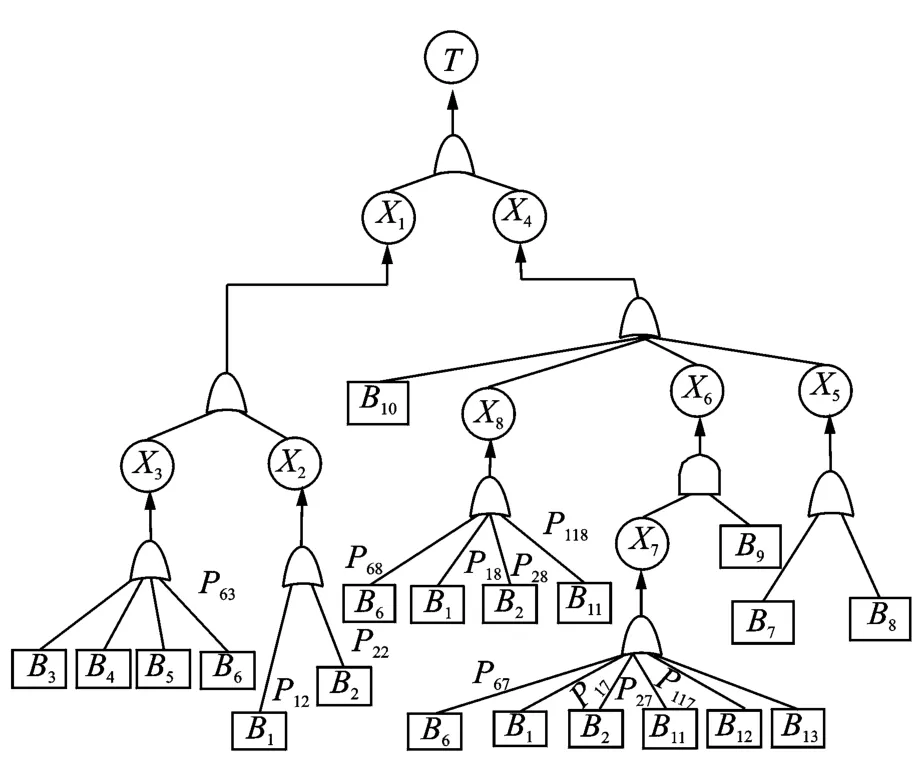
Fig.4 Whole causal tree
(1)Calculation of the first-order cut set of node events.
From the micro causal trees,the reasoning processes can be expressed as follows
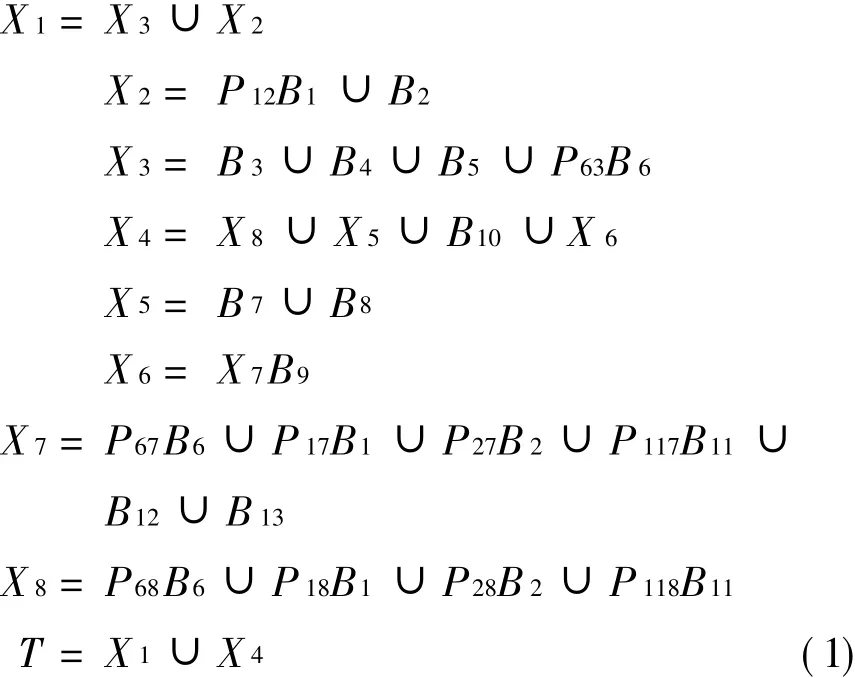
(2)Calculation of the final cut set of node event.

(3)Calculation of the nonintersect cut set of node events.
According to the first-order nonintersect cut set,the reasoning processes are given as follows
Using above simplifications,the ultimate expression of nonintersect cut set can be expressed by a matrix of nonintersect cut set.T his approach reduces the difficulty of deducting NP in the causality diagram and effectively improves the calculation speed of causality diagram.Therefore,it has great significance on the quantitative analysis of aero-engines.
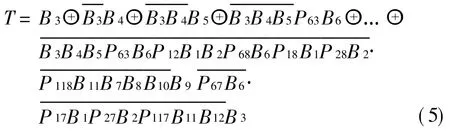
The nonintersect cut set matrix can be represented by the matrix aij(i=1,2,…,m;j=1,2,…,n),in which the value is-1,0 or 1,m=20,n=19.Each column in the matrix represents basic events or linkage events,while each row of the matrix represents a nonintersect cut set.If the cut set″m″contains the basic event″n″or the linkage event,then A(m,n)=1,if the cut set″m″contains the basic event″n″or the complementary event of linkage event,then A(m,n)=-1;In other case,A(m,n)=0.Respectively,aij(i=1;j=1,2,…,n)represent B3,B4,B5,P63B6,P12B1,B2,P68B6,P18B1,P28B2,P118B11,B7,B8,B10,B9,P67B6,P17B1,P27B2,P117B11,B12,B13.
T hen,the final nonintersect cut set matrix is
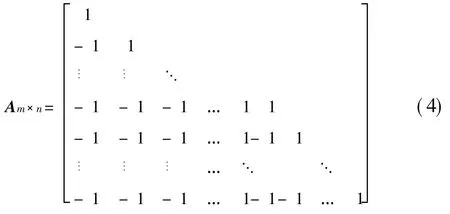
Finally,the expression of nonintersect cut set is
(4)Calculation of the occurrence probability of the top event and the importance of minimum cut sets.
T aking the engine componentdesign index[2,10]and corresponding experimental data as references,according to the occurrence probability of basic events and linkage events in T able 1,the occurrence probability of the top event is P(T)=0.020 17.
Acording to the experimental data,the realtop event is 0.020 2,thus the difference of probability between the causality diagram result and the experiment result is 3×10⁻⁵.
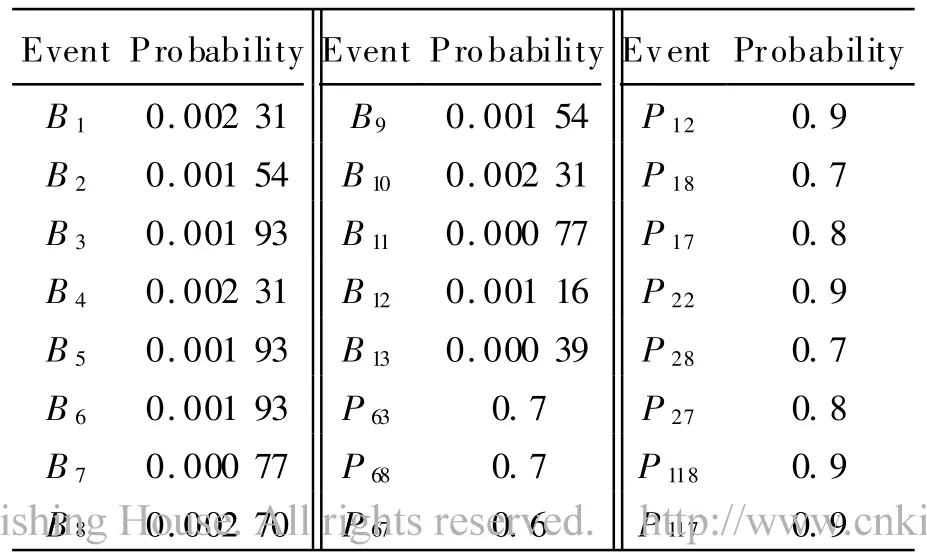
Table 1 Probability of basic events and linkage events
The minimum cut set refers to the least number of occurring failures and a set of the most necessary basic events.T herefore,discovering the minimum cut set is crucial to finding out reasons of failures.Acording to Eq.(5),the minimum cut sets triggering the top event are
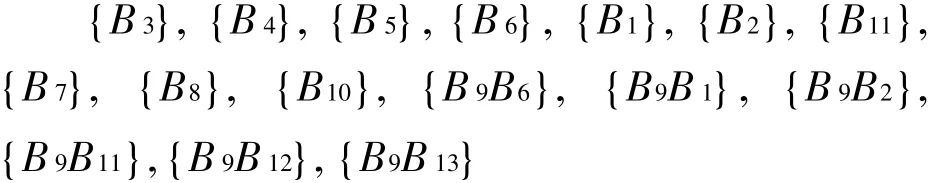
Among these 16 minimum cut sets,if one of them happens,then the top event happens.Because the minimum cut sets represent failure modes,the importance of minimum cut sets(IMCS),which is the importance level of the minimum cut sets,can represent impacts of each failure mode on the top event.
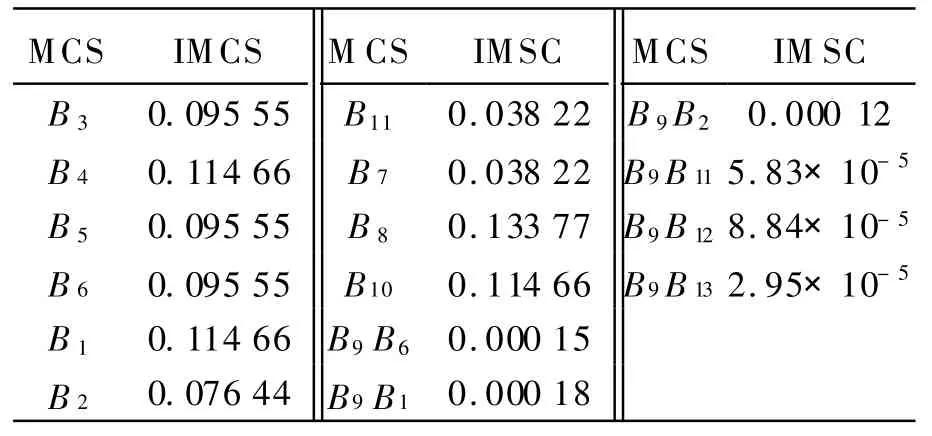
Table 2 Importance of minimum cut sets
According to the data analysis in Table 2,B8,B4,B1,and B10are the most significant failure modes for the top event.Thus they are the key factors.T herefore,following situations must be prevented and some promotion measures must be implemented to avoid these problems.
First of all,the hot gas ingested into bearing chamber must be prevented in order to avoid overheating problem of bearings(i.e.B8).In terms of micro turbojet engines,because of the short engine diameter,high rotor speed,heavy loadbearing of shafts,and limitation of shaft,the number of failures of shafts is large.The impact of hot gas on shafts can be prevented by reasonable design,such as installing cooling channel and heat shield at the hot part to cut off the influence of high temperature gas on the bearing.
T hen,mechanical friction,which is caused by small radical clearances,must be prevented(i.e.B4).In design process,the small clearances between blades,which lead to hydrodynamics excitation to rub damage of rotors and stators,must be avoided.In addition,during assembling process,nonconcentricity between rotors and case,imperfect alignment and high disturbance degree of rotors must be avoided.If the friction still exists,some experiments must be used to ensure that it cannot penetrate the casing.
Finally,high-low cycle fatigue rupture(i.e.B1)and manufacturing defects(i.e.B10)must be prevented.Because rotor speed and centrifugal effect are as high as(1.0—1.6)×106r/min,the stress concentration must be avoided.In addition,because working rotor speed is high and support stiffness of rotors has a great impact on the critical speed,appropriate support stiffness about(2.0—3.0)×107N/m is required.For micro turbojet engine,the dynamic balance of flexible rotor is required to reduce shake.
In addition,it is clear that B11,B12and B13 have few influences on the top event,thus they can be neglected.
In conclusion,the causality diagram can discover reasons of failures,obtain the minimum cut sets,and then achieve the goal of failure diagnosis.Meanwhile,the key to reduce probability of top event is reducing the occurrence probability of events at high importance level within the minimum cut set.Through analysis of related failures,correct methods must be implemented to eliminate potential risks and limit impacts within the minimum range.
3 COMPARE ANALYSIS
3.1 Result of fault tree analysis
Referring to Ref.[10],as shown in Fig.5,the occurrence probability of the top event isthus the difference between the result of fault tree and actual probability is 0.006 03≈6×10⁻³.
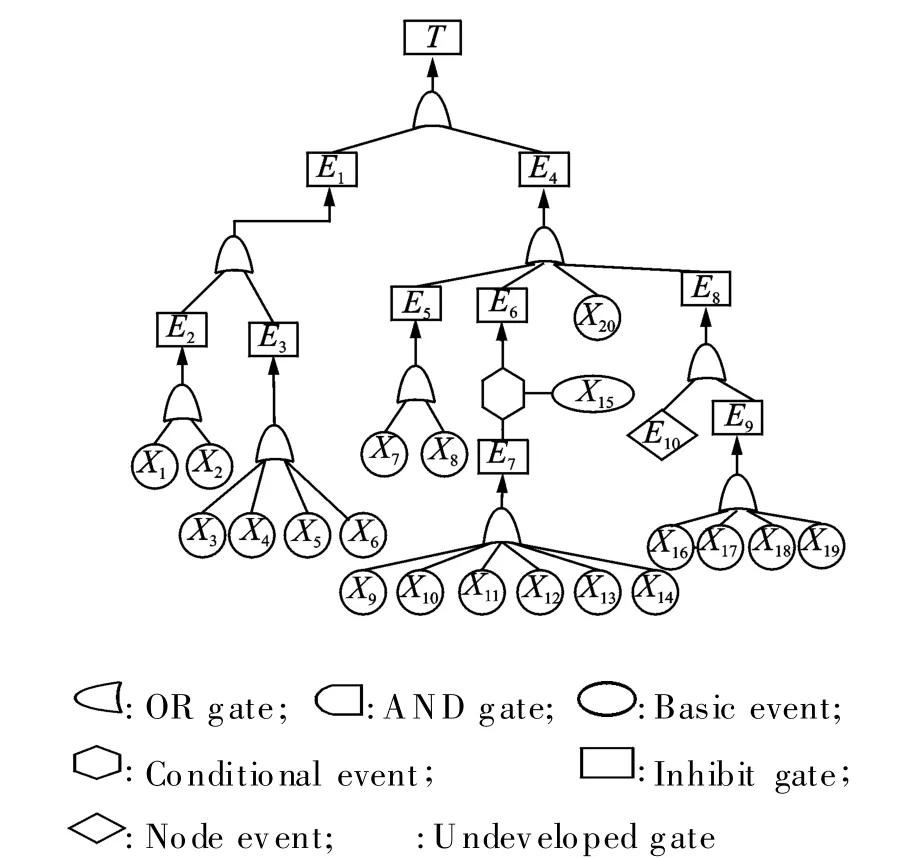
Fig.5 Fault trees
3.2 Variance analysis
Acording to the experimental data,the actual probability of the top event is 0.020 2.T he probability of failure occurrence produced by the causality diagram is 0.020 17.Compared with the FT A result 0.014 17,it is closer to the reality.
Through establishing the model of top event T and the method simplification,the reasons of difference between the causality diagram and fault tree can be figured out:As shown in Figs.2-5,the causality diagram overcomes the problems of correlation in nonindependence among the reasons of failures,lack of systemical and comprehensive consideration of failures,and lack of diagnosis information. Therefore, forthe high-precision complex system with more basic events and correlations,the matrix of nonintersect cut sets can improve calculation speed and reduce calculating amount.
The fault tree approach is based on the component connections and the analysis of failure modes. Itdecomposesreasonsofsystematic faults into middle events and basic events in order to obtain the quantitative index such as occurrence probability of top event if basic events are dependent and the occurrence probabilities are known.In the safety analysis of reasons for failures,because of the problem of correlation in nonindependence,it is incorrect to divide reasons into completely independent basic events in the decomposing process.However,the accurate results of fault tree analysis are seriously depended on the information completeness.Therefore,the application of the fault tree analysis has certain limitations and results in a larger error compared with the true value.
In addition, through the calculation of causality diagram and an investigation of difference with fault tree analysis,it is clear that the causality diagram can be used for failure diagnosis and identification of malfunction causes.It can calculate the occurrence probability of specified events of failure in order to carry out safety analysis and assessment.For the safety analysis of micro turbojet engines,compared with the fault tree analysis,the causality diagram is more suitable for actual system operations and failure conditions of complex systems of aero-engines,and can improve the failure diagnosis accuracy.
4 CONCLUSION
T he outcomes of this research demonstrate that:Initially,aiming to the characteristics of complex systems of micro turbojet engines,the application of causality diagram during process of safety analysis can successfully solve the issues of correlation in nonindependence and the lack of diagnosis information;Moreover,the implementation of nonintersect cut set matrix can excellently improve calculation speed and simplify calculation amount;Furthermore,compared with the fault tree analysis,the causality diagram is more effective for failure diagnosis,qualitative and quantitative safety analysis,identifying possible failure modes,and analyzing impacts of each events on the″rupture or penetration″failure;Finally,the causality diagram shortens development length and reduces potential risks.
T herefore,the causality diagram approach for safety analysis can satisfy practical requirements of high-precision complex systems of aeroengines.T here are two main advantages are concluded:(1)Quantitative analysis which is more reliable for the failure analysis in aero engines can be produced by the causality diagram analysis;(2)Graphical representation of causality diagram is easier to apply in real test cases and more effective for the safety assessment.
[1] Merrill W C,DeLaat J C,Abdelwahab M.Turbofan engine demonstration of sensor failure detection[J].Journal of Guidance,Control&Dynamics,1991,14(2):337-349.
[2] Kappas J.Review of risk and reliability methods for aircraft gas turbine engines[R].DST O-TR-1306,2002:1-53.
[3] ARP 4761.Guidelines and methods for conducting the safety assessment process on civil airborne systems and equipment[S].SAE,1996.
[4] Zhang Qin.Probabilistic reasoning based on dynamic causality tree/diagrams[J].Safety Engineering and System Safety,1994,46(6):209-220.
[5] Liang Xinyuan,Shi Qingxi,Zhang Qin.Application of causality diagram in system safety analysis[J].Journal of Chongqing University:English Edition,2005,4(3):158-163.
[6] Paska J,Oleksy A.Safety issues in power systems with DG[C]//Power and Energy Society General M eeting-Conversion and Delivery of Electrical Energy in the 21st Century.Pittsburgh:[s.n.],2008:1-7.
[7] Plattner H,Siemens A G.A new component concept for fault trees[C]//T he 8th Australian Workshop on Safety Critical Systems and Software.Canberra:Australian Computer Society,2003:33.
[8] Leveson N G,Dulac N.Safety risk-driven design in complex systems of systems[C]//The 1st Space Exploration Conference:Continuing the Voyage of Discovery.Florida:American Institute of Aeronautics and Astronautic,2005:AIAA2005-2558.
[9] Fan Xinghua,Sun Maosong.A reasoning algorithm of applying causality diagram to fault diagnosis of complex hybrid systems[C]//The 5th World Congress on Intelligent Control and Automation.Hangzhou,China:[s.n.],2004:1741-1745.
[10]Bao Mengyao,Zhou Yanpei,Ding Shuiting.Safety analysis on micro-turbojet engine for airworthiness[C]//T he 1st International Symposium on Aircraft Airworthiness.Beijing,China:[s.n.],2009.
猜你喜欢
中国机械工程(2022年22期)2022-11-25
北京航空航天大学学报(2022年8期)2022-08-31
北京航空航天大学学报(2022年5期)2022-06-06
中国机械工程(2022年7期)2022-04-20
北京航空航天大学学报(2021年4期)2021-11-24
中学生数理化·七年级数学人教版(2021年10期)2021-11-22
北京航空航天大学学报(2021年9期)2021-11-02
中国机械工程(2019年17期)2019-09-19
中国机械工程(2018年4期)2018-03-06
故事作文·高年级(2017年10期)2017-10-19
 Transactions of Nanjing University of Aeronautics and Astronautics2011年3期
- Transactions of Nanjing University of Aeronautics and Astronautics的其它文章
- 冷却润滑介质对钛合金Ti6Al4V加工性能的影响
- 温度变化下基于兰姆波的复合材料结构损伤识别
- 基于OPNET的低轨卫星的点波束确定算法
- 基于遗传EM 算法的航班延误状态空间模型
- 基于GIS的机场净空障碍物评定研究
- 基于多GPU的大型线性和非线性方程组的求解