
Turbulent Characteristic of Liquid Around a Chain of Bubbles in Non-Newtonian Fluid*
2012-03-22 10:08LIShaobai李少白MAYouguang马友光ZHUChunying朱春英FUTaotao付涛涛andLIHuaizhi李怀志StateKeyLaboratoryofChemicalEngineeringSchoolofChemicalEngineeringandTechnologyTianjinUniversityTianjin30007ChinaLaboratoryofReactionsandProcessEnginee
LI Shaobai (李少白), MA Youguang (马友光),**, ZHU Chunying (朱春英), FU Taotao (付涛涛)and LI Huaizhi (李怀志) State Key Laboratory of Chemical Engineering, School of Chemical Engineering and Technology, Tianjin Univer-sity, Tianjin 30007, China Laboratory of Reactions and Process Engineering, Nancy-Université, CNRS, , rue Grandville, BP 045, 5400 Nancy Cedex, France
1 INTRODUCTION
The turbulence induced by a chain of bubbles rising in a liquid is frequently encountered in many industrial processes such as chemical, mineral, food,and fermentation, which is known as a key factor for determining the efficiency of heat and mass transfer between two phases [1, 2]. Comprehensive understanding for the characteristic of fluid turbulence induced by a chain of bubbles is necessary for process optimization and design in multiphase systems.
Fluid turbulence induced by a bubble chain has been investigated for many years. The turbulence in gas-liquid two-phase flow was usually measured by single-point measuring techniques such as hot wire anemometer [3-5] or laser Doppler anemometer (LDA)[6-10]. However, turbulent behavior is fluctuating and sensitive to time-domain, so the full-field measurement techniques such as particle image velocimetry (PIV) is required to measure the full-field velocity distribution instantaneously [11]. PIV has been widely used to characterize the turbulence in gas-liquid two-phase flow in Newtonian fluids. For example, Panidis and Papailiou measured the distribution of kinetic energy of turbulence in gas-liquid flow system [12]. Muddeet al. investigated the distribution of turbulence around a chain of bubbles in 2D bubble column, and obtained the mean velocity field and Reynolds stress field [13]. Dominguez-Ontiveroset al. [14] and Ortiz-Villafuerte and Hassan [15] studied the effect of gas holdup on turbulence in gas-liquid two-phase flow, and evaluated the turbulent kinetic energy (TKE) and TKE dissipation rate, concluding that TKE was induced by large scale vortex while TKE dissipation rate was related to small scale vortex.Liuet al. [16] examined the distribution of turbulence intensity and Reynolds stress around a chain of bubbles rising in glycerol solutions with two-dimensional PIV. However, in comparison to Newtonian fluids, the flow fields in non-Newtonian fluids are dramatically different due to the inherently complex rheological property of non-Newtonian fluids [17]. In spite of many difficulties, some attempts were donated to the study of flow field structure and turbulent characteristic induced by bubbles rising in non-Newtonian fluids.Funfschilling and Li studied the flow field around bubble chain moving in glycerol, carboxymethylcellulose (CMC) solutions and polyacrylamide (PAA)solutions, and attributed the negative wake of bubble in PAA solutions to viscoelastic property of liquids[18]. Fanet al. studied the flow field surrounding two parallel moving bubbles rising in CMC solutions [19].Although the characteristic of turbulence induced by a chain of bubbles in non-Newtonian fluids is important for the enhancement of mass transfer, little information is available.
In this work, the characteristic of turbulence induced by a chain of bubbles rising in CMC solutions and glycerol are investigated experimentally. The influences of polymer concentration, gas flow rate and rheological property upon the turbulence are discussed.

Figure 1 Schematic of experimental apparatus and PIV system
2 EXPERIMENTAL
2.1 Apparatus
The schematic of the experimental apparatus is shown in Fig. 1. The principal part of apparatus was a rectangular Plexiglas column (15 cm × 15 cm × 170 cm).Nitrogen was injectedviaa nozzle (inner diameter of 1.0 mm) to the bottom of bubble column from a gas cylinder through valve and rotameter (within ± 0.01 cm3·s-1). The flow field was measured with a particle image velocimetry (PIV) (2D FlowMater, LaVision GmbH, Germany), comprised of four main parts: double pulsed Nd:YAG laser (532 nm wavelength), highresolution CCD camera (LaVision FlowMaster 3 system,image size 1376×1040 pixels) with Nikon lens and LaVision software (Flow Master 3). Red fluorescent polymer microspheres with a density of 1050 kg·m-3and mean diameter of 7 μm were seeded uniformly in the liquid. The beam from the laser passed through the sheet laser lens system and converted into film light(1-2 mm) for illuminating the observation field (80 mm×60 mm). The instantaneous flow of tracer particle was caught by CCD at a rate of 10 frames per second with the sampling time 4 s. Then the pictures were processed with computer. All experiments were carried out at room temperature.
2.2 Materials
Nitrogen served as gas phase, with density of 1.25 kg·m-3and viscosity of 1.7×10⁻⁵Pa·s. Two liquids with different rheological properties were employed,CMC solution (AR; molecular mass: 5×10⁶g·mol-1)and glycerol (AR; purity: 99.5%; viscosity: 1.4 Pa·s),both from Tianjin Kermel Chemical Reagent Co.,Tianjin, China. The mass concentrations of CMC solutions were 0.2%, 0.6%, and 1.0%. The gas flow rates were 0.2, 0.6, and 1.0 ml·s-1. The density of liquid was measured using a densitymeter (AntonPaar,DMA5000, Austria) with the accuracy of ±1.0%, and the surface tension was measured by a dynamic surface tension apparatus with the precision of ±1.0%(DCAT21, Dataphysics, Germany). The rheological properties of liquids were measured using a viscometer (Brookfield, DV-III, USA) with shear rates (γ˙)ranging from 0.1 to 100 s-1. Fig. 2 shows the change of apparent viscosity with shear rateγ˙. It also clearly shows that glycerol is a Newtonian fluid and CMC solutions are shear thinning fluid. The viscous curve of CMC solutions in the range of shear rates can be expressed by Carreau-Yasuda law [20]:whereμis the apparent viscosity,γ˙ is the shear rate,μ0is the zero-shear viscosity,λis the characteristic time of fluid, andsis the slope of the shear stress-shear rate curve in the shear-thinning region.The values ofμ0,λ, andsand physical properties of the above liquids are listed in Table 1.
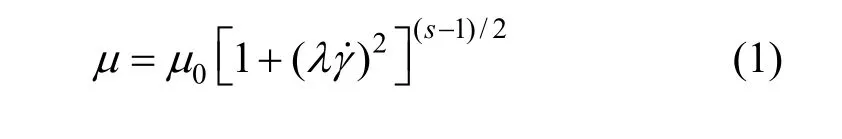

Figure 2 Rheological characterization of experimental fluids■ 0.2% CMD; ● 0.6% CMC; ▲ 1.0% CMC; ▼ 99.5% glycerol;Carreau model curve fit
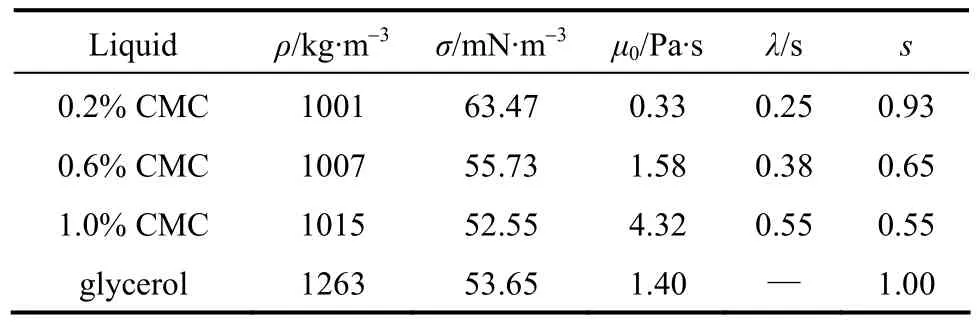
Table 1 Physical properties and rheological parameters of experimental fluids
3 RESULTS AND DISCUSSION
3.1 Flow field
The instantaneous flow fields around a chain of bubbles in different solutions observed by PIV are shown in Fig. 3 (coordinate 0y= represents that the distance of measurement position from nozzle is 700 mm). The instantaneous flow fields are similar under all experimental conditions: the rising bubble chain pushes the liquid to flow up in the center of bubble column and the liquid near the wall of bubble column flows downwards, which are also similar to the flow field caused by a single bubble rising in CMC solutions,as reported by Funfschilling and Li [18]. The measured flow fields clearly indicate that low liquid viscosity leads to high flow intensity under same gas flow rate.Because the viscosity of glycerol is higher than those of CMC solutions asγ>˙30 s-1, its flow intensity is the strongest. For CMC solutions, the higher the solution concentration, the higher the solution viscosity, so the weaker the flow intensity is. The bubble wake is enlarged when bubble becomes ellipsoidal owing to the decrease of viscosity of liquid.
3.2 Turbulent kinetic energy
With the liquid flow fields induced by bubble chain measured by applying PIV, the mean velocities are calculated by

whereuxanduyare mean velocity components,uxanduyare instantaneous velocity components, andnis the total number of frames. In this experiment,n=40.
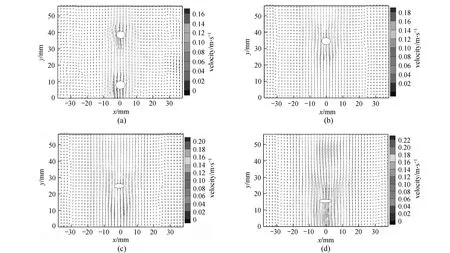
Figure 3 Flow field around bubble chain for glycerol (a), 1.0% CMC (b), 0.6% CMC (c), and 0.2% CMC (d) at Q=0.6 ml·s-1
According to the eddy theory, turbulence has multi-scale structure. Large-scale eddies get energy from mainstream and transfer the energy to small-scale eddies under the interaction of fluids [21]. Namely,TKE dissipation is generated mostly from small scale eddies, while TKE is created mainly from large-scale eddies. Based on the local energy balance, turbulence can be characterized by TKE and TKE dissipation rate (ε).
TKE can be calculated from the mean square of the turbulent fluctuation of the instantaneous liquid velocities:

where the radial, axial and tangential fluctuating velocities are given by
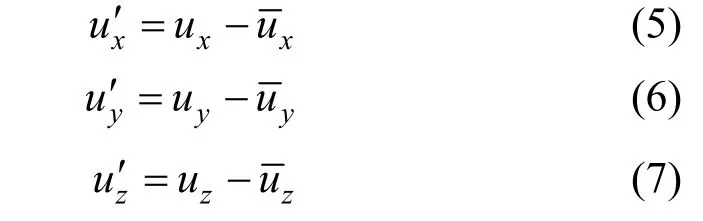
herezu′ is the tangential fluctuating velocity of fluid.Because the tangential fluctuating velocity can not be directly measured by the 2D PIV system used in this work, an isotropic assumption is utilized to obtain it,

After inserting Eq. (8) into Eq. (4), TKE can be derived [22]:

Figure 4 shows the effect of gas flow rate on TKE in different liquids aty=30 mm. The TKE profiles are almost symmetrical along the center of column with higher values in the center region due to bubble wake. TKE near the wall is much lower than that in column center. The TKE increases with the increase of gas flow rate and decrease of the apparent viscosity of liquid around bubble chain. The gradient of TKE in the center of bubble column is smaller than that on both sides of bubble chain due to the lower shear rate in the center, which also reflects the stress distribution reported by Liel al[23]. In addition, the profiles of TKE around bubble chain in non-Newtonian fluids show a typical Gaussian normal distribution similar to the result in glycerol solutions [12].
3.3 Turbulent kinetic energy dissipation rate
TKE is dissipated by viscous forces at the Kolmogorov scale [24]. TKE dissipation rate can be calculated by its definition [25]. According to isotropic hypothesis, the dissipation is expressed in two-dimensional form

whereρis the density of liquid andμis the viscosity of liquid obtained by Carreau model.
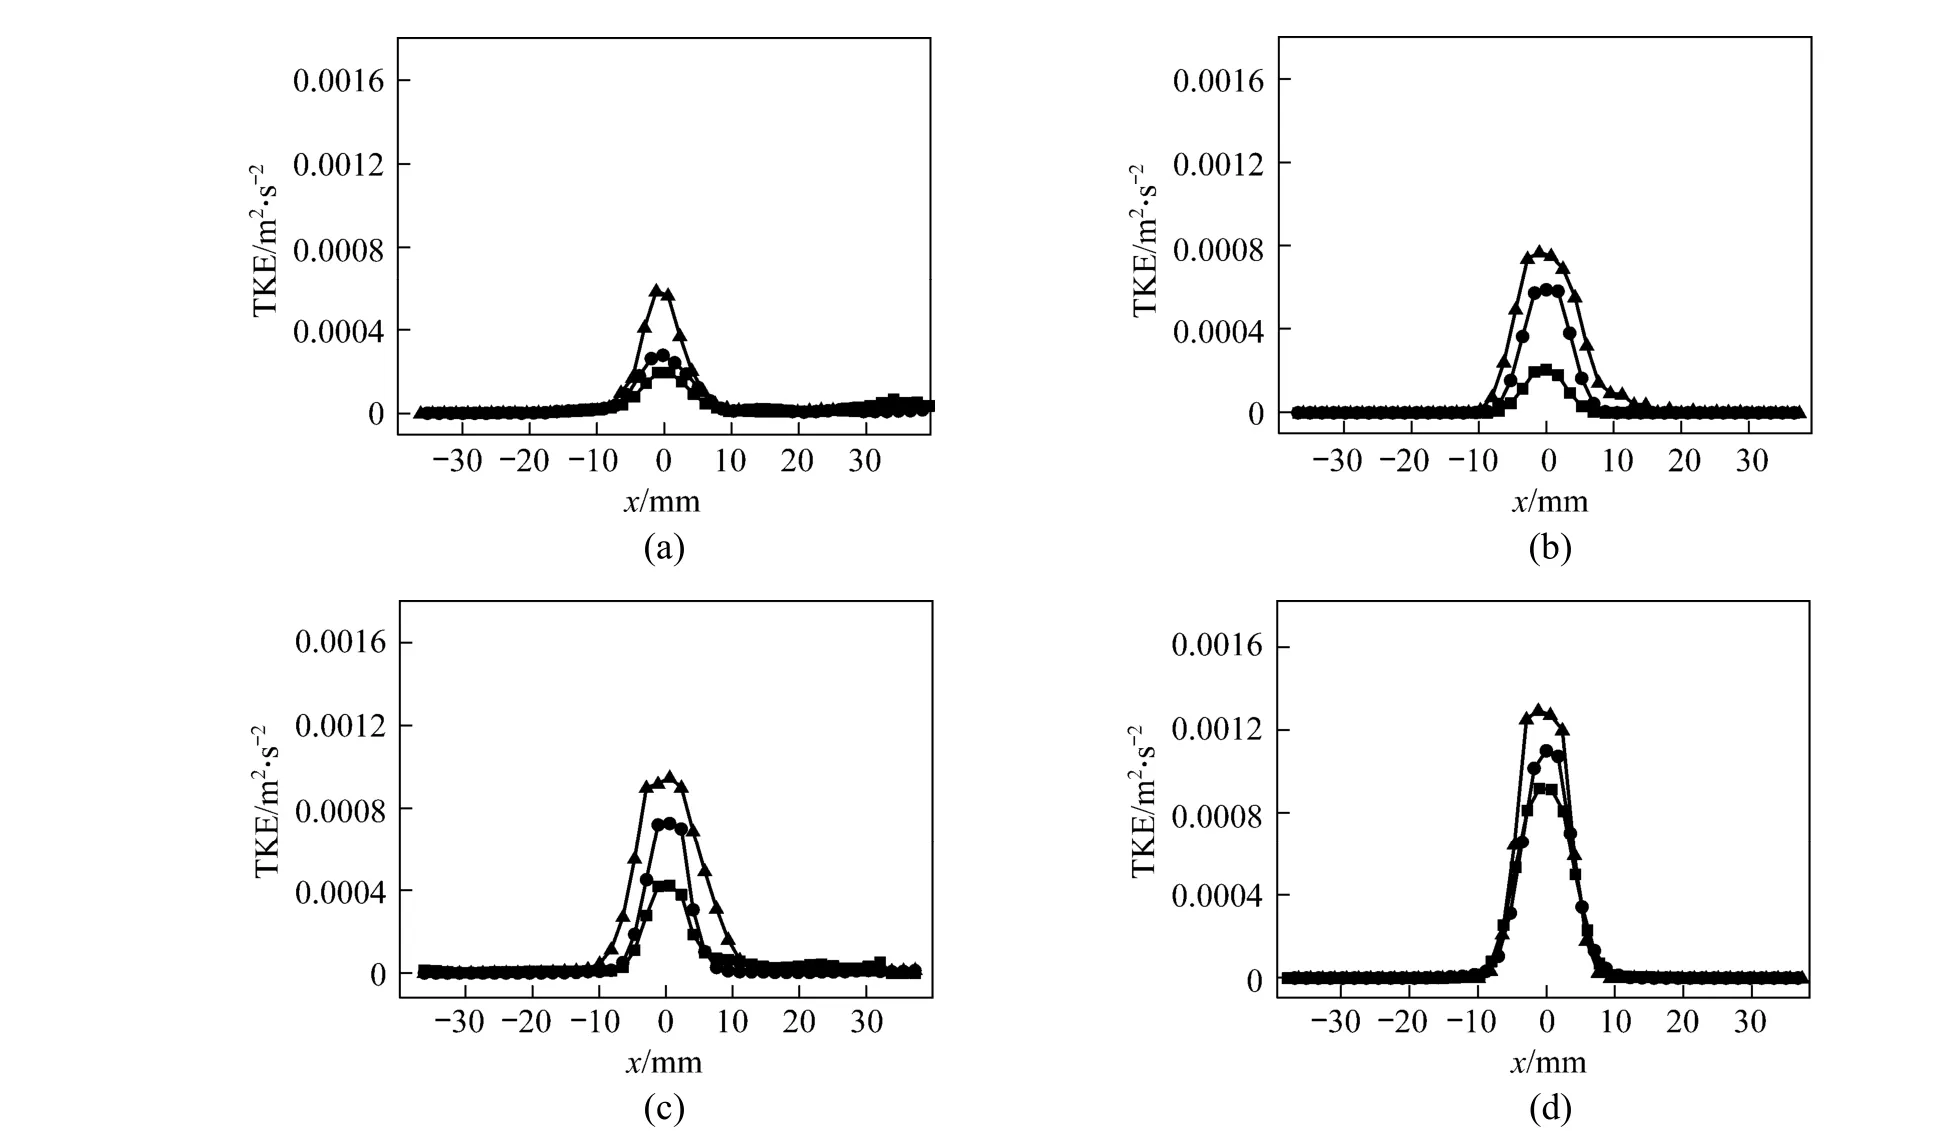
Figure 4 TKE in glycerol (a), 1.0% CMC (b), 0.6% CMC (c), and 0.2% CMC (d)■ 0.2 ml·s-1; ● 0.6 ml·s-1; ▲ 1.0 ml·s-1
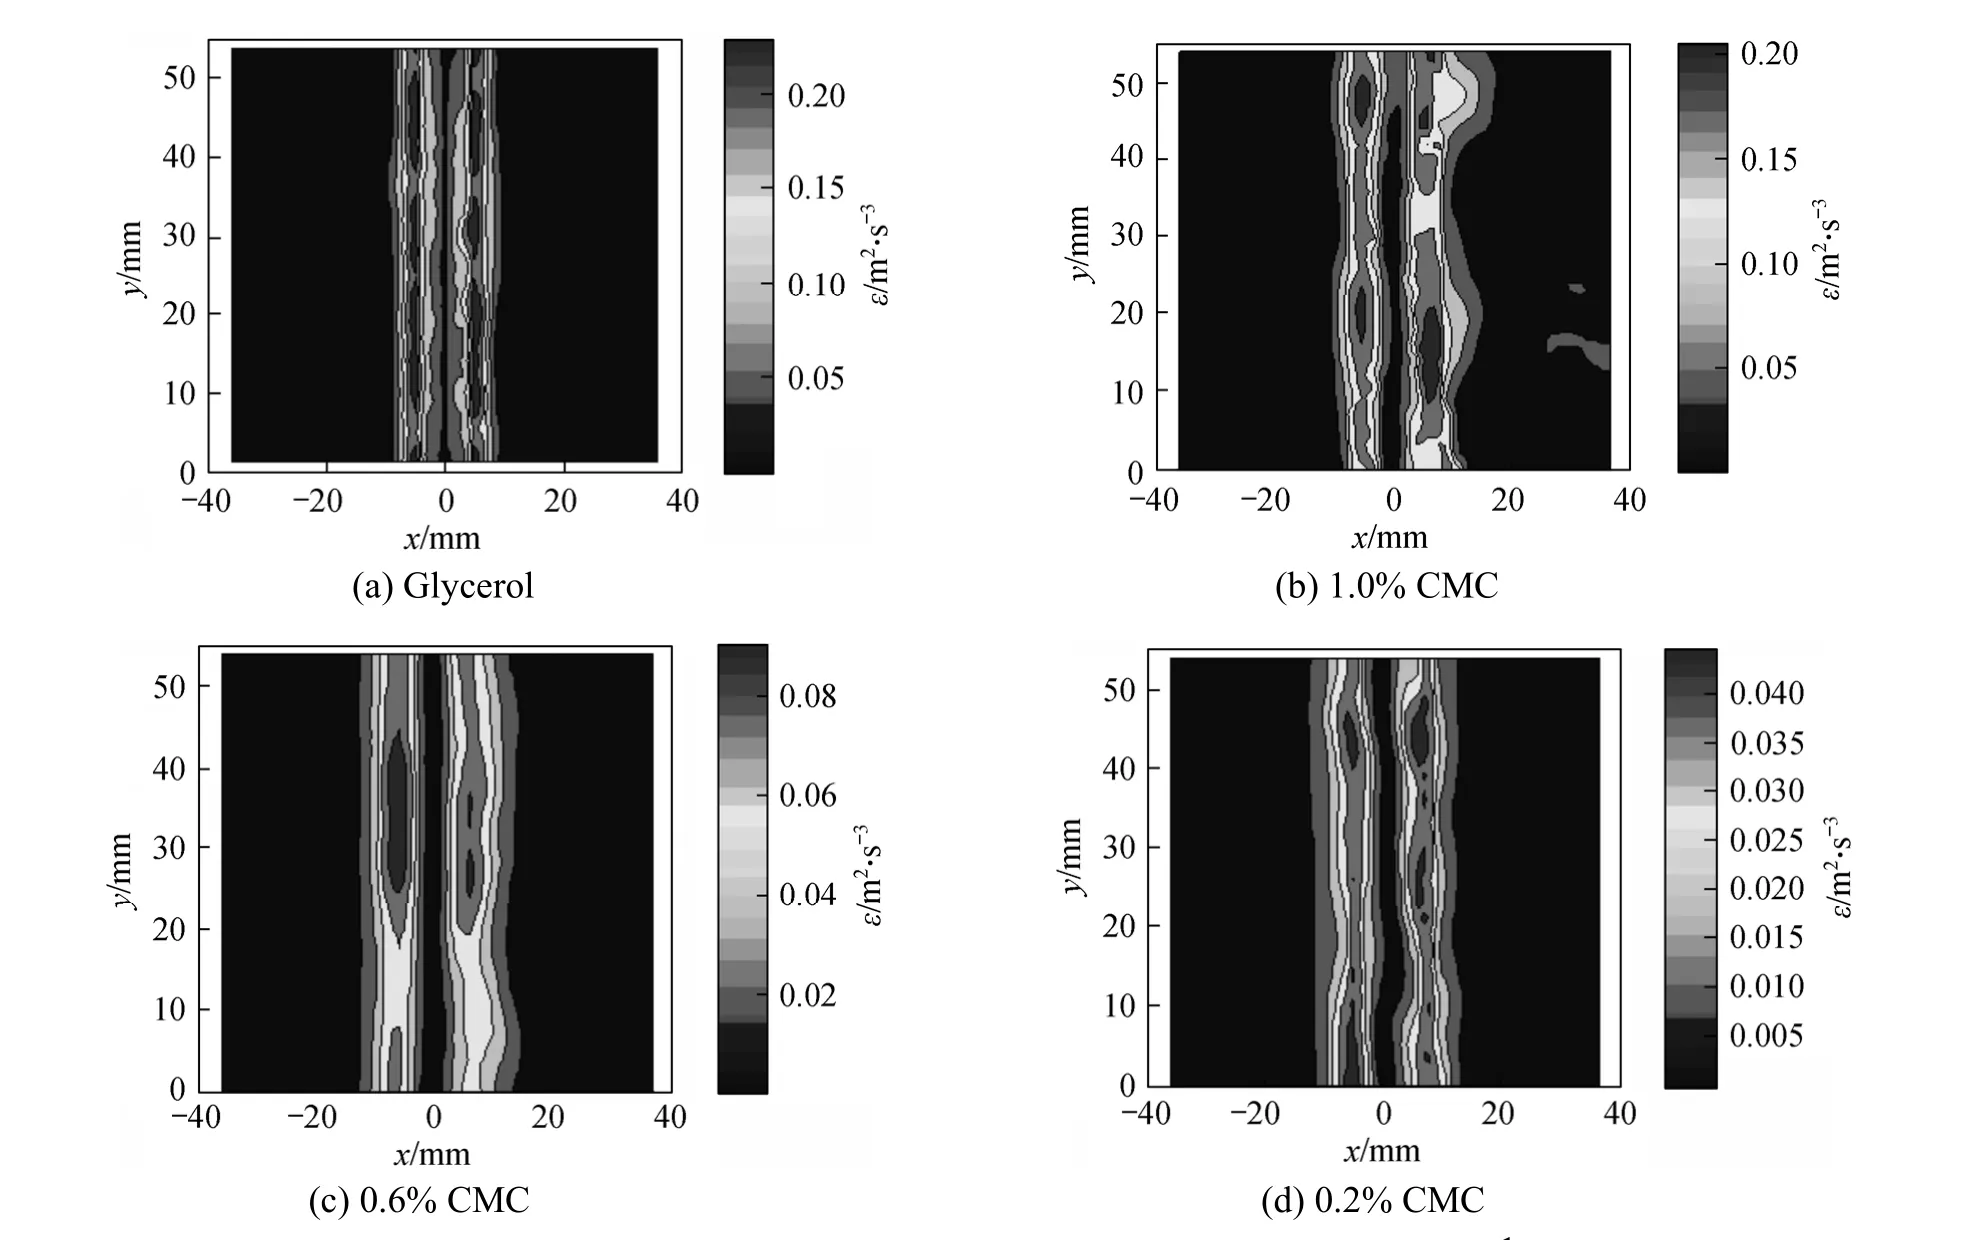
Figure 5 TKE dissipation rates in different fluids at Q=1.0 ml·s-1

Figure 6 TKE dissipation rate at different gas flow■ 0.2 ml·s-1; ● 0.6 ml·s-1; ▲ 1.0 ml·s-1
TKE dissipation rates in different liquids are shown in Fig. 5. The maximum TKE dissipation rate is always on both sides of rising bubble chain, because plenty of small-scale vortexes form due to high shear rate induced by high relative velocity between the liquid around bubble chain and bulk liquid. Despite of the high velocity of bubble wake, the TKE dissipation rate is relatively small due to the lower shear rate of liquid in this region. Fig. 5 also shows that the TKE dissipation rate is mainly influenced by the viscosity of liquid.The TKE dissipation rate is higher in glycerol solution than in CMC solutions whenγ>˙30 s-1. Fig. 6 shows the distribution of TKE dissipation rate in different solutions aty=30 mm. The profile of TKE dissipation rate has a hump-like shape, and the maximal TKE dissipation rate is on two sides of the chain of bubbles and decreases with the decrease of gas flow rate and viscosity of liquid.
4 CONCLUSIONS
With PIV technique, the turbulence characteristic of liquids around bubble chain rising in CMC solutions and glycerol were used to investigate the effects of liquid viscosity and gas flow rate on flow field,TKE and TKE dissipation rate. The flow fields are similar for all cases in present experiments. The liquid flows upward following bubbles in the center of column and moves downward near the wall. The TKE is almost symmetrical along the center of column and decreases gradually from the center to the wall of column. The values of TKE increase with the increase of gas flow rate and decrease of liquid viscosity. The profile of TKE dissipation rate has a hump-like shape,and the maximum TKE dissipation rate decreases with the decrease of gas flow rate and viscosity of liquid.This study may provide some useful information for mass transfer mechanism of bubbles moving in non-Newtonian fluids.
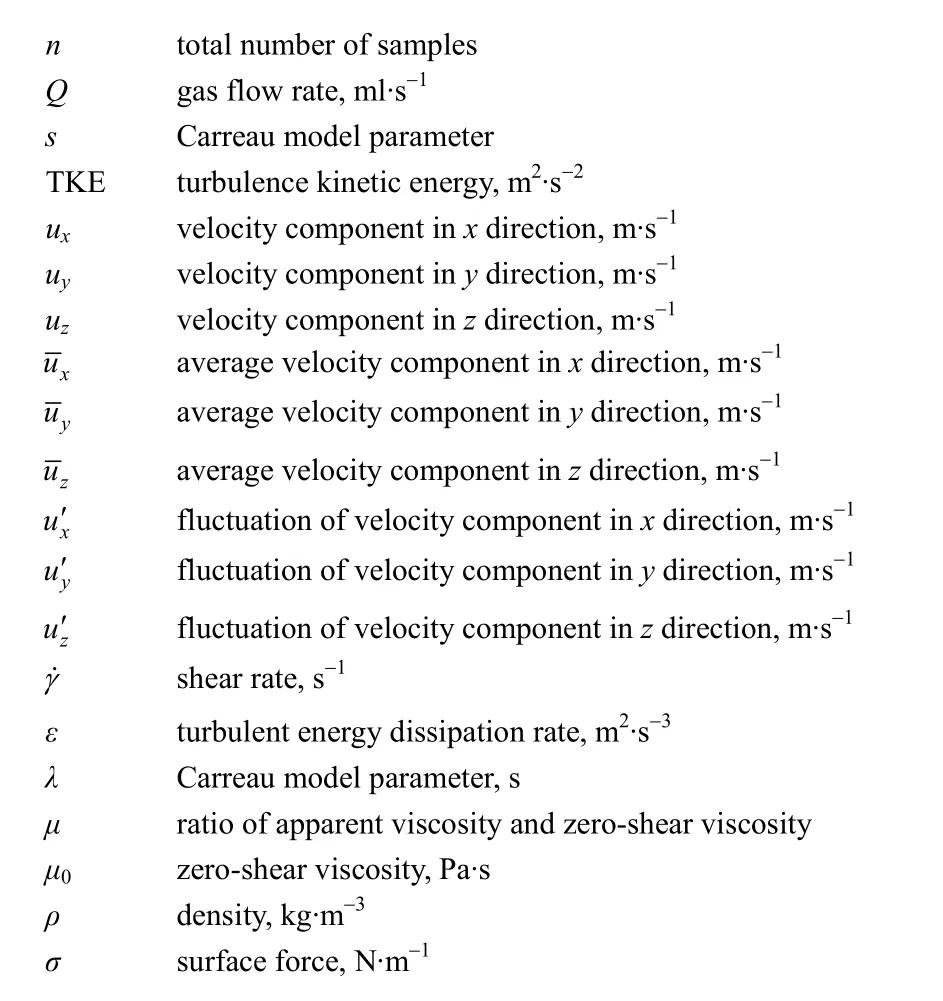
NOMENCLATURE
1 Shah, Y.T., Kelkar, B.G., Godbole, S.P., Deckwer, W.D., “Design parameters estimations for bubble column reactors”,AIChE J., 28(2), 353-379 (1982).
2 Zhang, J.T., Wang, B.X., Peng, X.F., Du, J.H., “Study on heat transfer for falling liquid film flow with consideration of interfacial evaporation”,Chin.J.Chem.Eng., 9 (2), 145-149 (2001).
3 Serizawa, A., Kataoka, I., Michiyoshi, I., “Turbulence structure of air-water bubbly flow-II. Local properties”,Int.J.Multiphase Flow,2 (3), 235-246 (1975).
4 Michiyoshi, I., Serizawa, A., “Turbulence in two-phase bubbly flow”,Nucl.Eng.Des., 95 (2), 253-267 (1986).
5 Wang, S.K., Lee, S.J., Jones Jr, O.C., Lahey Jr, R.T., “3-D turbulence structure and phase distribution measurements in bubbly two-phase flows”,Int.J.Multiphase Flow, 13 (3), 327-343 (1987).
6 Wei, T., Willmarth, W. W., “Reynolds number effects on the structure of a turbulent channel flow”,J.Fluid Mech., 204, 57-95 (1989).
7 Lance, M., Bataille, J., “Turbulence in the liquid phase of a uniform bubbly air-water flow”,J.Fluid Mech., 222, 95-118 (1991).
8 Mudde, R.F., Groen, J.S., Van Den Akker, H.E.A., “Liquid velocity field in a bubble column: LDA experiments”,Chem.Eng.Sci., 5(21-22), 4217-4224 (1997).
9 Mudde, R.F., Groen, J.S., Van Den Akker, H.E.A., “Application of LDA to bubbly flows”,Nucl.Eng.Des., 184 (2-3), 329-338 (1998).
10 Groen, J.S., Mudde, R.F., Van Den Akker, H.E.A., “On the application of LDA to bubbly flow in the wobbling regime”,Exp.Fluids, 27(5), 435-449 (1999).
11 Adrian, R.J., “Particle imaging techniques for experimental fluid mechanics”,Annu.Rev.Fluid.Mech., 23, 261-304 (1991).
12 Panidis, Th., Papailiou, D.D., “The structure of water-air bubble grid turbulence in a square duct”,Appl.Sci.Res., 51 (1-2), 269-273(1993).
13 Mudde, R.F., Lee, J., Reese, J., Fan, L.S., Role of coherent structures on Reynolds stresses in a 2-D bubble column,AIChE J., 43 (4),913-926 (1997).
14 Dominguez-Ontiveros, E., Estrada-Perez, C., Ortiz-Villafuerte, J.,Hassan, Y., “Development of a wall shear stress integral measurement and analysis system for two-phase flow boundary layers”,Rev.Sci.Inst., 77 (10), 105103-105103-12 (2006).
15 Ortiz-Villafuerte, J., Hassan, Y., “Investigation of microbubble boundary layer using particle tracking velocimetry”,J.Fluid.Eng.,128 (3), 507-519 (2006).
16 Liu, Z., Zheng, Y., Jia, L., Zhang, Q., “Study of bubble induced flow structure using PIV”,Chem.Eng.Sci., 60 (13), 3537-3552 (2005).
17 Kaminsky, R.D., “Predicting single-phase and two-phase non-Newtonian flow behavior in pipes”,J.Energy Resour.Technol.,120 (1), 2-7 (1998).
18 Funfschilling, D., Li, H.Z., “Effects of the injection period on the rise velocity and shape of a bubble in a non-Newtonian fluid”,Chem.Eng.Res.Des., 84 (10), 875-883 (2006).
19 Fan, W.Y., Ma, Y.G., Li, X.L., Li, H.Z., “Study on the flow field around two parallel moving bubbles and interaction between bubbles rising in CMC solutions by PIV”,Chin.J.Chem.Eng., 17 (6),904-913 (2009).
20 Carreau, P.J., “Rheological equations from molecular network theories”,Trans.Soc.Rheol., 16 (1), 99-127 (1972).
21 Magnussen, B.F., “On the structure of turbulence and a generalized eddy dissipation concept for chemical reaction in turbulent flow”, In:19th American Institute of Aeronautics and Astronautics Aerospace Science Meeting, St. Louis, MO, USA, 1-6 (1981).
22 Sheng, J., Meng, H., Fox, R.O., “A large eddy PIV method for turbulence dissipation rate estimation”,Chem.Eng.Sci., 55 (8),4423-4434 (2000).
23 Li, H.Z., Frank, X., Funfschilling, D., Mouline, Y., “Towards the understanding of bubble interactions and coalescence in non-Newtonian fluids: a cognitive approach”,Chem.Eng.Sci., 56 (21-22), 6419-6425(2001).
24 Kolmogorov, A.N., “Dissipation of energy in the locally isotropic turbulence”,Dokl.Akad.Nauk SSSR, 31, 538-540 (1941).
25 Azad, R.S., Kassab, S.Z., “A new method of obtaining dissipation”,Exp.Fluids., 7 (2), 81-87 (1989).
 Chinese Journal of Chemical Engineering2012年5期
- Chinese Journal of Chemical Engineering的其它文章
- The Short-term Effects of Temperature and Free Ammonia onAmmonium Oxidization in Granular and Floccular Nitrifying System*
- Adsorption and Desorption of Praseodymium (III) from Aqueous Solution Using D72 Resin*
- Ammoximation of Cyclohexanone to Cyclohexanone Oxime Catalyzed by Titanium Silicalite-1 Zeolite in Three-phase System*
- Isolation and Characterization of Heterotrophic Nitrifying Strain W1*
- Recovery of Tungsten (VI) from Aqueous Solutions by Complexationultrafiltration Process with the Help of Polyquaternium*
- Optimizing the Chemical Compositions of Protective Agents for Freeze-drying Bifidobacterium longum BIOMA 5920*