
State control,access to capital and firm performance
2012-07-01 17:10OliverZhenLiXijiSuZhifengYng
Oliver Zhen Li,Xiji Su,Zhifeng Yng
aDepartment of Accounting,NUS Business School,National University of Singapore,Singapore
bDepartment of Accountancy and Finance,China Europe International Business School,China
cDepartment of Accountancy,City University of Hong Kong,Hong Kong SAR,China
State control,access to capital and firm performance
Oliver Zhen Lia,Xijia Sub,Zhifeng Yangc,*
aDepartment of Accounting,NUS Business School,National University of Singapore,Singapore
bDepartment of Accountancy and Finance,China Europe International Business School,China
cDepartment of Accountancy,City University of Hong Kong,Hong Kong SAR,China
A R T I C L EI N F O
Article history:
Accepted 9 May 2012
Available online 12 June 2012
JEL classification:
G30
G32
G38
State control
Access to capital
Firm growth
Regulation
We study the effect of state control on capital allocation and investment in China,where the government screens prospective stock issuers.We find that state firms are more likely to obtain government approval to conduct seasoned equity offerings than non-state firms.Further,non-state firms exhibit greater sensitivities of subsequent investment and stock performance to regulatory decisions on stock issuances than state firms.Our work suggests that state control of capital access distorts resource allocation and impedes the growth of non-state firms.We also provide robust evidence that financial constraints cause underinvestment.
Ⓒ2012 China Journal of Accounting Research.Founded by Sun Yat-sen University and City University of Hong Kong.Production and hosting by Elsevier B.V.All rights reserved.
1.Introduction
The global financial and economic crisis between 2007 and 2010 triggered a fresh debate about the role of the government in the economy and highlighted the importance of understanding how financing frictions affect firm investment and the economy(Kashyap and Zingales,2010;Duchin et al.,2010;Campello et al., 2010).To shed some light on this issue,we investigate how government control affects capital allocationand firm investment in China.China has a long history of government intervention in economic affairs.Even after three decades of privatization,state-owned firms still make up the bulk of China’s economy.China’s heavily government-controlled economy,together with an emerging and rapidly developing private sector, provides us with an excellent opportunity to examine this issue.Specifically,we examine whether during the regulatory screening process of seasoned equity offering(SEO)applications,non-state-controlled and state-controlled firms are treated differently,and how their subsequent investment and stock performance are affected differently by regulatory decisions.
We find that state firms are more likely than non-state firms to receive regulatory approval to conduct SEOs,even though state firms have fewer growth opportunities than non-state firms.Specifically,during the period between 1999 and 2003,about 57%offirms successfully passed the regulatory screening process and completed stock offerings.However,the success rate for state firms is about 39%higher than that for non-state firms.
Further,wefindthatnon-statefirms’investmentandstockperformancearemoresensitivetoregulatorydecisions than those of state firms.Specifically,the median growth rate in net property,plant and equipment in nonstate firms which successfully pass the screening process is 35%(16%)in the first(second)year after receiving regulatory decisions,whereas the rate for non-state firms denied approval is only 3%in each year.In contrast, state firms denied approval to issue equity do not invest less than state firms receiving approval to issue equity. Furthermore,in the 2-year period following regulatory decisions,non-state firms receiving approval to issue equity outperform size-matched non-SEO firms by about 26%,whereas non-state firms denied approval underperform the benchmark by about 11%during the same period.In contrast,the long-run stock performance of state firms is barely affected by regulatory decisions and is not different from that of non-SEO firms.
Finally,we find that political connections help non-state firms overcome regulatory hurdles when they seek additional capital.Non-state firms with political connections have a significantly greater chance of surviving the screening process than those without political connections.Further,the chance of surviving the screening process for politically connected non-state firms is comparable to that of state firms.
Financial economists argue that capital allocation skewed toward constrained firms or individuals will disproportionately benefit them and therefore improve allocation efficiency(Galor and Zeira,1993;Aghion and Bolton,1997;Galor and Moav,2004;Claessens and Perotti,2007;Zia,2008).Financially constrained nonstate firms should benefit more from raising equity capital than state firms.Giving priority to state firms distorts capital allocation and hampers the growth of non-state firms.
We contribute to the growing literature which examines how political forces affect capital allocation around the world(Claessens and Perotti,2007).1Studies along this line include La Porta et al.(2002),Johnson and Mitton(2003),Sapienza(2004),Dinc(2005),Khwaja and Mian (2005),Leuz and Oberholzer-Gee(2006),Claessens et al.(2008),Zia(2008),and Fan et al.(2008).Our work differs from extant studies in two ways.First,we identify a mechanism,the screening of stock issuers,through which the government directly controls capital allocations. Thus,we are able to obtain direct evidence on how government control affects the allocation outcome.In contrast,extant studies often compare financial outcomes between politically connected and non-politically connected firms,and indirectly infer politicians’influence on capital allocations.Second,we focus on the allocation of equity capital,whereas most extant studies examine the allocation of bank credit.Governments in many countries have a significant influence on equity capital allocation.Our work provides new and direct evidence that assists researchers and regulators in gaining a better understanding of how political forces affect access to finance and capital allocation efficiency.
Further,our work is linked to the literature on the impact offinancial constraints on firms’investment and growth.Most studies on financial constraints focus on firm characteristics such as cash flow and leverage,and interpret the response of investment to changes in these characteristics as evidence that financial constraints affect investment(Fazzari et al.,1988;Campello et al.,2010).However,changes in these characteristics are likely correlated with the availability of investment opportunities(Kaplan and Zingales,2000).This endogeneity issue can be mitigated by comparing the response offirms with differing degrees offinancing constraints to the same shock.China has two types offirms,controlled by the state and the private sector (non-state entrepreneurs)respectively,which have differing degrees offinancial constraints(Allen et al.,2005).2Besides Allen et al.(2005),Brandt and Li(2003),Li et al.(2007),and Wang et al.(2008)also argue that private firms(non-state firms) are discriminated by state banks,and thus more constrained financially than state firms.Regulatory decisions regarding SEO applications significantly affect capital availability to SEO applicants.Comparing the responses of non-state and state firms to regulatory decisions generates robust evidence about the impact offinancial constraints on investment.
In addition,we provide direct evidence that political connections bring benefits to non-state firms.This result furthers our understanding of the rationale for businesses to build political ties(Fisman,2001;Faccio, 2006;Faccio and Parsley,2009).Our study also provides evidence corroborating the notion that the development of the private sector in China is likely supported by informal financing channels(Allen et al.,2005).
Finally,our paper is relevant to the current debate on the role of the government in the economy amid a global financial and economic crisis.To combat the current global economic recession,countries around the world have been expanding the role of the government.While various measures aimed at stimulating the economy may temporarily ease problems such as high unemployment,a frozen credit market and a potential collapse of major industries or firms,they come with their own unique agency problems.These agency problems may steer resources away from sectors where they are most needed and thus can be used more efficiently.For example,one concern raised by industry leaders is the presence of conflicts of interest when governments become both the regulator and the regulated.Small and non-state firms could face difficulties competing against firms owned by the government.3Phillips,Maha Khan.The new political economy.CFA Magazine September-October 2009.While the economic and institutional setting in China is different to that of developed countries and we are hesitant to extrapolate excessively,results from our analysis could be of reference to these economies.
The rest of the paper proceeds as follows.Section 2 explains SEO regulations in China and develops our hypotheses.Section 3 describes our sample and data.Section 4 presents the main empirical results.Section 5 extends our main analysis and presents results of robustness tests.Section 6 concludes.
2.Institutional background and hypothesis development
2.1.Seasoned equity offering regulations in China
Chinese listed firms seeking to issue new shares must go through a lengthy approval process.First,a firm’s board of directors has to approve the SEO plan.Once the plan has received board approval,the firm must immediately announce the preliminary offering plan.The preliminary plan usually details the type of offering proposed,the estimated number of shares to be offered,the estimated offering proceeds and the projects to be funded.4Chinese companies can issue new shares to existing shareholders(right offerings)or to all public investors(general offerings).In our sample period,both rights offerings and general offerings are present.The firm then calls a shareholder meeting to seek approval of the plan from shareholders.Because controlling shareholders usually dominate both at the board meeting and at the shareholder meeting,a plan that has received board approval is almost invariably approved at the shareholder meeting.5A new regulation issued in 2004 requires an offering plan be approved by both the majority of all outstanding votes and the majority of all outstanding public votes.Some offering plans proposed after this date received board approval but failed to be approved at the shareholders meeting because of opposition from public shareholders(Chen et al.,2011).We focus on firms announcing SEO proposals before 2004 to avoid the confounding impact of this regulation.The first shareholder meeting notice must be sent out at least one month before the scheduled meeting date.The minimum time interval between the board announcement and the shareholder meeting resolution is therefore one month. After obtaining approval at the shareholder meeting,the firm’s management will invite investment bankers, auditors and lawyers to prepare an offering application.The offering application must first be endorsed by the local office of the China Securities Regulatory Commission(CSRC)in the region where the firm is incorporated.After obtaining the local regulatory endorsement,the firm’s management is required to submit the application to the CSRC for approval.The application typically includes the offering plan and financial statements from the past 3 years.The offering is usually made within a few days of CSRC approval.
The CSRC has issued guidelines governing the equity offering process.During our sample period,these guidelines include CSRC[1999]12,CSRC[2000]42 and CSRC[2001]43.These regulations specify positive requirements that SEO applicants must meet and negative criteria that may result in approvals being denied. These qualifications typically include both hard requirements,such as profitability thresholds,and soft requirements,such as governance quality.Other than profitability requirements,the positive and negative criteria specified in the various guidelines are mostly similar.CSRC[1999]12 requires SEO applicants to have a minimum average ROE of 10%over the past 3 years and a minimum ROE of 6%in any of the past 3 years. CSRC[2001]43 lowers the profitability threshold,requiring an average ROE of no lower than 6%over the past 3 years.We list the mandatory criteria under CSRC[1999]12 in Appendix A.These guidelines suggest that the screening process is aimed at identifying high-performing,well-governed firms.However,the guidelines also leave sufficient room for regulators to exercise their discretion in selecting applicants.
Firms seeking equity offerings may also be forced to cancel their offering plans before they submit applications to the CSRC due to explicit or implicit signals from regulators that their proposals are unlikely to be approved.Such signals can be conveyed via unfavorable regulatory decisions made with respect to similar firms,informal discussions with regulators or regulators’informal policy announcements.
2.2.Analytical framework
To assess capital allocation efficiency,we follow the analytical framework of Claessens and Perotti(2007). They suggest that financially constrained firms or individuals should benefit more from the relaxation offinancial constraints than unconstrained firms.Therefore,giving preferred capital access to constrained firms or individuals improves capital allocation efficiency and facilitates economic growth.This analytical framework is built on Galor and Zeira(1993),Aghion and Bolton(1997)and Galor and Moav(2004).To apply this analysis,scholars usually compare the responses of two types offirms with differing degrees offinancial constraints to exogenous shocks to capital availability and then make inferences.Zia(2008)presents a specific example of applying this analytical framework by comparing the production and performance between public and private firms subsequent to the removal of subsidized government export loans in Pakistan.He finds that the performance and production of public firms,which are considered less financially constrained than private firms,are not affected by the removal of subsidized loans,while the production and performance of private firms are greatly adversely affected.This is because public firms are able to substitute subsidized loans with commercial bank credit,while private firms are not.He thus concludes that the initial allocation of subsidized loans to public firms is inefficient.Following this framework,we first examine whether non-state and state firms are treated differently in the regulatory process regarding their SEO applications,and then examine how their subsequent investment and stock performance are affected differently by regulatory decisions.
2.3.Hypothesis development
2.3.1.Political forces and capital allocation
A growing literature examines how political forces affect capital allocation.This literature generally concludes that capital is allocated based on political favoritism if politicians can exert a significant influence over the allocation process(La Porta et al.,2002;Johnson and Mitton,2003;Sapienza,2004;Dinc,2005;Khwaja and Mian,2005;Faccio et al.,2006;Leuz and Oberholzer-Gee,2006;Claessens et al.,2008;Zia,2008;Fan et al.,2008).Both intuition and anecdotal evidence suggest that governments or politicians likely intervene in regulators’decisions in an effort to ensure that priority is given to state firms in their pursuit of capital. When the government controls the capital allocation process,state firms could receive favorable treatment for several reasons.First,state firms are often required to fulfill social objectives such as supporting employment,investing in public projects and maintaining social stability.In exchange,the government gives financial support to state firms.When necessary,the government can also intervene in regulatory decisions and give favorable treatment to state firms.Second,state firms are more likely than non-state firms to have political connections.Executives of state firms are often de facto government officials and are thus more likely to have ties with regulators(Fan et al.,2007).Political connections enable state firms to influence regulatory decisions. Third,regulators are more willing to approve state firms’equity issuance requests because potential liabilitiesregulators face when allocating capital to state firms are less onerous than those they face when allocating capital to non-state firms.For example,state firms are less likely to go bankrupt because the government is more likely to bail out state firms in financial distress than they are to rescue non-state firms.Even when state firms can also go bankrupt,regulators face less onerous liabilities when they allocate state resources to failed state firms than to failed non-state firms.Extant studies find that state banks lend more to state firms or politically connected firms for the above reasons(La Porta et al.,2002;Dinc,2005).
Previous studies suggest that in comparison with their state counterparts,non-state firms in China are discriminated against by state banks.Allen et al.(2005)show that the amount of bank credit extended to the nonstate sector in China is much lower than that extended to the state sector,in spite of the fact that the former account for a larger share of production than the latter.Wang et al.(2008)suggest that because state-controlled firms in China have preferential access to bank credit and are more likely to be bailed out in the event of financial distress,they lack incentives to employ high-quality auditors.We examine how government intervention impacts the availability of equity to state versus non-state firms and propose our first hypothesis below:
Hypothesis 1.State firms are treated more favorably by regulators in the seasoned equity offering screening process than non-state firms.
2.3.2.Sensitivities of investment and stock performance to regulatory screening decisions
Even though state firms are likely treated more favorably by the government in the equity allocation process,they are often less financially constrained than non-state firms.They can more easily access state banks and receive other forms of government favors,such as tax rebates or subsidies than non-state firms(Khwaja and Mian,2005;Allen et al.,2005).Therefore,state firms are financially less reliant on the seasoned equity market.Non-state firms,on the other hand,have difficulties obtaining bank loans.They are less likely to obtain direct financial support from the government.Receiving approval to raise capital through issuing new shares enables them to capture investment opportunities and achieve growth,whereas failure to receive approval to raise capital forces them to abandon valuable investment opportunities and therefore forfeit growth.The finance literature suggests a negative association between financial constraints and firm investment(Fazzari et al.,1988;Lang et al.,1996;Stein,2003;Desai et al.,2008;Almeida and Campello,2010). We use the ultimate controlling shareholder,state versus non-state owners,as a proxy for financial constraints and examine firms’responses to regulatory decisions on equity issuances.We predict that financially constrained non-state firms should exhibit a more pronounced sensitivity of investment to regulatory decisions regarding SEO applications than state firms.
We also predict that non-state firms’post-decision stock performance is more sensitive to regulatory decisions than that of state firms.Realizing that non-state firms may have difficulties implementing investment opportunities,investors rationally discount the value of those opportunities before observing regulatory decisions.If non-state firms receive approval to issue equity,then investors revise upward their expectations that investment opportunities will be realized and therefore drive up these firms’stock prices.Otherwise,stock prices plunge for non-state firms denied approval because investors become increasingly concerned about the ability of such firms to capture investment opportunities.Stock performance of state firms is less likely to be affected by regulatory decisions because investors are less likely to worry about state firms’ability to implement investment projects and thus are less likely to discount their value before receiving regulatory decisions.Based on the above argument,we propose our second hypothesis below:
Hypothesis 2.The sensitivities of subsequent investment and stock performance to regulatory decisions on the seasoned equity offering screening process are more pronounced for non-state firms than for state firms.
3.Sample and data
3.1.Sample selection
We manually collect stock offering proposals announced between 1999 and 2003 in the corporate announcement database in WIND,which is a leading integrated financial data service provider in China.The sample period starts from 1999 because corporate announcements made before 1999 are not available in the WIND database.We end the sample period before 2004 because most SEO plans announced in 2004 and 2005 were not processed by the CSRC due to a share reform that began in 2005.6In the early stage of China’s stock markets,shares held by pre-IPO owners were not tradable.Only stocks held by public shareholders could be legally traded.In 2005,the Chinese government announced its intention to convert all non-tradable shares into tradable shares. This share reform program began in 2005 and was largely completed by 2007.Since then,all shares have been tradable.The CSRC suspended the processing of IPO applications in 2005 and resumed it in mid-2006.As detailed below,we examine the operating and stock performance offirms 2 years after they receive regulatory decisions.The accounting and stock return data used in this study,hence,are up to 2006.We track each proposal to determine whether it was submitted to be voted on at a shareholder meeting and implemented within a year of receiving shareholder approval.Accounting and stock return data are obtained from the China Stock Market and Accounting Research(CSMAR)database.The ultimate controlling shareholder(s)of each sample firm is (are)manually collected from annual reports and we classify them into the following types:state,universities, collective enterprises(including town-village enterprises),domestic individuals and miscellaneous.A firm is defined as a non-state firm if its ultimate controlling shareholders are domestic individuals,and defined as a state firm if its ultimate controlling shareholder is the government.
We obtain a total of 883 firms which announced SEO proposals between 1999 and 2003.We delete 42 firms whose ultimate controlling shareholders cannot be identified or for which required accounting or stock return data is missing,44 firms which did not forward their proposals for shareholder approval and 61 firms whose ultimate controlling shareholders were universities,town-village enterprises or miscellaneous types.If a proposal was not submitted for shareholder approval,we assume that the firm voluntarily cancelled its stock offering plan.Such firms are excluded because we study regulatory decisions.The ratio of voluntarily cancelled proposals to all proposals(about 5%)is close to that in the United States(Clarke et al.,2001).Universities and town-village enterprises are different from non-state firms in that they are quasi-state-owned,which makes it possible that firms controlled by universities or collective enterprises receive favorable treatment from the government.For example,Brandt and Li(2003)find that town-village enterprises in China are more likely to obtain bank credit than privately owned firms.We exclude these firms from our tests.The final sample consists of 736 firms.Among these firms,648 are state firms and 88 are non-state firms.This statistic is consistent with the fact that the majority of listed firms in China are still government-controlled.In fact,Bortolotti and Faccio (2009)find that,contrary to conventional wisdom,many partially privatized firms in OECD countries remain in government hands.Table 1 shows the sample selection process.
A proposal approved by a firm’s shareholders is subject to a validity period of,in most cases,1 year from the date on which shareholders approve the proposal.A firm must announce a new proposal and call another shareholder meeting to approve it if the proposal is not implemented within the validity period but the management still wants to issue shares.We therefore define a firm as a successful firm if its proposal is implemented within a year of shareholder approval.Likewise,a firm is defined as an unsuccessful firm if itsproposal is not implemented within a year of shareholder approval.Based on this classi fication scheme,420 firms,7Chen and Yuan(2004)investigate whether regulators are able to see through earnings management by rights offering applicants.Their sample period is from 1996 to 1998.They obtain their data from the CSRC and show that about 25%offirms which submit applications to the CSRC are denied approval.The unsuccessful rate in our sample is 43%,which is higher than theirs.Our classification approach considers those SEO proposals that are implicitly or explicitly rejected by the CSRC before the firms submit those proposals,and those that are rejected by regional offices of the CSRC.or 57%of the final sample,are successful firms,and 316,or 43%of the final sample,are unsuccessful firms.
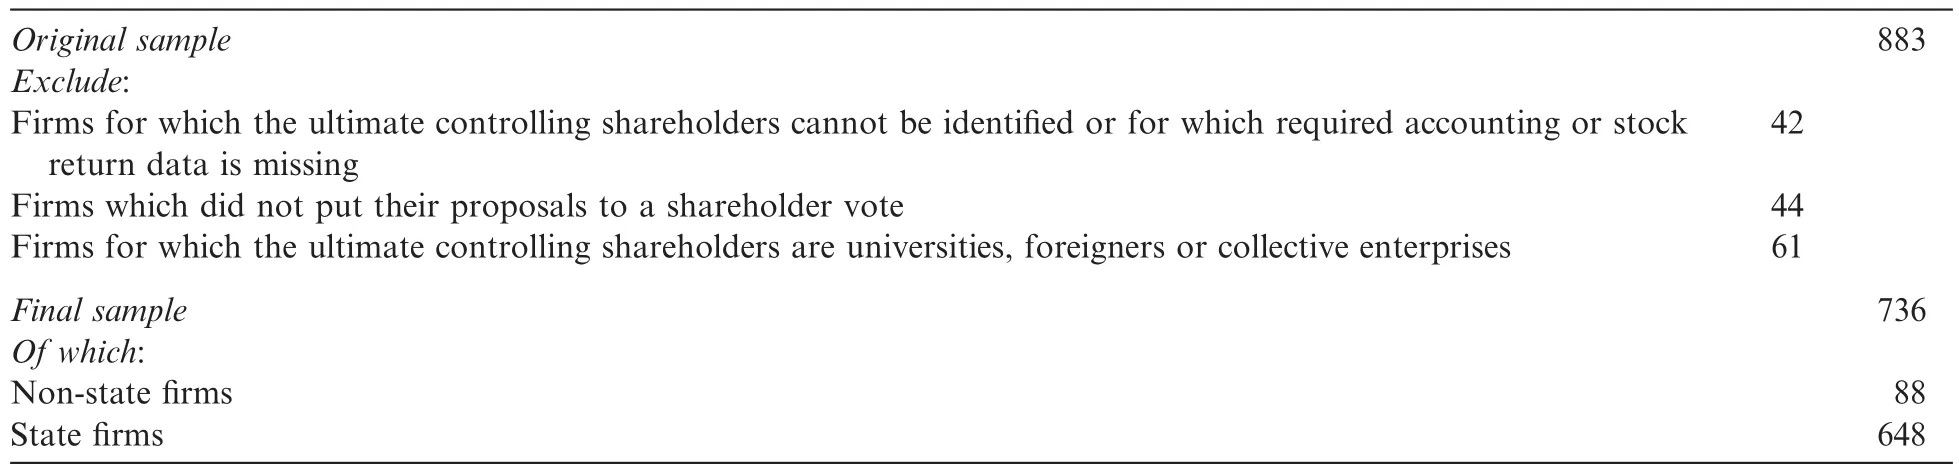
Table 1Sample selection.The original sample contains all firms that announced stock offering plans from 1999 through 2003.A firm is defined as a state firm if its ultimate controlling shareholder is the government or as a non-state firm if its ultimate controlling shareholders are individuals.

Table 2Descriptive statistics.A firm is defined as a state firm if its ultimate controlling shareholder is the government or as a non-state firm if its ultimate controlling shareholders are individuals.Success equals 1 if a firm successfully offers stock within 1 year of receiving shareholder approval for an offering proposal and 0 otherwise.Return on Assets is the average return on assets for the 3 years immediately before the year in which the board announces an offering proposal.Cash Ratio is the ratio of cash and cash equivalents to total assets.Leverage is the ratio of total liabilities to total assets.Capitalization is the market value of equity.Growth in sales,cash ratio,leverage,assets,sales,and capitalization are based on the corresponding values in the year immediately preceding the year of the board announcement on the offering proposal.Market Run-up is the equal-weighted market return over the 12-month period before the board announcement date.Differences in means(medians)between state and non-state firms are compared and p-values are reported in the last two columns.P-values that are 0.10 or smaller are highlighted in bold(two-sided tests).
3.2.Descriptive statistics
Table 2 reports descriptive statistics for the whole sample and for the two sub-samples of state and nonstate firms separately.We find that the success rate for state firms(59%)is significantly higher than that for non-state firms(45%).We also report statistics on growth potential,profitability,internal fund status, leverage,market conditions and firm size because the guidelines issued by the CSRC suggest that these are important factors influencing regulators’decisions or,as predicted by capital structure theories,they are important determinants of firms’decisions to issue equity.Capital structure theories(Myers,2003)suggest that firms with invest8Major capital structure theories include pecking order theory,trade-of ftheory,and agency theory(see a review by Myers(2003)). These theories generally agree that firms with growth opportunities but having difficult financing them with internal funds or new loans are good candidates for new equity issuance.ment opportunities issue equity if they are already highly levered and do not have sufficient internal funds.Booth et al.(2001)show that major capital structure theories are portable to developing countries.Following Morck et al.(1988),many studies use Tobin’s Q as a proxy for investment opportunities. Tobin’s Q,however,is endogenous to corporate governance quality and financial constraints(Durnev and Kim,2005).In our setting,Tobin’s Q also suffers from an endogeneity problem since we argue that stock valuation prior to receiving regulatory decisions regarding SEOs reflects investors’expectation about the likelihood of the approval of the offering plan.Hence,Tobin’s Q is not a good measure for investment opportunities in our setting.We use Growth in Sales as a proxy for investment opportunities,following Durnev and Kim(2005).We use Return on Assets to measure profitability.We use Cash Ratio as a proxy for internal fund sufficiency and Leverage as a proxy for debt capacity.Firm size,as measured by the market value of equity,total assets or total sales,is used as another proxy for debt capacity because large firms have agreater ability to provide collaterals for loans.Finally,we consider market run-up.Favorable market conditions may imply the presence of investment opportunities(Pastor and Veronesi,2005).The definitions of major variables are given in Appendix B.The distribution of growth rates,including Growth in Sales and Growth in PPE/Growth in Assets(defined later),are highly skewed.To minimize the influence of outliers, we winsorize growth rates at the top and bottom 5%levels.
Table 2 shows that non-state firms experience faster sales growth than state firms,suggesting that the former have more investment opportunities than the latter.State firms are larger than non-state firms when measured by total assets or sales,but not in terms of market capitalization,suggesting that investors value non-state firms more than state firms.This is likely due to the fact that non-state firms grow more rapidly than their state-owned counterparts.Market conditions before offering announcements are typically better for state firms than for non-state firms.Overall,univariate results suggest that non-state firms are less likely to pass the screening process than their state-controlled counterparts,although they appear to have more investment opportunities.
4.Main analysis
4.1.Determinants of successful offerings
We run the following logistic regression to determine whether state and non-state firms are treated differently in the SEO regulatory screening process:

where the dependent variable,Success,is a dummy variable that equals one for a successful firm and zero otherwise.We include State to indicate the type of ultimate controlling shareholder.State equals one for a state firm and zero otherwise.The control variables include Growth in Sales,Return on Assets,Market Run-up,Cash Ratio,Leverage and Log of Capitalization.As discussed earlier,the 2001 CSRC guidelines lowered the basic profitability requirement firms must meet to qualify for stock offerings.To control for thepossible impact of the increased number of SEO candidates on regulators’approval decisions,we include Period which takes the value of one if a stock offering plan announcement was made after 2001 and zero otherwise.

Table 3Determinants of successful offerings.The dependent variable is Success.Success equals 1 if a firm successfully offers stock within 1 year of receiving shareholder approval for its offering proposal and 0 otherwise.State equals 1 if a firm’s ultimate controlling shareholder is the state and 0 otherwise.Return on Assets is the average return on assets for the 3 years immediately before the year in which the board announces an offering proposal.Cash Ratio is the ratio of cash and cash equivalents to assets.Leverage is the ratio of liabilities to assets.Capitalization is the market value of equity.Growth in sales,cash ratio,leverage,and capitalization are based on the corresponding values in the year immediately preceding the year of the board announcement on the offering proposal.Market Run-up is the equal-weighted market return over the 12-month period before the board announcement date.Period equals 1 if a board announcement is made after 2001 and 0 otherwise.P-values that are 0.10 or smaller are highlighted in bold(two-sided tests).
Results,reported in Table 3,confirm findings of our univariate tests,i.e.,state firms are much more likely to survive the screening process than non-state firms.The coefficient on State is positive and significant(0.64, p=0.01),supporting Hypothesis 1.This coefficient estimate means that if the values of all the other variables are held at their sample means,the probability of a state firm surviving the screening process is 57%,whereas that for a non-state firm is 41%.Hence,a representative state firm is 39%[(57%-41%)/41%]more likely to pass the screening process than a typical non-state firm.
Among the control variables,it appears that market conditions play an important role in regulators’decisions.The coefficient estimate on Market Run-up is positive and significant(1.45,p=0.00),suggesting that a firm is much more likely to receive approval when market conditions are favorable.The coefficient on Leverage is positive and significant(1.64,p=0.03)and the coefficient on Cash Ratio is significantly negative(-2.24, p=0.02),suggesting that regulators tend to approve equity issuance applications made by firms with insufficient internal funds or high leverage.The coefficient on Period is negative and significant(-0.67,p=0.02), suggesting that the success rate fell after the CSRC relaxed its profitability requirement,probably due to an increase in the number of qualified SEO candidates.The major proxy for investment opportunities,Growth in Sales,however,is not significantly related to regulatory decisions(-0.39,p=0.14).
4.2.Investment growth after regulatory decisions
In this subsection,we investigate new investment made during the period after regulatory decisions regarding SEO applications.We define the year in which the screening outcome is determined as Year 0 and examine growth in investment in Year 1 and Year 2.9Because most sample firms do not formally announce the cancellation of stock offering proposals,we estimate the year when regulatory decisions are made.The estimation procedure is described in detail in a later section.Investment includes expenditure on property,plant and equipment(PPE),as well as on inventories,sales credit and research and development(Stein,2003).Hence,growth in investment is manifested in growth in PPE and growth in accounts receivable,inventories and intangible assets.Following Desai et al.(2008),we use growth in net PPE to capture new capital expenditure and use growth in total assets to capture total new investment.Total assets include cash and cash equivalents that are not normally considered investment.We therefore calculate growth in total assets adjusted for cash and short-term investment.Specifically,these measures are constructed in the following way:

Fig.1 plots Growth in PPE and Growth in Assets for non-state and state firms.These figures demonstrate that both capital expenditure and total investment grow more rapidly in successful non-state firms than in unsuccessful non-state firms.Although the investment of successful state firms also grows faster than that of unsuccessful state firms,the difference is not as pronounced as that between successful and unsuccessful non-state firms.
In Table 4,we present results of formal tests for the difference between the groups in the growth rate of investment.Panel A shows that investment in successful non-state firms grows much faster than it does in unsuccessful non-state firms.The mean(median)growth rate in PPE for successful non-state firms is 36% (35%)in Year 1 and 27%(16%)in Year 2,whereas the mean(median)growth rate in PPE for unsuccessful non-state firms is 12%(3%)in Year 1 and 6%(3%)in Year 2.Although successful state firms also invest more than unsuccessful state firms,the gap between them is not as pronounced as that between successful and unsuccessful non-state firms.The mean(median)growth rate in PPE for successful state firms is 20% (14%)for Year 1 and 15%(10%)for Year 2,whereas the mean(median)growth rate in PPE for unsuccessfulstate firms is 17%(10%)for Year 1 and 14%(6%)for Year 2.We observe a similar pattern for growth in adjusted assets.
Because investment is affected by other factors such as the presence of investment opportunities and funds from other sources which could also be associated with regulatory decisions,we run the following multivariate regression to determine the impact of regulatory decisions on investment among SEO applicants in the long run:


Fig.1.Investment growth after regulatory decisions.A firm is de fined as a successful firm if it successfully o ff ers stock within 1 year of receiving shareholder approval for the proposal and is de fined as an unsuccessful firm otherwise.A firm is de fined as a state firm if its ultimate controlling shareholder is the government or as a non-state firm if its ultimate controlling shareholders are individuals.Year 0 is the year in which the regulatory decision on a firm’s stock o ff ering proposal is made.Growth in PPE and Growth in Assets(adjusted by Cash and short-term investments)are calculated in the following ways:Panels A and B plot Growth in PPE and Growth in Assets by non-state firms,respectively;Panels C and D plot Growth in PPE and Growth in Assets by state firms,respectively.
where Success is set to one for successful firms and zero otherwise.We include State,Success and an interaction term between them,State*Success.We include all control variables used in the regulatory decision model for two reasons.First,these variables are proxies for investment opportunities and the availability of capital from other sources,which affect investment.Second,by including the same set of controls in both thescreening and investment models,the coefficient on Success potentially captures the impact of an exogenous or unpredicted shock to capital availability on firm investment.In a subsequent section,we use another approach to further address the endogeneity issue,following Faulkender and Petersen(2009).

Table 4Investment growth after regulatory decisions.A firm is defined as a successful firm if it successfully offers stock within 1 year of receiving shareholder approval for the proposal and is defined as an unsuccessful firm otherwise.A firm is defined as a state firm if its ultimate controlling shareholder is the government or as a non-state firm if its ultimate controlling shareholders are individuals.Year 0 is the year in which the regulatory decision on a firm’s stock offering proposal is made.Growth in PPE and Growth in Assets(adjusted by cash and cash equivalents)are calculated in the following ways:
Panel B,Table 4 reports regression results.The coefficient on State is positive and in most cases significant (0.08,p=0.09 for Year 1 and 0.09,p=0.02 for Year 2 using growth in PPE;0.01,p=0.71 for Year 1 and 0.06,p=0.04 for Year 2 using growth in adjusted assets),suggesting that state firms invest more than nonstate firms if both are denied approval to issue equity.The coefficient on Success is significantly positive(0.24, p=0.00 for Year 1 and 0.20,p=0.00 for Year 2 using growth in PPE;0.24,p=0.00 for Year 1 and 0.15, p=0.00 for Year 2 using growth in adjusted assets),suggesting that successful non-state firms invest more than unsuccessful non-state firms.The coefficient on the interaction between State and Success is significantly negative(-0.22,p=0.00 for Year 1 and-0.20,p=0.00 for Year 2 using growth in PPE;-0.17,p=0.00 for Year 1 and-0.16,p=0.00 for Year 2 using growth in adjusted assets),suggesting that successful state firms invest less than successful non-state firms.Collectively,these findings support Hypothesis 2 that non-state firms exhibit greater sensitivities of investment to regulatory decisions than state firms.
Results for control variables are consistent with theoretical predictions and previous empirical findings.For example,the coefficient on Growth in Sales is positive and highly significant,suggesting that fast-growing firms invest more.Return on Assets is positive and significant in Year 2 using growth in PPE.Market Run-up is positive and significant in Year 2,consistent with investment in a high return state.Leverage is negative and significant using growth in adjusted assets,suggesting that firms with low debt capacity invest less.Cash Ratio, Log of Capitalization and Period are insignificant.
4.3.Stock performance after regulatory decisions
In this subsection,we examine stock performance over a 2-year period after regulatory decisions.We choose a 2-year period because we believe it is long enough for investors to gain a full understanding of whether a firm’s planned investment projects can be implemented and yield results.For successful firms, the start date of the 2-year period is defined as the date on which the prospectus is published.Most unsuccessful firms do not announce the cancellation of offerings or regulatory decisions.Hence,we estimate the date on which investors learn that a stock offering proposal will not be implemented.For successful firms,the average number of days between the shareholder approval date and the prospectus publication date is about 235 days. Because most firms publish their prospectus immediately after receiving regulatory approval,we treat the average time interval between the shareholder approval date and the regulatory decision date as about 235 calendar days.Accordingly,we set the start date of the 2-year period for unsuccessful firms which do not announce the cancellation of their offering plans as the 235th day after the shareholder approval date.For unsuccessful firms that actually announce the cancellation of their offering plans,the start date is set as the date of the cancellation announcement.The year in which a regulatory decision is first known to investors is defined as Year 0.
Following Loughran and Ritter(1995),we match each sample firm with a control firm of similar size to calculate its long-run abnormal stock return.This approach is less vulnerable to the skewness problem and hence yields better-specified statistics for detecting long-run abnormal stock returns in comparison with a reference portfolio approach(Barber and Lyon,1997).For our main analysis,we use the market value of equity as a proxy for firm size.To find a matching firm,on December 31 of Year 0 for a sample firm,we obtain all other firms that do not issue new shares within the 2-year period surrounding the start date of the 2-year event window and rank them by market value of equity.The firm with a market value closest to that of the sample firm is chosen as its matched firm.We calculate both buy-and-hold abnormal stock returns(BHAR)and cumulative abnormal returns(CAR)since financial economists argue that both measures have their merits and drawbacks(Fama,1998;Barber and Lyon,1997).Specifically,BHAR and CAR for sample Firm i from the first month until Month T are calculated in the following way:


where ri,s,tis the raw return for sample Firm i during Month t and ri,c,tis the raw return for the corresponding control firm during Month t.
Fig.2 plots the BHARs and CARs for sample firms.Panels A and B show that successful non-state firms perform significantly better than unsuccessful non-state firms.Panels C and D,however,indicate that successful and unsuccessful state firms do not differ in stock performance after regulatory decisions.
Table 5 reports results of our formal tests.Univariate test results,reported in Panel A,show that neither successful nor unsuccessful state firms have pronounced abnormal stock returns and that the differences in

Fig.2.Stock performance after regulatory decisions.A firm is defined as a successful firm if it successfully offers stock within 1 year of receiving shareholder approval for the proposal and is defined as an unsuccessful firm otherwise.A firm is defined as a state firm if its ultimate controlling shareholder is the government or as a non-state firm if its ultimate controlling shareholders are individuals.BHAR and CAR for sample firm i from the first month until Month T are calculated in the following ways:

where ri,s,tis the tth monthly raw return for sample firm i and ri,c,tis the tth monthly raw return for the corresponding control firm.Panel A (B)plots the average BHAR(CAR)over a 24-month period after regulatory decisions for non-state firms and Panel C(D)plots the average BHAR(CAR)over a 24-month period for state firms.abnormal returns between them are not significant.Meanwhile,successful non-state firms perform signif icantly better than unsuccessful non-state firms.The mean(median)BHAR for successful non-state firms over the 2-year period is 26%(9%),whereas the mean(median)BHAR for unsuccessful non-state firms over the same period is-11%(-3%),and the difference is highly significant at the 0.00 level.The mean(median)CAR for successful non-state firms over the 2-year period is 27%(10%),whereas the mean(median)CAR for unsuccessful non-state firms over the same period is-14%(-8%),and the difference is highly significant at the 0.00 level.
Table 5Stock performance after regulatory decisions.A firm is de fined as a successful firm if it successfully offers stock within 1 year of receiving shareholder approval for the proposal and is de fined as an unsuccessful firm otherwise.A firm is de fined as a state firm if its ultimate controlling shareholder is the government or as a non-state firm if its ultimate controlling shareholders are individuals.BHAR and CAR for sample firm i from the first month until Month T are calculated in the following ways:where ri,s,tis the tth monthly raw return for sample firm i and ri,c,tis the tth monthly raw return for the corresponding control firm.P-values that are 0.10 or smaller are highlighted in bold(two-sided tests).In Panel B,p-values are after correction for heteroskedasticity.

Table 5Stock performance after regulatory decisions.A firm is de fined as a successful firm if it successfully offers stock within 1 year of receiving shareholder approval for the proposal and is de fined as an unsuccessful firm otherwise.A firm is de fined as a state firm if its ultimate controlling shareholder is the government or as a non-state firm if its ultimate controlling shareholders are individuals.BHAR and CAR for sample firm i from the first month until Month T are calculated in the following ways:where ri,s,tis the tth monthly raw return for sample firm i and ri,c,tis the tth monthly raw return for the corresponding control firm.P-values that are 0.10 or smaller are highlighted in bold(two-sided tests).In Panel B,p-values are after correction for heteroskedasticity.
AllNon-state firmsState firms SuccessfulUnsuccessfulDifferenceSuccessfulUnsuccessfulDifference N 7364048383265 Panel A:Univariate analysis Mean buy-and-hold abnormal returns 12-Month1%19%-5%0.010%0%0.87 24-Month1%26%-11%0.000%0%0.95 Median buy-and-hold abnormal returns 12-Month-1%6%-4%0.01-2%0%0.84 24-Month1%9%-3%0.001%1%0.88 Mean cumulative abnormal returns 12-Month0%17%-5%0.010%-2%0.61 24-Month1%27%-14%0.001%0%0.85 Median cumulative abnormal returns 12-Month-2%9%-5%0.02-3%-1%0.99 24-Month0%10%-8%0.00-1%1%0.98 Variable12-Month24-Month BHARCARBHARCAR Estimatep-ValueEstimatep-ValueEstimatep-ValueEstimatep-Value Panel B:Multivariate regressions for the whole sample Intercept-0.040.67-0.040.66-0.110.38-0.080.57 State0.060.240.040.450.120.050.150.05 Success0.240.000.220.010.380.000.420.00 State*Success-0.250.01-0.210.02-0.380.00-0.400.00 Growth in Sales0.010.79-0.010.870.090.140.080.20 Return on Assets0.520.410.390.550.070.93-0.300.72 Market Run-up-0.010.93-0.020.730.020.78-0.060.46 Cash Ratio-0.150.36-0.100.53-0.140.47-0.050.82 Leverage-0.020.880.010.97-0.050.77-0.090.61 Log of Capitalization0.000.120.000.230.000.480.000.49 Period0.020.690.000.980.020.83-0.020.82 N 736736736736 Adj.R-square0.57%0.32%0.83%1.03%
Panel B,Table 5 reports multivariate regression results.The explanatory and control variables are the same as those reported in Table 4.The stock performance of unsuccessful state firms,State,is better than that of unsuccessful non-state firms,and the difference is significant at the 5%level for the 24-month period.The coefficients on Success are positive and significant(0.24,p=0.00 for 12-month and 0.38,p=0.00 for 24-month using BHAR;0.22,p=0.01 for 12-month and 0.42,p=0.00 for 24-month using CAR),suggesting that successful non-state firms perform much better than unsuccessful non-state firms.The coefficients on the interaction between Success and State are significantly negative(-0.25,p=0.01 for 12-month and-0.38;p=0.00 for 24-month using BHAR;-0.21,p=0.02 for 12-month and-0.40,p=0.00 for 24-month using CAR).This result is similar to that based on subsequent investment,suggesting that successful state firms significantly underperform successful non-state firms,again supporting Hypothesis 2.Therefore,the stock performance of non-state firms is sensitive to regulatory decisions,whereas that of state firms is not,even though they are favored in the regulatory screening process.
4.4.Alternative explanation?
Morck et al.(2000),among others,suggest that in certain countries such as China,stock prices do not accurately reflect firm- specific information.It is possible that investors may not be able to differentiate between firms with and without investment opportunities before the release of regulatory decisions and thus price these firms similarly.If the Chinese government successfully distinguishes firms with investment opportunities from those without investment opportunities and approves the former to conduct SEOs,then we observe approved firms investing more than denied firms because the former have more investment opportunities.The regulatory decision also conveys useful information about SEO firms’investment opportunities to the market. Accordingly,investors bid up stock prices of firms approved for SEOs and drive down stock prices of firms denied approval.This argument can explain why successful non-state firms have better long-term stock performance than unsuccessful non-state firms.This argument,however,cannot explain why successful and unsuccessful state firms do not differ significantly in long-term investment and stock performance.In fact, Gul et al.(2010) find that the stock prices of state firms in China are less informative than those of non-state firms.If the above reasoning is true,the difference in the long-run stock performance between successful and unsuccessful state firms should be greater than that between successful and unsuccessful non-state firms,which is contrary to our findings.
5.Extensions and robustness tests
5.1.Debt financing after regulatory decisions
We have argued that state firms have better access to bank credit or/and are more likely to receive government financial support,and thus their performance and investment are less likely to be affected by regulatory decisions regarding equity issuance.In contrast,non-state firms have difficulties getting bank credit,and therefore have to abandon investment opportunities if their SEO applications are rejected.To confirm this conjecture,we examine debt financing after regulatory decisions.The literature on financial development typically examines both total debt financing and long-term debt financing(Demirguc-Kunt and Maksimovic,1998). We thus calculate both the growth in long-term debt and total debt using the following formulas:

Table 6Debt financing after regulatory decisions.A firm is de fined as a successful firm if it successfully offers stock within 1 year of receiving shareholder approval for the proposal and is de fined as an unsuccessful firm otherwise.A firm is de fined as a state firm if its ultimate controlling shareholder is the government or as a private firm if its ultimate controlling shareholders are individuals.Year 0 is the year in which the regulatory decision on a firm’s stock offering proposal is made.Growth in Long-term Debt and Growth in Total Debt are calculated in the following ways:P-values that are 0.10 or smaller are highlighted in bold(two-sided tests).In Panel B,p-values are after correction for heteroskedasticity.

Table 6Debt financing after regulatory decisions.A firm is de fined as a successful firm if it successfully offers stock within 1 year of receiving shareholder approval for the proposal and is de fined as an unsuccessful firm otherwise.A firm is de fined as a state firm if its ultimate controlling shareholder is the government or as a private firm if its ultimate controlling shareholders are individuals.Year 0 is the year in which the regulatory decision on a firm’s stock offering proposal is made.Growth in Long-term Debt and Growth in Total Debt are calculated in the following ways:P-values that are 0.10 or smaller are highlighted in bold(two-sided tests).In Panel B,p-values are after correction for heteroskedasticity.
VariableYear 1Year 2 Growth in Long-term DebtGrowth in DebtGrowth in Long-term DebtGrowth in Debt Estimatep-ValueEstimatep-ValueEstimatep-ValueEstimatep-Value Intercept0.790.010.770.000.040.870.280.05 State0.310.04-0.020.800.220.090.130.04 Success0.370.100.380.000.360.090.310.00 State*Success-0.400.10-0.240.06-0.340.14-0.310.01 Growth in Sales0.170.190.120.060.080.430.020.73 Return on Assets-1.910.18-0.050.95-0.920.541.770.06 Market Run-up-0.890.06-0.540.02-0.650.13-0.520.01 Cash Ratio-0.220.21-0.130.180.250.110.030.71 Leverage-1.000.01-0.920.00-0.020.96-0.480.00 Log of Capitalization0.000.780.000.010.000.810.000.38 Period-0.280.04-0.150.030.230.08-0.080.26 N 736736736736 Adj.R-square1.50%10.95%0.00%6.55%
Because debt financing is also determined by firms’investment opportunities and debt capacities,we control for those variables in Eq.(4).Results are reported in Table 6.We find that that state firms obtain more bank credit after regulatory decisions than non-state firms if both are denied approval to issue equity(coefficient on State is 0.31,p=0.04 for Year 1 and 0.22,p=0.09 for Year 2 using Growth in Long-term Debt;0.13, p=0.04 for Year 2 using Growth in Debt).This potentially explains an earlier finding that the investment and stock performance of state firms are not sensitive to regulatory decisions,while those of non-state firms are. The coefficients on State*Success are mostly negative and significant(-0.41,p=0.10 for Year 1 using Growth in Long-term Debt;-0.24,p=0.06 for Year 1 and-0.31,p=0.01 for Year 2 using Growth in Debt), suggesting that successful state firms borrow less after obtaining equity capital.
Successful non-state firms appear to borrow significantly more than unsuccessful non-state firms(coefficient on Success is 0.37 and p=0.10 in Year 1 and 0.36 and p=0.09 in Year 2 using Growth in Long Term Debt; 0.38 and p=0.00 in Year 1 and 0.31 and p=0.00 in Year 2 using Growth in Debt).This result suggests that regulatory approval enables non-state firms to raise equity capital as well as gain better access to bank credit. As a consequence,their financial constraints are eased,enabling them to grow rapidly.Our result is consistent with Cull and Xu(2005)and Ayyagari et al.(2010)who find that non-state firms with bank financing grow faster than those without.
5.2.Politically connected non-state firms and central versus local state firms
Our results so far demonstrate that non-state firms are discriminated against in the regulatory screening process.Previous studies suggest that political connections bring benefits to connected firms around the world (Fisman,2001;Faccio,2006;Fan et al.,2008;Berkman et al.,2011)and that political connections are associated with inefficiency(Fan et al.,2007;Hung et al.,2011).Is it possible that non-state firms can overcome regulatory discrimination by building political connections?Are state firms controlled by the centralgovernment more likely to pass the regulatory screening process than state firms controlled by local governments?We conduct additional tests to examine these issues.
A non-state firm is identified as having a political connection if one or more of its executives or directors are (were)members of the National People’s Congress(NPC)or the Chinese People’s Political Consultative Conference(CPPCC),hold(held)positions in central ministries or are(were)leaders of national industry organizations.10Boukari et al.(2008)find that in many countries,newly privatized firms have political connections.Therefore,it is possible that some connected non-state firms are former state firms and retain bureaucrats as their executives after the privatization.Industry organizations in China are government-controlled and many of them are actually transformed from former industry administrative ministries.
In our main analysis,state firms are treated as a homogenous group in terms of their strategic importance and their connections with regulators,which may not be the case in reality.The ultimate controlling shareholders of state firms include the central government(including the State Asset Management Bureau or central ministries)and local governments.Firms that are directly controlled by the central government could be more strategically important and thus be treated more favorably in the screening process than those controlled by local governments.Furthermore,firms that are controlled by the central government may have more direct, stronger connections with central regulators than those controlled by local governments.
We run the following logistic regression to assess the impact of political connections on the screening outcome among non-state firms and the impact of central versus local state firms:

where Politically Connected takes a value of one if a non-state firm has a political connection and zero otherwise;Central State takes a value of one if a firm is ultimately controlled by the central government and zero otherwise;Local State takes a value of one if a firm is controlled by a local government and zero otherwise.
Results are reported in Panel A,Table 7.The coefficient on Politically Connected is positive and significant (0.88,p=0.08)and is insignificantly different(Chi-square=0.001,p=0.97)from that on Local State(0.87, p=0.01).Hence,non-state firms with political connections have a significantly greater chance of surviving the screening process than those without political connections.Further,the chance of surviving the screening process for a politically connected non-state firm is comparable to that of a local state owned firm,suggesting that non-state firms can largely overcome regulatory discrimination by building connections to regulators.This result speaks to the value of political connections(Fisman,2001;Faccio,2006;Fan et al.,2008).However, building political connections does not necessarily result in a desirable outcome for non-state firms as a whole because politically connected firms crowd out unconnected firms in the capital allocation process.Panel A, Table 7 also shows that central state firms are marginally significantly more likely(Chi-square=2.56, p=0.11)than local state firms to pass the screening process(1.25,p=0.00 for central state firms versus 0.87,p=0.01 for local state firms).
Based on the above results,when all other variables are held at their sample means,the probability of a central state firm surviving the regulatory screening process is 65%.The probabilities are 56%,56%and 35%for a local state firm,a politically connected non-state firm and a non-politically connected non-state firm,respectively.Therefore,a central state firm has 16%((65%-56%)/56%)more chance to pass the screening process than a local state firm or a politically connected non-state firm,and a politically connected nonstate firm has 60%((56%-35%)/35%)more chance to pass the screening process than a non-politically connected non-state firm.
Panel B,Table 7 presents results on the sensitivity of investment growth to regulatory decisions.There is some evidence(based on growth in PPE in Year 1)that politically connected non-state firms behave in a manner somewhat similar to state firms in that they invest more than their non-connected counterparts if both are denied approval to issue equity(coefficient on Political Connected is 0.15,p=0.03)and that they invest less if they receive approval to raise capital than their non-connected counterparts who also receive approval to raise
capital(coefficient on Political Connected*Success is-0.23,p=0.05).Panel B,Table 7 also shows that local state firms’post-approval investment is similar to that of central state firms.

Table 7Political connections for non-state firms and state versus local state firms.Politically Connected takes a value of 1 if a non-state firm has political connection at the national level and 0 otherwise;a non-state firm is defined to have national-level political connection if one or more of its managers or directors are(were)members of the NPC or the CPPCC,hold(held)positions in central ministries or are(were) leaders of national professional societies or industry organizations.Central State takes a value of 1 if a firm is ultimately controlled by the central government and 0 otherwise.Local State takes a value of 1 if a firm is controlled by a local government and 0 otherwise.P-values that are 0.10 or smaller are highlighted in bold(two-sided tests).In Panels B and C,p-values are after correction for heteroskedasticity.
Panel C,Table 7 presents results on the sensitivity of stock performance to regulatory decisions.There is some limited evidence that politically connected non-state firms perform worse after receiving approval to issue equity than non-politically connected non-state firms that also receive approval(coefficient on Political Connected*Success is-0.40,p=0.04 for 24-month BHAR).Also,after receiving approval to issue equity, both central and local state firms perform worse than non-state firms and central state firms perform worse than local state firms.These results are consistent with non-politically connected non-state firms being the most financially constrained,followed by politically connected non-state firms and then state firms.

Table 7(continued)
5.3.Market reactions to SEO cancellation announcements
Market reactions to SEO cancellation announcements should differ between non-state and state firms if they have differing degrees offinancial constraints.Specifically,market reactions to cancellation announcements made by non-state firms should be worse than those made by state firms because investors likely further discount the possibility that non-state firms will be able to implement their investment projects.Unfortunately, not all firms announce the cancellation of offering proposals.Within our sample,only 9 non-state firms and 42 state firms announced the cancellation of stock offerings after shareholder approval of those proposals.
We define the announcement date as the event day.To control for the impact of information leakage and delayed reactions,we use a 5-day event window from 3 trading days before until 1 day after the announcement date.The size-matched firms defined in the previous section are used as benchmarks to calculate 5-day cumulative abnormal returns(CARs).Untabulated results show that the mean(median)abnormal stock return during the 5-day period surrounding the cancellation announcement for a non-state firm is-1.42%(-1.77%), whereas the stock price of a state-controlled firm climbs by a mean(median)of 1.04%(0.34%)during the same window.The difference between the two groups,2.46%(2.11%),is significant at the 5%(8%)level.Table 8 reports multivariate regression results.The explanatory and control variables are the same as those reported in Tables 4 and 5.Results suggest that market reactions surrounding the cancellation announcements are significantly worse for non-state firms than for state firms(the coefficient on State is 0.03,p=0.06).Market reactions are more negative for firms with good investment opportunities(coefficient on Growth in Sales is-0.05, p=0.08)and for firms with less cash on hand(coefficient on Cash Ratio is 0.16;p=0.00).The results suggest that firms with more financial constraints and more investment opportunities are more adversely affected by unsuccessful stock offerings.
5.4.Further attempt to mitigate the endogeneity concern
To further mitigate the endogeneity concern,we follow Faulkender and Petersen(2009)and decompose Success into two components,the predicted probability of passing the screening obtained in Model(1) (Prob(Success))and the residual defined as the difference between Success and Prob(Success)(Residual(Success)).Residual(Success)represents the unpredicted portion of a shock to capital availability and thus the
coefficient on it can better capture the impact offinancial constraints on firm investment and stock performance.Similar to Faulkender and Petersen(2009),we include proxies for investment opportunities(Growth in Sales),operating cash flow(Return on Assets)and firm size(Log of Capitalization).

Table 8Market reaction to stock offering cancellation announcements.A firm is defined as a state firm if its ultimate controlling shareholder is the government or as a non-state firm if its ultimate controlling shareholders are individuals.Cumulative abnormal return(CAR)is the sum of the difference between a sample firm and its size-matched firm in terms of the daily stock return from 3 trading days before to 1 trading day after the event day,where the event day is the day on which the offering proposal cancellation announcement is made.P-values after correction for heteroskedasticity that are 0.10 or smaller are highlighted in bold(two-sided tests).

Table 9Alternative approach to address the endogeneity issue.A firm is defined as a state firm if its ultimate controlling shareholder is the government or as a non-state firm if its ultimate controlling shareholders are individuals.Prob(Success)is the predicted probability of passing the screening based on Model(1),and Residual(Success)is the difference between Success and Prob(Success).P-values after correction for heteroskedasticity that are 0.10 or smaller are highlighted in bold(two-sided tests).
We report results in Table 9.The predicted component of Success,Prob(Success),is in general positively associated with investment growth(Panel A)but is not associated with stock returns(Panel B).There is also some limited evidence that the effect of Prob(Success)on investment growth and stock returns is smaller for state firms than for non-state firms(coefficients on Prob(Success)*State are-0.13,p=0.01 for Growth in Assets in Year 1;-0.14,p=0.07 for 12-month BHAR;-0.12,p=0.09 for 12-month CAR).These results suggest that regulatory decisions regarding SEO applications are somewhat related to the investment opportunities individual firms have and thus highlights the importance of including the determinants of the screening outcome in the investment and stock performance models,as is done in the main analysis section.
The more interesting results are on the unpredicted component of Success,Residual(Success).The coefficients on Residual(Success)are positive and significant except for the 24-month BHAR and the coefficients on Residual(Success)*State are negative and negative except for Growth in PPE in Year 1.These results suggest that an unpredicted approval boosts investment significantly for non-state firms but not for state firms, supporting Hypothesis 2.To the extent that Residual(Success)largely captures an exogenous shock to capital availability and that the two types offirms have different levels offinancial constraints,findings here are robust evidence that financial constraints affect firm investment and stock performance.
5.5.Robustness analyses
5.5.1.Alternative benchmarks for calculating abnormal stock returns
We use equal-or value-weighted market portfolios as benchmarks.We also use total sales or total assets as a proxy for size to determine the size-matched non-SEO firms.Untabulated results obtained using these benchmarks are qualitatively similar to those in our main analysis.
5.5.2.Including firms that cancel offering proposals before shareholder approval
In arriving at the final sample,we exclude firms that announced stock offering plans and then withdrew such plans before the relevant shareholder meetings.To the extent that these firms might have withdrawn their offering plans under pressure from regulators,the results we describe above may underestimate the percentage offirms that are screened out by regulators.Iffirms withdrawing their applications have characteristics different from those that do not withdraw but fail to pass regulatory screening,then results in Table 3 could be biased.Untabulated results show that after the inclusion of the 44 firms that withdrew their offering plans before forwarding them to shareholder meetings,our inferences remain largely unchanged.
5.5.3.Including industry dummies as determinants of regulatory decisions
Non-state and state firms may have different industry distributions.It is possible that governments may support some industries more than others.To determine the robustness of our results,we add industry dummies and re-run Model(1).We follow industry classifications issued by the CSRC and divide sample firms into 22 industries.Untabulated results show that the coefficient on State remains significantly positive(0.73, p=0.01)after the inclusion of 21 industry dummies.
5.5.4.Using Tobin’s Q as a proxy for investment opportunities
We next replace Growth in Sales with Tobin’s Q in the investment regressions.Main results are qualitatively similar(untabulated).Take Growth in PPE in the first year as an example.The coefficient on State is 0.08 (p=0.08).The coefficient on Success is 0.27(p=0.00),while the coefficient on State*Success is-0.26 (p=0.00).
6.Conclusion
In this study we examine the effect of state control on firms’access to capital in China,where the government controls the equity capital allocation process.We also examine the consequences of thisgovernmental control.We find that state firms are more likely to receive regulatory approval to issue new equity than non-state firms.Non-state firms exhibit greater sensitivities to regulatory decisions as reflected in their post-decision investment growth and stock performance than state firms.This result implies that non-state firms,being more financially constrained than state firms,should benefit more from being able to raise equity capital.Collectively,findings in this study suggest that the screening process leads to capital misallocation and impedes the growth of non-state firms.We provide robust evidence that politicalinterventionresultsincapitalallocationinefficiencyandthatfinancingfrictionscause underinvestment.
We also show that non-state firms with political connections are more likely to receive approval to issue new equity than unconnected non-state firms.The likelihood of a politically connected non-state firm passing the regulatory screening process is comparable to that of a state firm.We thus provide direct evidence that politically connected firms in the private sector benefit from favorable regulatory treatment,which gives non-state firms strong incentives to build such connections.
Our paper is relevant to the current debate about the role of the government in the economy amid a global financial and economic crisis.Our results suggest inefficiency and misallocation of resources due to government ownership or government intervention.While the economic and institutional setting in China is different to that of developed countries and we are hesitant to extrapolate excessively,results from our analysis should be of reference and use to these economies.An important lesson from the current financial crisis is that financing frictions are real and of first-order importance(Kashyap and Zingales,2010).Our work helps researchers and regulators better understand this issue.
The Chinese government established the Medium and Small Enterprise Listing Board in late 2004 and the Growth Enterprise Board in 2009.As a result,many non-state firms are now allowed to access the stock market to raise capital.Our work suggests that this development could ease financial constraints for nonstate firms and result in faster growth.Future research can further explore this issue based on this new development.
Despite the fact that the Chinese government has significantly improved equality in capital allocation in recent years,it is still widely believed that private entrepreneurs face serious obstacles in obtaining capital (China Financial and Economic News,March 6,2009).Our study generates useful implications to policymakers and supports financial reforms that further promote equal access to capital for firms with different ownership status.
Acknowledgements
We thank Sudipta Basu,Jeffrey Callen,Guohua Jiang,Bin Ke,Sidney Leung,Randall Morck,Saif Ullah,Joseph Weintrop and seminar participants at the City University of Hong Kong,the Shanghai University of Finance and Economics and the 2009 International Conference on Corporate Finance and Governance in Emerging Markets for their helpful comments and suggestions.Zhifeng Yang acknowledges a Strategic Research Grant received from the City University of Hong Kong(Grant No.7200080).
Appendix A.CSRC guidelines on SEOs
Requirements for rights issues listed in CSRC[1999]12,for example,include:
1.The listed company should be independent from its controlling shareholder in terms of its staf f,property,and finance.
2.The applicant’s corporate charter should be in compliance with the Company Law.
3.The use of capital raised should be consistent with the state’s industrial policies.
4.There should be at least one complete fiscal year between a new application and the previous successful equity offering.
5.The average ROE in the 3 years before the year of application should be no lower than 10%and the ROE should be no lower than 6%in any of the three previous years.The minimum average ROE can be lowered to 9%for applicants in the agriculture,energy,raw materials,infrastructure,and high-tech industries.
6.The applicant should not have any record of material accounting fraud or negligence in the past 3 years.
7.The forecast ROE after an offering should be no lower than the interest rate for bank deposits over the same period.
8.Only common stock can be issued and new shares should be issued to existing shareholders only.
9.The number of new shares issued cannot usually be more than 30%of the number of outstanding shares before an offering.
These guidelines also list some negative conditions that may lead to the denial of SEO applications.The negative criteria specified in CSRC[1999]12 are as follows:
1.Failure to fulfill information disclosure obligations as required by laws and regulations.
2.Having a record of any material legal or regulatory violation in the past 3 years.
3.Using capital raised in the last offering in a manner inconsistent with the purpose stated in the prospectus.
4.Failure to conduct the shareholders meeting in the manner required by the Company Law.
5.Including misleading statements in the application.
6.Setting the offer price lower than the net asset value per share.
7.Providing collateral for bank loans to its shareholders or other individuals.
8.Any significant related-party transaction between the applicant and its c ontrolling shareholder that clearly hurts the interests of minority shareholders or occupation of the applicant’s property or funds by the controlling shareholder.
Other than for the profitability requirements,the positive and negative criteria specified in the various guidelines are mostly the same.

Appendix B.Variable definitions

Appendix B(continued)
Aghion,P.,Bolton,P.,1997.A theory of trickle-down growth and development.Review of Economic Studies 64,151-172.
Allen,F.,Qian,J.,Qian,M.,2005.Law,finance,and economic growth in China.Journal of Financial Economics 77,57-116.
Almeida,H.,Campello,M.,2010.Financing frictions and the substitution between internal and external funds.Journal of Financial and Quantitative Analysis 45(3),589-622.
Ayyagari,M.,Demirguc-Kunt,A.,Maksimovic,V.,2010.Formal versus informal finance:evidence from China.Review of Financial Studies 27,3048-3097.
Barber,B.M.,Lyon,J.D.,1997.Detecting long-run abnormal stock returns:the empirical power and specification of test statistics.Journal of Financial Economics 43,341-372.
Berkman,H.,Cole,R.A.,Fu,J.L.,2011.Political connection and minority-shareholder protection:evidence from securities-market regulation in China.Journal of Financial and Quantitative Analysis 45(6),1391-1417.
Booth,L.,Aivazian,V.,Demirguc-Kunt,A.,Maksimovic,V.,2001.Capital structures in developing countries.Journal of Finance 56(1), 87-130.
Bortolotti,B.,Faccio,M.,2009.Government control of privatized firms.Review of Financial Studies 22(8),2907-2939.
Boukari,N.,Cosset,J.,Saffar,W.,2008.Political connections of newly privatized firms.Journal of Corporate Finance 14(5),654-673.
Brandt,L.,Li,H.,2003.Bank discrimination in transition economies:ideology,information or incentives?Journal of Comparative Economics 37,387-413.
Campello,M.,Graham,J.R.,Harvey,C.R.,2010.The real effects offinancial constraints:evidence from a financial crisis.Journal of Financial Economics 97(3),470-487.
Chen,K.C.W.,Yuan,H.,2004.Earnings management and capital resource allocation:evidence from China’s accounting-based regulation of rights issues.Accounting Review 79,645-665.
Chen,Z.,Ke,B.,Yang,Z.,2011.Does granting minority shareholders direct control Over corporate decisions help reduce value decreasing corporate decisions?A natural experiment from China(working paper).SSRN:<http://ssrn.com/abstract=1602868>.
China Securities Regulatory Commission(CSRC),1999.Notice about some issues regarding rights offerings by listed firms(in Chinese).
China Securities Regulatory Commission(CSRC),2000.Interim measures for general offerings by listed firms(in Chinese).
China Securities Regulatory Commission(CSRC),2001.Notice about measures for seasoned equity offerings by listed firms(in Chinese).
Claessens,S.,Perotti,E.,2007.Finance and inequality:channels and evidence.Journal of Comparative Economics 35,748-773.
Claessens,S.,Feijen,E.,Laeven,L.,2008.Political connections and preferential access to finance:the role of campaign contributions. Journal of Financial Economics 88,554-580.
Clarke,J.,Dunbar,C.,Kahle,K.M.,2001.Long-run performance and insider trading in completed and canceled seasoned equity offerings.Journal of Financial and Quantitative Analysis 36,415-430.
Cull,R.,Xu,L.C.,2005.Institutions,ownership,and finance:the determinants of profit reinvestment among Chinese firms.Journal of Financial Economics 77,117-146.
Demirguc-Kunt,A.,Maksimovic,V.,1998.Law,finance,and firm growth.Journal of Finance 53,2107-2137.
Desai,M.A.,Foley,C.F.,Forbes,K.J.,2008.Financial constraints and growth:multinational and local firm responses to currency depreciations.Review of Financial Studies 21,2857-2888.
Dinc,I.S.,2005.Politicians and banks:political influences on government-owned banks in emerging markets.Journal of Financial Economics 77,453-479.
Duchin,R.,Ozbas,O.,Sensoy,B.,2010.Costly external finance,corporate investment,and the subprime mortgage credit crisis.Journal of Financial Economics 97(3),418-435.
Durnev,A.,Kim,E.H.,2005.To steal or not to steal:firm attributes,legal environment,and valuation.Journal of Finance 60,1461-1493.
Faccio,M.,2006.Politically connected firms.American Economic Review(March),369-386.
Faccio,M.,Parsley,D.C.,2009.Sudden deaths:Taking stock of geographic ties.Journal of Financial and Quantitative Analysis 44(3), 683-718.
Faccio,M.,Masulis,R.W.,McConnell,John J.,2006.Political connections and corporate bailouts.Journal of Finance 61,2597-2635.
Fama,E.F.,1998.Market efficiency,long-term returns,and behavioral finance.Journal of Financial Economics 49,283-306.
Fan,J.,Wong,T.J.,Zhang,T.,2007.Politically connected CEOs,corporate governance,and post-IPO performance of China’s newly partially privatized firms.Journal of Financial Economics 84,330-357.
Fan,J.P.H.,Rui,O.,Zhao,M.,2008.Public governance and corporate finance:evidence from corruption cases.Journal of Comparative Economics 36,343-364.
Faulkender,M.,Petersen,M.,2009.Investment and Capital Constraints:Repatriations Under the American Jobs Creation Act. University of Maryland and Northwestern University(Working paper).
Fazzari,S.M.,Hubbard,R.G.,Petersen,B.C.,1988.Financing constraints and corporate investment.Brookings Papers on Economic Activity No.1,141-206.
Fisman,R.,2001.Estimating the value of political connections.American Economic Review 91(4),1095-1102.
Galor,O.,Moav,O.,2004.From physical to human capital accumulation:inequality and the process of development.Review of Economic Studies 71,1001-1026.
Galor,O.,Zeira,J.,1993.Income distribution and macroeconomics.Review of Economic Studies 60,35-52.
Gul,F.,Kim,J.,Qiu,A.,2010.Ownership concentration,foreign shareholding,audit quality,and stock price synchronicity:evidence from China.Journal of Financial Economics 95,425-442.
Hung,M.,Wong,T.J.,Zhang,T.,2011.Political considerations in the decision of Chinese SOEs to list in Hong Kong.Journal of Accounting and Economics 53,435-449.
Johnson,S.,Mitton,T.,2003.Cronyism and capital controls:evidence from Malaysia.Journal of Financial Economics 67(2),351-382.
Kaplan,S.N.,Zingales,L.,2000.Investment-cash flow sensitivities are not valid measures offinancing constraints.Quarterly Journal of Economics(May),707-712.
Kashyap,A.,Zingales,L.,2010.The 2007-8 financial crisis:lessons from corporate finance.Journal of Financial Economics 97(3),303-305.
Khwaja,A.I.,Mian,A.,2005.Do lenders favor politically connected firms?Rent provision in an emerging financial market.Quarterly Journal of Economics 120(4),1371-1411.
La Porta,R.,Lopez-de-Silanes,F.,Shleifer,A.,2002.Government ownership of banks.Journal of Finance 57(1),265-301.
Lang,L.,Ofek,E.,Stulz,R.M.,1996.Leverage,investment,and firm growth.Journal of Financial Economics 40,3-30.
Leuz,C.,Oberholzer-Gee,F.,2006.Political relationships,global financing,and corporate transparency:evidence from Indonesia. Journal of Financial Economics 81,411-439.
Li,H.,Meng,L.,Wang,Q.,Zhou,L.,2007.Political connections,financing and firm performance:evidence from Chinese private firms. Journal of Public Economics 87,283-299.
Loughran,T.,Ritter,J.,1995.The new issues puzzle.Journal of Finance 49(March),23-51.
Morck,R.,Shleifer,A.,Vishny,R.,1988.Management ownership and market valuation:an empirical analysis.Journal of Financial Economics 20,293-315.
Morck,R.,Yeung,B.,Yu,W.,2000.The information content of stock markets:why do emerging markets have synchronous stock price movement?Journal of Financial Economic 58,215-260.
Myers,S.C.,2003.Financing of corporations.In:Constantinides,G.M.,Harris,M.,Stulz,R.(Eds.),Handbook of the Economics of Finance.
Pastor,L.,Veronesi,P.,2005.Rational IPO waves.Journal of Finance 60(4),1713-1757.
Sapienza,P.,2004.The effects of government ownership on bank lending.Journal of Financial Economics 72(2),357-384.
Stein,J.C.,2003.Agency,information and corporate investment.In:Constantinides,G.M.,Harris,M.,Stulz,R.(Eds.),Handbook of the Economics of Finance.
Wang,Q.,Wong,T.J.,Xia,L.,2008.State ownership,the institutional environment,and auditor choice:evidence from China.Journal of Accounting and Economics 46,112-134.
Zia,B.H.,2008.Export incentives,financial constraints,and the(mis)allocation of credit:micro-level evidence from subsidized export loans.Journal of Financial Economics 87,498-527.
9 May 2012
*Corresponding author.
E-mail addresses:bizzhenl@nus.edu.sg(O.Z.Li),suxijia@ceibs.edu(X.Su),zhifeng@cityu.edu.hk(Z.Yang).
 China Journal of Accounting Research2012年2期
- China Journal of Accounting Research的其它文章
- The reform of accounting standards and audit pricing
- Board independence,internal information environment and voluntary disclosure of auditors’reports on internal controls
- Relative performance evaluation and executive compensation: Evidence from Chinese listed companies
- Government auditing and corruption control:Evidence from China’s provincial panel data