
Flame Imaging in Meso-scale Porous Media Burner Using Electrical Capacitance Tomography*
2012-10-31 03:35CHENQi陈琪andLIUShi刘石SchoolofMechanicalElectronicandControlEngineeringBeijingJiaotongUniversityBeijing100044ChinaStateKeyLaboratoryofAlternateElectricalPowerSystemwithRenewableEnergySourcesNorthChinaElectricPowerUniversit
CHEN Qi (陈琪)** and LIU Shi (刘石) School of Mechanical Electronic and Control Engineering, Beijing Jiaotong University, Beijing 100044, China State Key Laboratory of Alternate Electrical Power System with Renewable Energy Sources, North China Electric Power University, Beijing 1006, China
Flame Imaging in Meso-scale Porous Media Burner Using Electrical Capacitance Tomography*
CHEN Qi (陈琪)1,** and LIU Shi (刘石)21School of Mechanical Electronic and Control Engineering, Beijing Jiaotong University, Beijing 100044, China2State Key Laboratory of Alternate Electrical Power System with Renewable Energy Sources, North China Electric Power University, Beijing 102206, China
This study was conducted to investigate the characteristics of meso-scale combustion. The technique of electrical capacitance tomography (ECT) was used to locate flame position and monitor the effect corresponding to varied air/fuel ratio in a meso-scale combustor. Combustion phenomena including igniting, quenching and unsteady combustion have been visualized using ECT. The method of metallization protecting ECT sensor from high temperature damage and the novel calibration method adapted to ECT monitoring of unknown permittivity flame have been shown to be successful. At the same time, electrical nature of combustion and dielectric characteristics of hydrocarbon flame were studied. The relationship between flame permittivity and state parameters of combustion gas was demonstrated preliminarily.
electrical capacitance tomography, meso-scale burner, combustion, flame permittivity
1 INTRODUCTION
Since the concept of micro-heat engine was proposed by Epstein and Senturia [1], a series of miniaturized devices have been put forward such as the microgas turbine [2], MEMS IC engine [3, 4], and the micro-thermophotovoltaic (TPV) system [5], because of the high-energy density of micro-power system. Micro-combustor is one of the key components for various micro-power systems in which the mixture of fuel and oxygen is burned [6]. There are numerous difficulties when the characteristic size of micro- combustor reduces to millimeter or sub-millimeter scale. For example, flame extinguishing often occurs due to heat loss when the dimension of the combustion chamber becomes too small. Even if flame quenching does not occur, heat and friction losses become increasingly important due to the large surface area-volume ratio and the restriction of the machine manufacturing craft at smaller scales. Still, flames extinguishing can be overcome to some extent if proper methods are adopted, for example, choosing fuel type and plating catalyst on the surface of burner. Also, embedding porous media in a smaller chamber is brought forward in this paper to conquer flame extinguishing and improve combustion efficiency [7].
As a new measurement technique, electrical capacitance tomography (ECT) has been widely developed in recent years [8, 9]. Research work has proved that ECT technique is one of the most promising methods for combustion study because of its non-intrusiveness, reliability, simplicity and high-speed capabilities. It has been used to achieve real-time visualization of one or multiple flames in a combustor[10, 11]. Because it is difficult to obtain steady flame images in micro-scale burner, we have chosen to build meso-scale gas turbine without rotating devices, which is more readily instrumented. For the meso-scale test devices, burner dimension φ50 mm×10 mm was built using ceramic.
The aim of this present work is to establish a visualization measurement system for meso-scale porous media combustion using an ECT system. A 12-Electrode ECT system is used to acquire the meso-scale combustion information. Different combustion characteristics in the burner are visualized and analyzed. A method of metallization protecting the ECT sensor from high temperature damage and a novel calibration method adapted to ECT monitoring of unknown permittivity of flames are shown in this paper. At the same time, the electric nature of combustion and the imaging principle are also detected.
2 ECT SYSTEM AND RECONSTRUCTION ALGORITHM
Electrical capacitance tomography (ECT) is a method for determination of the dielectric permittivity distribution in the interior of an object from external capacitance measurements. It is a close relative of medical CT and is proposed as a method for industrial process monitoring. As shown in Fig. 1, the ECT systemincludes three main components: the capacitance sensor, signal logging hardware and processing computer.
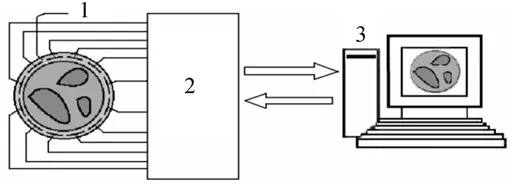
Figure 1 ECT system1—sensors; 2—data acquisition hardware; 3—computer
The objective of ECT is to reconstruct object images according to the capacitances obtained by electrode pairs. For a sensor with r electrodes, the total number of independent capacitance measurements is.The capacitance measurements vector can be given as C=(C1, C2, ··, Cm)T. G=(G1, G2, ··, Gn)Tis the vector of grey levels and the subscript n is the number of pixels. The mathematical model for image reconstruction of ECT can be linearly given as

where S ∈ Rm×nis a coefficient matrix. The value of S can be obtained using finite-element method (FEM).
The most important problem in ECT is how to acquire G from measured C. Hence, the study of image reconstruction methods is treated as a major aspect during ECT development.
In the linear-back-projection (LBP) algorithm, an image is reconstructed by

where ST∈Rn×mis the transpose of S.
The commonly used LBP method is simple and fast, but unable to treat complex object distributions[12]. Various reconstruction techniques have been developed over the years. Among them is the Landweber iteration method which is the most successfully used one for ECT. It can be expressed by two equations [13]:
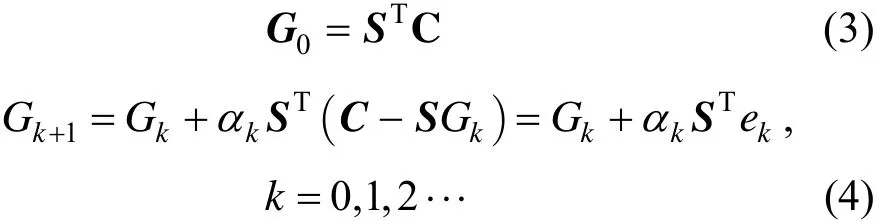
In each step during the iteration process, Gkis corrected by adding a term αST(C − SG) to form a
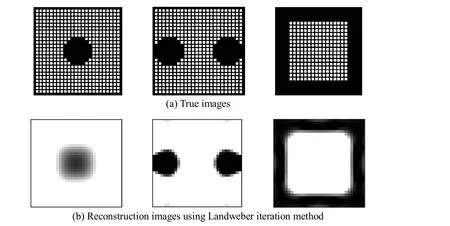
Figure 2 Images in a porous media with inner small channels
k k new image Gk+1. The term ek=C−SGkis the error between the measured C and the calculated capacitance. The term ST(C −) is regarded as an error image used to correct the next image.kα is the step length, and its value ranges from 0 to 2. The process continues until a certain criterion is met, e.g.< 0 .001, where2means 2-norm.
FEM simulation of flame images reconstruction using the Landweber iteration method has been carried out, as shown in Fig. 2. The true images are much more complicated in structure because of porous media located in the measurement zone. Porous media structure has been ignored and is being treated as a background object during the image reconstruction.The quality of reconstruction images is very good and the Landweber iteration method is decided upon for flame monitoring in this work.
3 MECHANISM OF ECT SENSING OF THE FLAME
3.1 Dielectric permittivity of hydrocarbon flames At macroscopic scale, electrons in hydrocarbon flames have a directed motion, a drift in the direction of the electric field impressed by ECT sensors. If the imposed electric field and the thermal energy are not high enough to distort the Maxwellian energy distribution, the equation of motion for an average electron in the slightly ionized hydrocarbon flames is given as
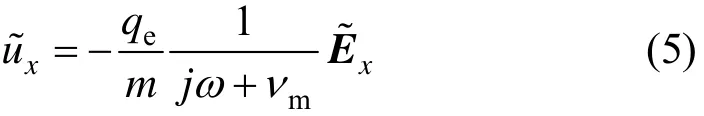
wherexu~ is the drift velocity of an average electron;m andeq are mass and charge of an electron charge;νmis the electron-neutral particle collision frequency;E~xis electric field vector. To solve equation for u~x,E~xand u~xare assumed to vary as eiωt.
The following relation relates the drift velocity of an average electron to the conduction current density:

where neis the number of electrons. Total current density is given as
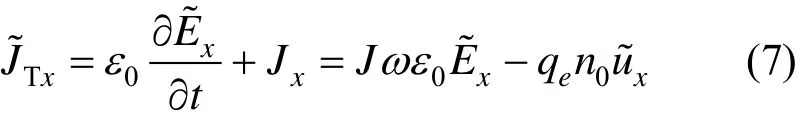
Eqs. (5) and (7) reduce to
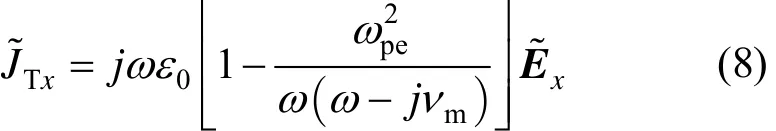
wherepeω is plasma collision frequency. Eq. (8) depicts the relationship between total current density and electric field. The relative dielectric permittivity for hydrocarbon flames is given as

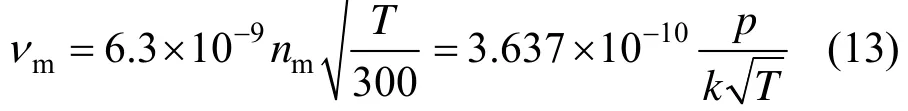
The power supply frequency is about 20 kHz,therefore at radio wave frequencies ω ≪νm. Eq. (9)reduces to
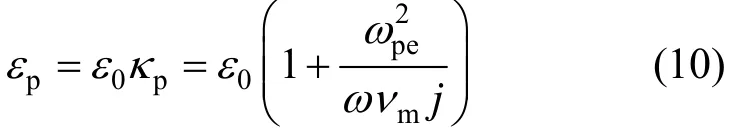
wherepκ is relative permittivity,0ε is dielectric constant. Also2pω can be written as
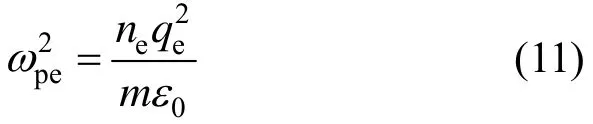
The following relation relates various thermodynamic parameters at local equilibrium system:

where p, V and T are pressure, volume and temperature in the slightly ionized gaseous medium, and ngis numeral density of neutral particles. If hydrocarbon flames are assumed to low-temperature plasma [14],electron-neutral particle collision frequency can be written as
where k is Boltzmann constant.
Substituting Eqs. (11) and (13) into Eq. (10)gives
So, we can draw the conclusion that flame relative permittivity is closely related to the state parameters of the combustion gas including temperature, pressure and so on.
3.2 Migration of charged particles under ECT excitation
Traditionally, combustion processes have been diagnosed by optical means, such as Schlieren, shadow,interferometric, holographic and LIF [15-17]. However,the optical access requirement and low pulse frequency of lasers limit their application in a small and complicated burner. Moreover, it is difficult to obtain a 2D image of a time-varying combusting process.
As we known, a great amount of ions can be found in most combustion systems. The phenomenon of ionization in flames is well understood and its detection has been investigated since mid-1960s [18].The ionization in flame is detected by the measurement of current at known potential difference. There is strong experimental evidence to show that the flame ionization effect is a state parameter of the combustion gas. The relationship between current and flame temperature can be measured using the Langmuir probe zone [19].
A greatly promising technique of analyzing the electrical nature of combustion and obtaining 2D flame images is ECT, which determines the dielectric permittivity distribution in the interior of flames by the measurements of capacitance changes between each electrode pairs. Capacitances below 10-15 μF can be detected by high speed electric circuits. Tests conducted by UMIST [10, 11] have shown that the flame distribution varying with time and space can be detected using ECT. The electric nature and dielectric permittivity of combustion will be briefly analyzed below.
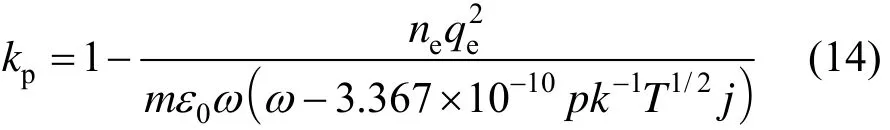
When a mixture of fuel and oxygen is burned, a great number of charged particles, ions and free electrons are generated. Commonly, inter-electrode capacitances are measured by applying an AC excitation voltage to an electrode and measuring the resulting currents from the detection electrodes. Hence, charged particles, ions and free electrons will have regular movement. Negatively charged particles and free electrons will move toward the excitation electrode(electrode 1 in Fig. 3). Still, positively charged particles and ions will move toward other detection electrodes (electrode 2-12 in Fig. 3). At the same time,numerous induced electric dipoles appear in the reaction zone which will modify the dielectric permittivity of the combustion zone to a certain extend. But in general, the effect of electric charge movement on the permittivity change plays a predominant role.
The basic measuring circuit used by ECT system is shown in Fig. 4. The amplifier A plays a role as integrator which collects electric charge passing through the unknown capacitorxC during the time interval of imaging. When the sine signal generator (peak value typically ±15 V) is connected to the inverting input of the amplifier, a current,inI, will flow into the integrator.The electric charge passing through the capacitorxC can be treated maintaining at peak value because of the high frequency of AC circuit. Thus, the relationship betweenxC and0()V t is given as
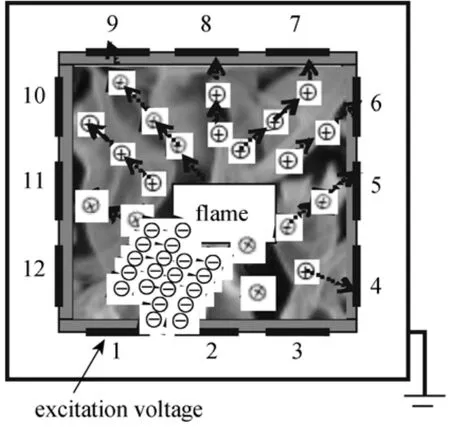
Figure 3 Electric nature of combustion excited by ECT electrodes
Figure 4 The basic measuring circuit by ECT

wherexC is the unknown capacitance, A is the amplification factor, constant,inI is the current, t is the time of imaging,0()V t is the output voltage.
As noted above, a combustion process can be detected by using of ionization probes, e.g. Langmuir probe, which is sensitive to the measured current caused by flame ionization. As we known, the flame ionization effect is a state parameter of the combustion gas. So,inI is a function of state parameters of the combustion gas including temperature, pressure and so on. Iincan be written as Iin= F (T,p,φ ··), where T, p and separately refer to the temperature, pressure and air/fuel ratio of combustion gas.
Hence, Eq. (15) has another form:

From Eq. (16) we found that there exist a nonlinear relationship betweenxC and state parameters of the combustion gas if0()V t and t are known. As the area and separation of capacitive places are known, the capacitance measurementxC is directly proportional to the dielectric permittivity between the plates.
4 EXPERIMENTAL SET-UP AND CALIBRATION METHOD
Ceramic ware was chosen as combustion chamber material because of its excellent heat-resistance and insulating property. Still, the temperature of outer wall would exceed 400 ºC and traditional methods of sensor construction cannot be applied. Therefore, a method of metallization [20] was used to avoid sensor damage by high temperature. The novel ECT sensors can successfully operate due to its strong induction,low noise, stable capacitance and high temperature resistance.
The capacitance sensor, including an array of 12 contiguous copper electrodes, was metallized around the cross-section of a meso-scale burner. In order to obtain high resolution of the flame images, the electrodes were set 9 mm in height in the direction of the burner axis, each being 10 mm wide around the perimeter, as shown in Fig. 5 (a). Outside diameter of metallic shield is 55 mm and its thickness is 1 mm.One port of signal wire is linked with copper electrode.Metallic shield was used to elimination external interference for getting stable signals, shown as in Fig. 5 (b).
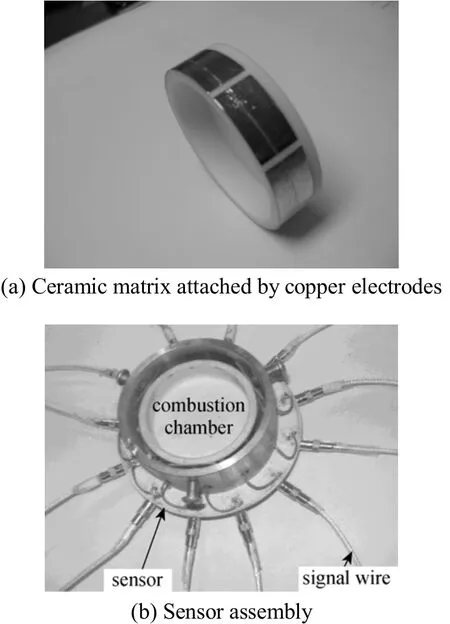
Figure 5 ECT sensor photo
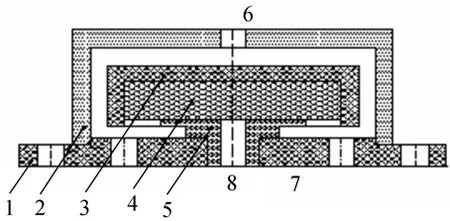
Figure 6 Sectional view of meso-scale porous burner1—ceramics base; 2—outer covering; 3—combustion chamber;4—porous media; 5—exhaust pipe; 6—air inlet; 7—fuel inlet;8—exhaust
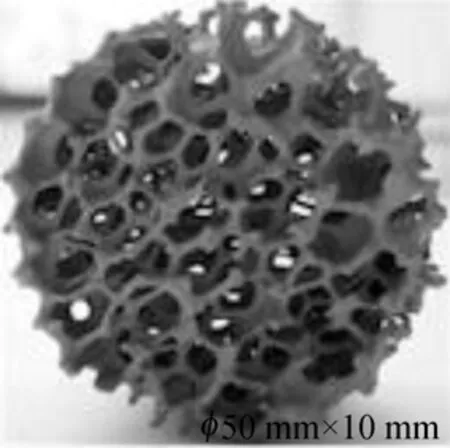
Figure 7 Photograph of porous media
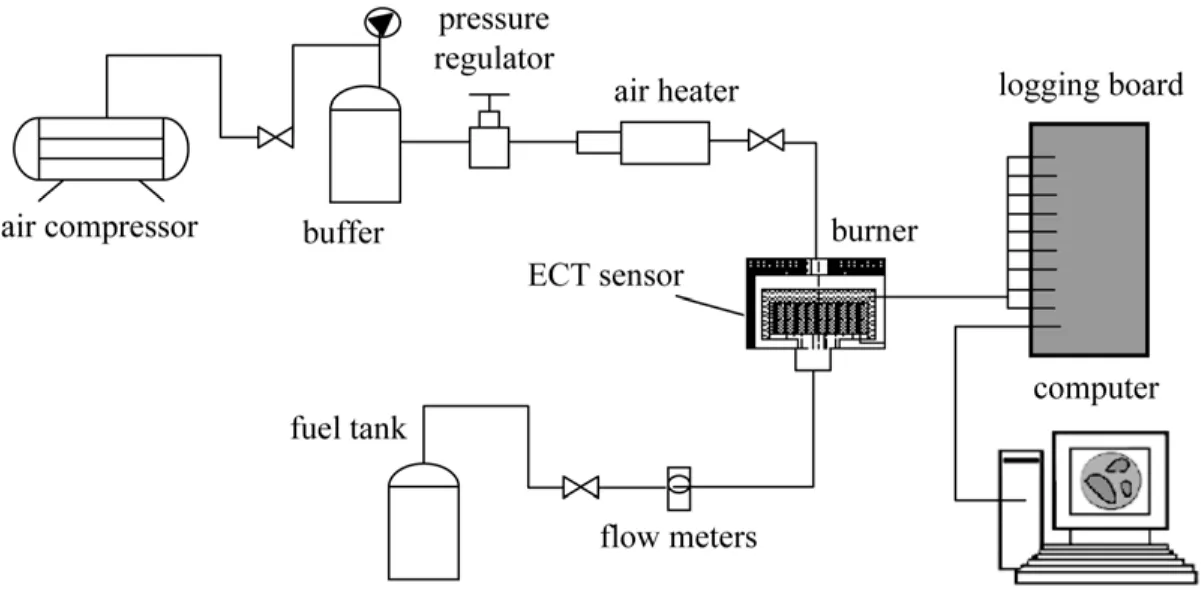
Figure 8 System outline and experimental set-up
A meso-scale porous burner is shown in Fig. 6.The size of the combustion chamber is φ50 mm×10 mm and the air inlet, fuel inlet and exhaust have the same dimension of φ6 mm. Air passage is constructed by combustion chamber and metallic shield. Exhaust is situated at the bottom of meso-scale combustor. The homogeneous SiC porous media with porosity of 20 pores per inch is embedded in combustion chamber and it has the same dimension of φ50 mm×10 mm, as shown in Fig. 7.
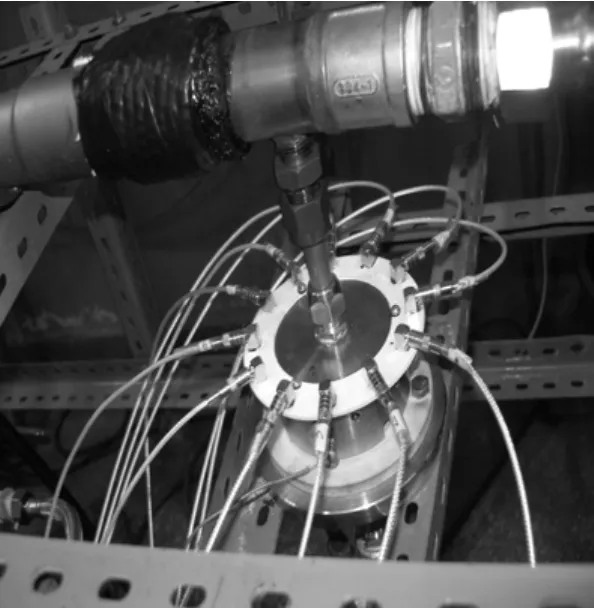
Figure 9 Photograph of burner and sensor assembly
The experimental set-up is sketched in Figs. 8 and 9. Methane fuel is fed into the meso-scale porous media burner from the bottom inlet. Pressure-regulated air was preheated and fed from the top inlet into the burner. Flow rates of fuel and air were separately adjusted by control valves for the required air/fuel ratio and flame size. When the fuel and oxygen were ignited by the igniting needle embedded near the fuel inlet, the flame spread over the porous media. A circular ECT sensor with 12 electrodes located around the meso-scale burner was used to detect the electric signal caused by the combustion process, and clear flame images were obtained with the Landweber iterative algorithm.
In general, an ECT sensor is calibrated with a lower permittivity material and a higher permittivity material to obtain the full range of variation in the measured capacitance. This calibration process may be called “two-point method” [21]. The lower value is taken with the sensor empty and the upper value is taken with the sensor filled with wet sands of high permittivity. Once the calibration has been completed,the ECT system may image the higher permittivity material in the lower permittivity background.
As we known, there is correlation between flame permittivity and the operating parameters of the combustion gas including temperature, pressure, air/fuel ratio and so on. It becomes difficult to choose a higher permittivity material to achieve the full range of variation because the flame permittivity distributions are not continuous in space and time. Therefore, a novel calibration method was designed in our work. Firstly,calibration data for the lower point was obtained with only the porous media in the measuring zone. From our past experiences, we found that a small variation of humidity in sands could yield a significant difference in permittivity. Then, the upper calibration point was obtained with fine sands of known permittivity over ranges of humidity until all the signals acquired by the ECT system yielded unsaturated values. The permittivity values of sands with different humidities calculated by the weighted average method are shown in Table 1.
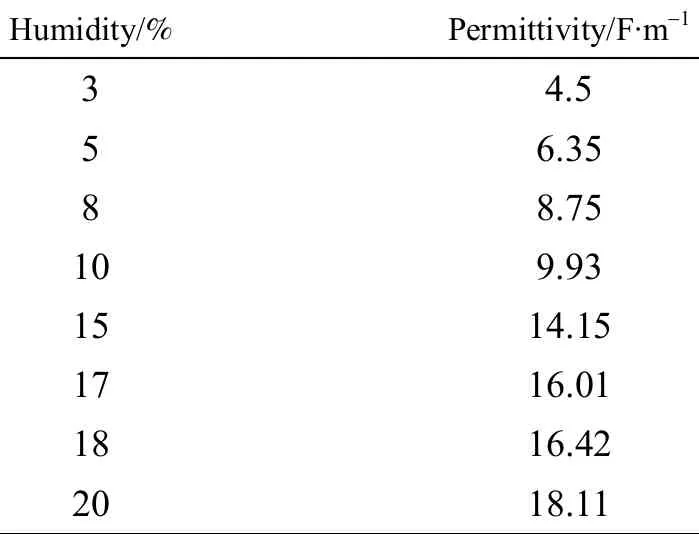
Table 1 The permittivity values of wet sands with different humidity
5 RESULTS AND DISCUSSION
In the recent years, porous inert media (PIM)combustion technology has become increasingly important, specifically from the viewpoints of technical interest and practical applicability, because of the high combustion efficiency, low energy consumption, and stable combustion over a wide range of operating conditions.
In the case of micro combustion, the heat loss increases more rapidly as the combustor size is reduced.During the flame propagation, the heat loss to the wall becomes significant and reduces the operating temperature, even causing the combustion to extinguish. These disadvantages may be overcome effectively in case of applying PIM combustion technology in the meso-scale combustion.
In this work, porous medium (Fig. 7) was embedded into the meso-scale combustion chamber.99.9% purity methane was used as fuel. Fuel flow rate was fixed to 0.4 L·min−1and air/fuel ratio was adjusted according to different experimental purposes.Depending on the number of electrodes employed, a set of measurements can be taken in a few milliseconds. In this work, a rate of 100 frames per second has been set to capture flame signals. The reconstructed images of a flame are shown in Figs. 10-13. The porous matrix, as well as the pores, does not appear in the figures, indicating that the intrinsic image of the porous solid can be effectively eliminated from the reconstructed images due to the selection of the low calibration point.
Air/fuel ratio was fixed to 0.8 before ignition. As the combustion chamber was filled with a fuel-air mixture and then ignited by igniting needle near the fuel inlet, the ECT reconstructed images clearly showed the spreading of reaction zone across porous medium in Fig. 10. The elapsed time of the combustion stabilization may be relatively long, because the small pores in the porous matrix always cause sudden extinction of the flame. With the propagation of combustion reaction, relatively steady images can be achieved which show the full development of CH4-air diffusion combustion. At the same time, we can see an irregular reaction zone in the top left corner of Fig. 10(a) which is caused by the separate location of two fuel inlets.
With the decrease of the characteristic size of a combustor, the residence time of fuel and oxygen passing through the combustion chamber becomes shorter. And heat transfer via wall conduction through gas to the surrounding surface is significant because the temperature gradients become higher. Hence, less inflammability and a smaller unsteady flame could result The pictures in Fig. 11 show the unsteady development of combustion in a meso-scale porous burner when the air/fuel was adjusted to 0.6.
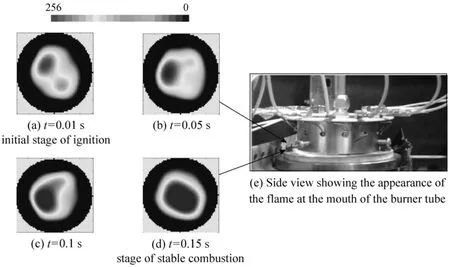
Figure 10 Visualization of ignition process
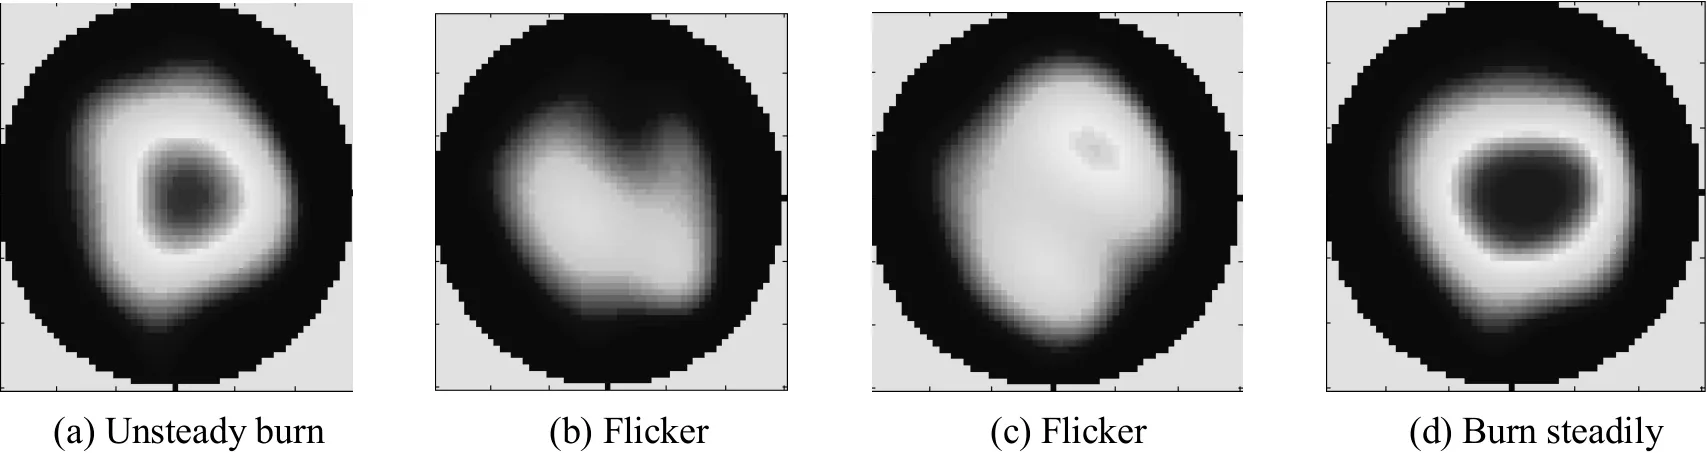
Figure 11 Visualization of unstable combustion process
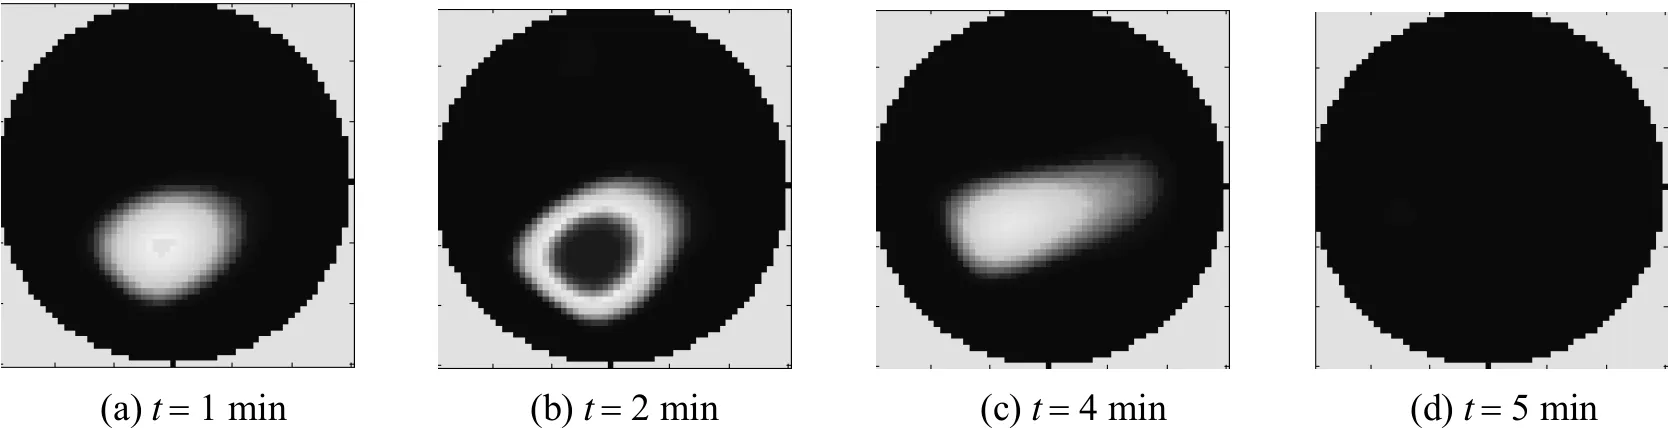
Figure 12 Visualization of quenching
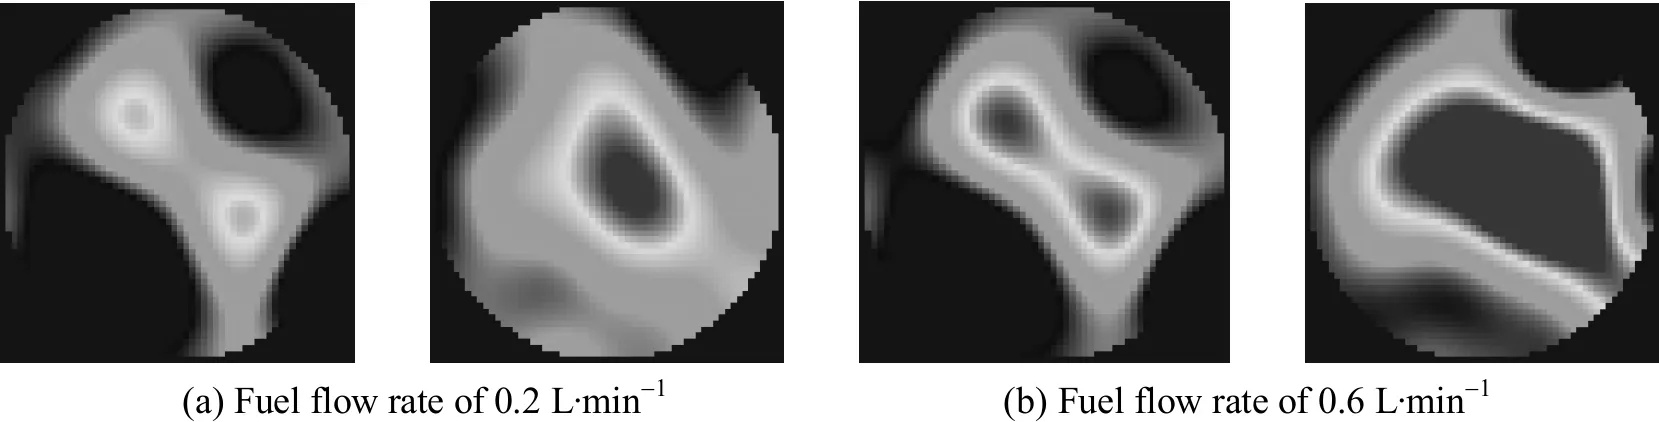
Figure 13 Flame images at different flow rate
As described above, it is difficult to maintain steady flame propagation in micro combustion. Filling porous media into the small combustion chamber could overcome the phenomena of quenching to some extent. In this work, quenching occurred at air/fuel ratio of 0.4. Frames in Fig. 12 show clearly the decaying process which lasts for a short period because of the porous media.
The above images demonstrated the correlation between the flame permittivity and combustion parameters. Further, the grey level of reconstructed images is related to the temperature, pressure and air/fuel ratio. Diffusion flames corresponding to fuel rates of 0.2 L·min−1and 0.6 L·min−1respectively, with heated air of 6 L·min−1, are imaged by ECT in Fig. 13. It is clear that the ECT images correspond to the variations of the fuel rate. In other words, the grey level in the flame images intensifies along with the increase of the fuel rate. The relationship between the flame permittivity and parameters of a combustion gas has been demonstrated again.
6 CONCLUSIONS
With the method of metallization used to avoid sensor damage by high temperature, the novel ECT sensors work successfully due to its strong induction,low noise, stable capacitance and high temperature resistance.
Using this ECT system the characteristics of meso-scale combustion were investigated. It has been found that the Landerweber iterative algorithm was suitable for flame imaging and a novel calibration method was adopted to ECT monitoring of a flame of unknown permittivity.
The electric nature of combustion and the imaging principle were studied. Combustion phenomena including igniting, quenching and unsteady combustion have been observed using the ECT system, and the relationship between flame permittivity and state parameters of combustion gas have been demonstrated.
ECT monitoring flames is an important extension of its application. Further developments to improve spatial and temporal resolution, as well as deduce the quantitative relationship between the flame permittivity and state parameters of combustion gas, will make the general technique even more useful for the monitoring and control of combustion process.
NOMENCLATURE
A amplification factor
C capacitance measurements vector
E photon energy, eV
E~xelectric field vector
ekerror between the measured capacitance and the calculated capacitance
G vector of grey levels
h Planck constant(=6.626×10⁻³⁴)
Iincurrent, A
J~xconduction current density, A·m−2
J~Txtotal current density, A·m−2
k Boltzmann constant (=1.382×10⁻³¹J·K−1)
m mass of an electron (=9.10910−31kg)
nenumeral density of electrons, m−3
ngnumeral density of neutral particles, m−3
p pressure, Pa
qecharge of an electron (= −1.602×10⁻¹⁹C)
r number of electrodes
S coefficient matrix
T temperature, K
u~xdrift velocity of an average electron, m·s−1
V volume, m3
V0output voltage, V
αkiteration step length
εpdielectric permittivity for hydrocarbon flames
ε0dielectric constant (=8.85410−12F·m−1)
κprelative permittivity
νmelectron-neutral molecule collision frequency, s−1
φ air/fuel ratio
ωpeplasma collision frequency, s−1
Subscripts
e electron
g gas
in in
k the kth
p relative
pe plasma
T total
M molecule
1 Epstein, A.H., Senturia, S.D., “Macro power from micro machinery”,Science, 276, 1211-1218 (1997).
2 Shan, X.C., Wang, Z.F., Jin, F.Y., Wu, M., Hua, J., Wong, C.K.,Maeda, R., “Studies on a micro combustor for gas turbine engines”,J. Micromech. Microeng., 15S, 215-221 (2005).
3 Suzuki, Y., Okada, Y., Ogawa, J., Sugiyama, S., Toriyama, T., “Experimental study on mechanical power generation from MEMS internal combustion engine”, Sensors Actuators A, 141, 654-661(2008).
4 Aichlmayr, H.T., Kittelson, D.B., Zachariah, M.R., “Micro-HCCI combustion: experimental characterization and development of a detailed chemical kinetic model with coupled piston motion”, Combust. Flame, 135, 227-248 (2003).
5 Yang, W.M., Chou, S.K., Shu, C., Li, Z.W., Xue, H., “Development of microthermophotovoltaic system”, Appl. Phys., 37, 1017-1020(2004).
6 Hua J.S., Wu M., Kumar, K., “Numerical simulation of the combustion of hydrogen-air mixture in micro-scaled chamber. PartⅡ:CFD analysis for a micro-combustor”, Chem. Eng. Sci., 60, 3507-3515(2005).
7 Mehra, A., Ayon, A.A., Waitz, I.A., Schmidt, M.A., “Microfabrication of high temperature silicon devices using water bonding and deep reactive ion etching”, J. Microelectromech. Systems, 8,152-160 (1999).
8 Yang, W.Q., Conway, W.F., “Measurement of sensitivity distributions of capacitance tomography sensors”, Rev. Sci. Instru., 69 (1),233-236 (1998).
9 Peng, L.H., Merkus, H., Scarlett, B., “Using regularization methods for image reconstruction of electrical capacitance tomography”, Particle Particle Sys. Charact., 17 (3), 96-104 (2000).
10 He, R., Xie, C.G., Waterfall, R.C., Beck, M.S., Beck, C.M., “Engine flame imaging using electrical capacitance tomography”, Electr.Lett., 30 (7), 559-560 (1994).
11 Waterfall, R.C., He, R., Wolanski, P., “Flame visualizations using electrical capacitance tomography (ECT)”, Proc. SPIE, 4188,242-250 (2001).
12 Liu, S, Wang, H.G., Jiang, F.A., “New image reconstruction method for tomographic investigation of fluidized beds”, AIChE J., 48 (8),1631-1638 (2002).
13 Yang, W.Q., Spink, D.M., York, T.A., “An image-reconstruction algorithm based on Landweber’s iteration method for electrical-capacitance tomography”, Meas. Sci. Technol., 10 (11),1065-1069 (1999).
14 Yuan, Z.C., Shi, J.M., “Electron collision frequency of the non-magnetize plasma”, Nucl. Fusion Plasma Phys., 24 (2),157-160 (2004).
15 Schulz, C., Sick, V., “Tracer-LIF diagnostics: Quantitative measurement of fuel concentration, temperature and fuel/air ratio in practical combustion systems”, Progr. Energy Combust. Sci., 31, 75-121(2005).
16 Williams, B., Ewart, P., Wang, X.W., Stone, R., Ma, H.R., Walmsley,H., Cracknell, R., Stevens, R., Richardson, D., Fu, H.Y., Wallace, S.,“Quantitative planar laser-induced fluorescence imaging of multi-component fuel/air mixing in a firing gasoline-direct-injection engine: Effects of residual exhaust gas on quantitative PLI”, Combust. Flame, 157, 1866-1878 (2010).
17 Troiani, G., Marrocco, M., Giammartini, S., Casciola, C.M.,“Counter-gradient transport in the combustion of a premixed CH4/air annular jet by combined PIV/OH-LIF”, Combust. Flame, 156,608-620 (2009).
18 Goodings, J.M., Guo, J.Z., Laframboise, J.G., “Electrochemical diffusion potential in a flame plasma: Theory and experiment”, Electrochem. Commun., 4, 363-369 (2002).
19 Vasekova, E., Stano, M., Matej, S., “Electron impact ionization of C2H6: Ion and temperature effects”, Int. J. Mass Spectr., 235, 155-162(2004).
20 Cho, B.R., Lee, J.J., Kang, S.K., “Effect of composition change on sintering and metallizing of alumina ceramics”, J. Ceram. Process.Res., 10 (1), 121-123 (2009).
21 Yang, W.Q., Chondronasios, A., Nattrass, S., Nguyen, V.T., Betting,M., “Adaptive calibration of a capacitance tomography system for imaging water droplet distribution”, Flow Measur. Instrum., 15,249-258 (2004).
2011-12-02, accepted 2012-02-05.
* Supported by the National Natural Science Foundation of China (50806005, 50736002, 61072005).** To whom correspondence should be addressed. E-mail: qchen@bjtu.edu.cn
 Chinese Journal of Chemical Engineering2012年3期
- Chinese Journal of Chemical Engineering的其它文章
- Adsorptive Removal of Para-chlorophenol Using Stratified Tapered Activated Carbon Column
- Modelling and Fixed Bed Column Adsorption of Cr(VI) onto Orthophosphoric Acid-activated Lignin
- Top-cited Articles in Chemical Engineering in Science Citation Index Expanded: A Bibliometric Analysis
- Mass Transfer of Copper(II) in Hollow Fiber Renewal Liquid Membrane with Different Carriers*
- Analysis of Absorption and Reaction Kinetics in the Oxidation of Organics in Effluents Using a Porous Electrode Ozonator*
- Advances in Large-eddy Simulation of Two-phase Combustion (I)LES of Spray Combustion*