
Modelling and Fixed Bed Column Adsorption of Cr(VI) onto Orthophosphoric Acid-activated Lignin
2012-10-31 03:35AhmadAlbadarinChiranganoMangwandiAlaAlMuhtasebGavinWalkerStephenAllenandMohammadAhmadSchoolofChemistryandChemicalEngineeringQueenUniversityBelfastBelfastBT95AGNorthernIrelandUKPetroleumandChemicalEngineeringDepartmentFacu
Ahmad B. Albadarin, Chirangano Mangwandi, Ala’a H. Al-Muhtaseb, Gavin M. Walker,,*,Stephen J. Allen and Mohammad N.M. Ahmad, School of Chemistry and Chemical Engineering, Queen’s University Belfast, Belfast BT9 5AG, Northern Ireland,UK. Petroleum and Chemical Engineering Department, Faculty of Engineering, Sultan Qaboos University, P.O. Box ,Al-Khod, Oman Materials Surface Science Institute, Department of Chemical and Environmental Sciences, University of Limerick,Ireland
Modelling and Fixed Bed Column Adsorption of Cr(VI) onto Orthophosphoric Acid-activated Lignin
Ahmad B. Albadarin1, Chirangano Mangwandi1, Ala’a H. Al-Muhtaseb2, Gavin M. Walker1,3,*,Stephen J. Allen1and Mohammad N.M. Ahmad1,21School of Chemistry and Chemical Engineering, Queen’s University Belfast, Belfast BT9 5AG, Northern Ireland,UK.2Petroleum and Chemical Engineering Department, Faculty of Engineering, Sultan Qaboos University, P.O. Box 33,Al-Khod, Oman3Materials Surface Science Institute, Department of Chemical and Environmental Sciences, University of Limerick,Ireland
The advantage of using an available and abundant residual biomass, such as lignin, as a raw material for activated carbons is that it provides additional economical interest to the technical studies. In the current investigation, a more complete understanding of adsorption of Cr(VI) from aqueous systems onto H3PO4-acid activated lignin has been achieved via microcolumns, which were operated under various process conditions. The practice of using microcolumn is appropriate for defining the adsorption parameters and for screening a large number of potential adsorbents. The effects of solution pH (2-8), initial metal ion concentration (0.483-1.981 mmol·L−1), flow rate(1.0-3.1 cm3·min−1), ionic strength (0.01-0.30 mmol·L−1) and adsorbent mass (0.11-0.465 g) on Cr(VI) adsorption were studied by assessing the microcolumn breakthrough curve. The microcolumn data were fitted by the Thomas model, the modified Dose model and the BDST model. As expected, the adsorption capacity increased with initial Cr(VI) concentration. High linear flow rates, pH values and ionic strength led to early breakthrough of Cr(VI). The model constants obtained in this study can be used for the design of pilot scale adsorption process.
activated carbon, lignin, hexavalent chromium, adsorption, fixed bed column
1 INTRODUCTION
Environmental scientists principally concern with the occurrence of hexavalent chromium due to its high toxicity and impact on human health and environment[1]. Cr is frequently released into the surface-waters by natural processes, such as weathering of rocks and volcanic activity, and also by industrial activities such as manufacture of dyes, electroplating treatment, leather tanning, paper and paint production [2]. In the marine environment, chromium mainly occurs in two oxidation states: Cr(VI) and Cr(III) [3]. These two oxidation states have diverse environmental, biological and chemical properties [4]. Cr(III) hydroxides have low solubility and therefore low availability for biological uptake and relatively immobile, which may explain the small percentage of Cr(III) in polluted ground water [5]. Cr(III) is poisonous only at high concentrations[6]. Cr(VI) is approximately 100 times more toxic and 1000 times more mutagenic than Cr(III). The high toxicity of Cr(VI) ions is attributable to the hexavalent chromium ion complexes (i.e. negatively charged) that pass through cellular membranes via sulphate ionic channels and then undergo direct reduction reactions resulting to the development of various harmful reactive intermediates [7]. As a result of environmental concern, maximum discharge values of both Cr(VI)and Cr(III) have been limited in most industrial countries [8]. Chromium threshold concentration, on inhibitory effect on heterotrophic organisms, is 0.019 mmol·L−1for Cr(VI) and 0.192 for Cr(III) [9]. Thus,final effluent containing Cr(VI) requires treatment by suitable techniques before discharge.
A range of methods have been developed for the treatment of Cr(VI) containing wastes, which include adsorption, ion exchange, reduction, reverse osmosis,evaporation, and bio-sorption [6, 9]. Adsorption techniques have been extensively investigated and appear to be a practical option. The most challenging aspect of adsorption technology is the high cost of commercially available adsorbents. The relatively high cost of activated carbon may limit its use in certain treatment technologies [10]. Production of low cost adsorbents derived from a broad range of agricultural waste has become a goal of many researchers [11].
Activated carbon for the adsorption of hexavalent chromium have been prepared from palm seeds, sawdust, tamarind wood, lignin and various biomaterials such as dead fungal biomass of marine Aspergillus niger and coir pith [12]. Lignin is a low-cost natural polymer, which has a complex structural heterogeneous three-dimensional aromatic polymer, formed by phenylpropane units [13]. Water-insoluble lignin and modified lignin (modified with various ionic reagents)can be utilized to remove Cr(VI) ions from aqueous solution [8]. In our previous research, orthophosphoric acid activated lignin was used as an adsorbent for the removal of Cr(VI) ions in batch and kinetic experiments [8]. The results confirmed that the activated lignin has a high adsorption capacity for the removal of Cr(VI) ions compared to other low-cost adsorbents.However, adsorption capacities from batch studies,although useful, may not provide accurate scale-up information for column systems due to a number of factors [14]. From the industrial point of view, the removal of Cr(VI) by an adsorption column system is very practical because of the low reagent handling,adaptability of column systems to multipurpose processes and low operational costs [10]. As a continuation of our previous work, a deeper understanding of adsorption behaviour of Cr(VI) from aqueous systems onto orthophosphoric acid activated lignin (PAL) has been undertaken via column study in this paper.
According to Li et al. [15], the microcolumn technique can acceptably simulate the bed performance for large column trials and thus, experiments in the present study have been performed using a fixed bed microcolumn (e.g. column of adequately short length so that immediate concentration breakthrough occurs [16]) under various conditions. Breakthrough curves were generated at various influent Cr(VI) concentration and pH, flow rate, ionic strength and bed depth. The Thomas model [17], modified model [18]and BDST model [19] are employed to analyze the breakthrough curve for the adsorption of Cr(VI).
2 MATHEMATICAL DESCRIPTION
2.1 Analysis of column data
The packed bed performance is conveniently described through the concept of the adsorption breakthrough curve. The shape of the breakthrough curve and the time taken for breakthrough are important characteristics for defining the dynamics and operational response of an adsorption column [20]. The breakthrough curves are found by plotting throughput volume (Vt) at any time (t) versus effluent (chromium)concentration (C). For our calculations, the breakthrough time was defined as the time for effluent reaching Ct/Co=0.95% for a feed with total [Cr(VI)+Cr(III)] of 0.05 mmol·L−1. Throughput volume was calculated using

where F is the volumetric flow rate (cm3·min−1) and ttotalis the total flow time (min).
Chromium uptake q by PAL was calculated using Eq. (2) [21]:
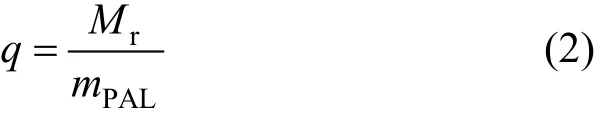
where m is the mass of adsorbent (g), Mr(mmol)influent chromium load – mass of chromium escaping from the column:
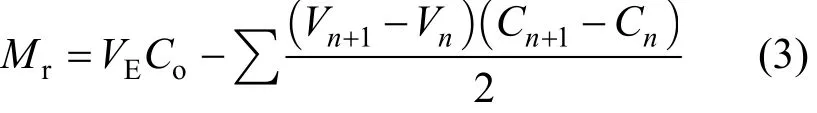
where Cois the initial chromium concentration(mmol·L−1), VEis the volume at the breakthrough time,Vnis the throughput volume at nth reading (L), Vn+1the throughput volume at (n + 1)th reading (L), Cnthe effluent chromium concentration at nth reading(mmol·L−1) and Cn+1is the effluent chromium concentration at (n + 1)th reading (mmol·L−1).
2.2 Modelling of column data
2.2.1 The Thomas model
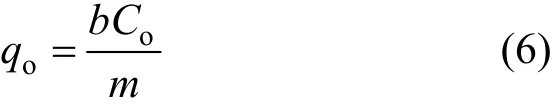
The maximum adsorption capacity, qo, of an adsorbent is necessary in design of an adsorbent column.The Thomas model is commonly applied to determine qo. The model is given as
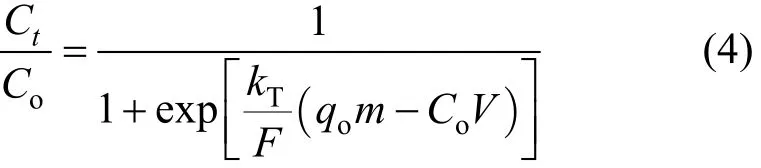
where kTis the Thomas rate constant (dm3·min−1·mmo−l),Ctis the equilibrium concentration (mmol·L−1) at time t (min), qois the maximum column adsorption capacity (mmol·g−1), and V is the cumulative throughput volume (dm3).
The Thomas model is derived based on the following theory: Langmuir adsorption/desorption; no axial dispersion; the rate driving force follows secondorder reversible reaction kinetics [22].
2.2.2 Modified dose-response model
The modified dose-response model is given as
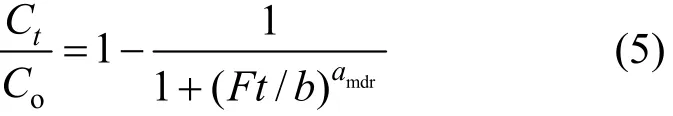
where amdrand b are the modified dose-response model constants.
From the value of b, the value of qocan be estimated using the following equation:
2.2.3 Bed depth-service time model (BDST)
Mathematical model suggested by Bohart and Adams is generally exploited for the evaluation of different column design parameters [23]. The BDST is a simple model, which declares that bed height (Z) and service time (t) of a column bears a linear relationship[24] as follows:
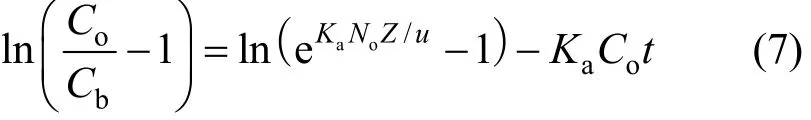
where Cbis the breakthrough metal concentration(mmol·L−1), Z is the bed depth (dm), Nois the column adsorption capacity in BDST model (g·dm−3), u(cm·min−1) is the linear velocity calculated by dividing the flow rate by the column sectional area, Kais the adsorption rate constant (dm3·g−1·min−1).
The linear relationship between the bed depth, Z,and the service time at breakthrough, tB, in Eq. (7) can be rearranged to [25]
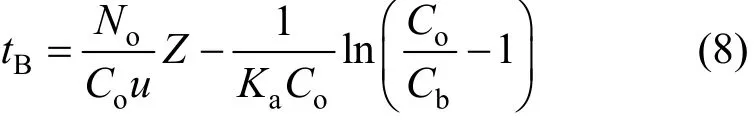
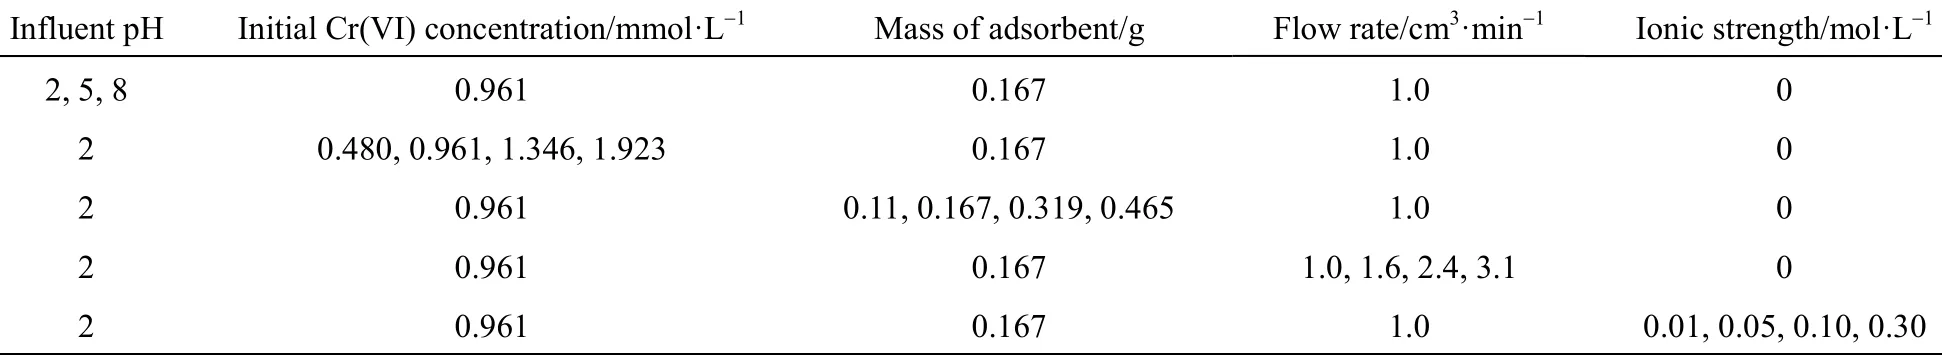
Table 1 Microcolumn adsorption experimental conditions for the Cr(VI) removal onto PAL
when eKaNaZ/F≫ 1 . Setting t = 0 and solving Eq. (8)for Z yields:
where Zois the minimum bed depth to be provided for an effluent concentration of Cb.
Hutchins [26] presented a modified form of BDST equation (the Bohart-Adams equation), Eq. (8),as t = a Z + b , in which a is the slope No/(CoF) and b is the intercept l n (Co/Cb− 1 )/(KaCo). This simplified design model ignores the intraparticle mass transfer resistance and external film resistance such that the adsorbate is adsorbed onto the adsorbent interior directly. With these assumptions the BDST model can be applied to most systems and provides useful prediction for changes in process parameters [27].
3 EXPERIMENTAL
3.1 PAL adsorbent
Lignin material (alkali low sulfonate content)was obtained from Sigma-Aldrich. The PZC (point of zero charge) and pHsolutionof lignin were found to be 6.56 and 6.38, respectively. Orthophosphoric acid activated lignin (PAL) used in this study was prepared by following the method proposed by Hayashi et al[28]. The detailed procedures are given elsewhere [8].The average pore diameter for the activated lignin was to be 1.825 nm, the total pore volume was 8.51×10⁻²cm3·g−1and the specific surface area of the activated lignin was 98.28 m2·g−1measured by the N2-BET method. Particle sizes of 100-200 μm were used for the experiments.
3.2 Continuous systems
In the column experiments, a glass column of 0.9 cm ID and length of 6 cm was used. The microcolumn was filled with selected amount of PAL between two supporting layers of glass-wool to avoid elution of the adsorbent. Air pockets present within the packed PAL create channelling of influent chromium solution and reduce the adsorption efficiency of the bed [21]. Hence,to ensure that the microcolumn is properly packed, it was soaked in deionised water for 4 h prior to the experiments.
The solution was pumped using a peristaltic pump, connected with Teflon tubes from the sample tank to the top of the microcolumn (down flow pattern).Flow rate was cross-checked at the outlet of the column every 30 min to avoid and reduce the flow rate fluctuations that may take place inside the column bed.
Experiments were undertaken to study the effect of initial chromium concentration, solution pH, flow rate, mass of adsorbent (bed depth) and ionic strength of solution. The chromium samples were collected at the outlet of the column at regular time intervals. A column test was terminated when the column reached exhaustion. Duplicate samples were measured and the standard error in the readings was less than 5%. Solutions of 1.0 mol·L−1nitric acid and sodium hydroxide were used to manually adjust the solution pH. The effect of ionic strength was studied in the presence of(NaNO3), at different concentrations 0.01, 0.05, 0.1 and 0.3 mol·L−1. Details of experimental conditions commenced are listed in Table 1.
3.3 Chromium solution and chromium analysis
Chromium stock solution was prepared by dissolving 2.828 g of potassium dichromate in 1 dm3of deionised water. A colorimetric standard method was used to measure the concentrations of Cr(VI) [29]. The pink coloured complex, formed upon addition of 2 cm3of the colour reagent (containing 0.25 g of 1,5-diphenylcarbohydrazide, 50 cm3of methanol(HPLC-grade) and 14 cm3of H2SO4in 500 cm3of deionised water) to 6 ml of Cr(VI) solution was spectrophotometrically analyzed at 540 nm (Perkin Elmer LAMBDA 25, UK). The total Cr [Cr(VI) + Cr(III)]concentration was measured as described by Park et al.[30] and after that the concentration of Cr(III) was calculated by subtracting the Cr(VI) concentration from total the Cr concentration.
4 RESULTS AND DISCUSSION
4.1 Effect of experimental parameters
4.1.1 Effect of solution pH on breakthrough curve
A significant single parameter controlling the sorption capacity is the pH of adsorption medium [10].The value pH of adsorption medium demonstrates the nature of the physicochemical interaction of the adsorption sites of adsorbent and the species in solution, and therefore effects the adsorption mechanisms onto the surface of the solid adsorbent [10]. Effects of influent pH on Cr(VI) removal by PAL were illustrated in Fig. 1. The breakthrough point in this study was taken to be 0.05Ct/Cois reached in the effluent stream for all experimental conditions, as suggested by Suksabye et al [31].
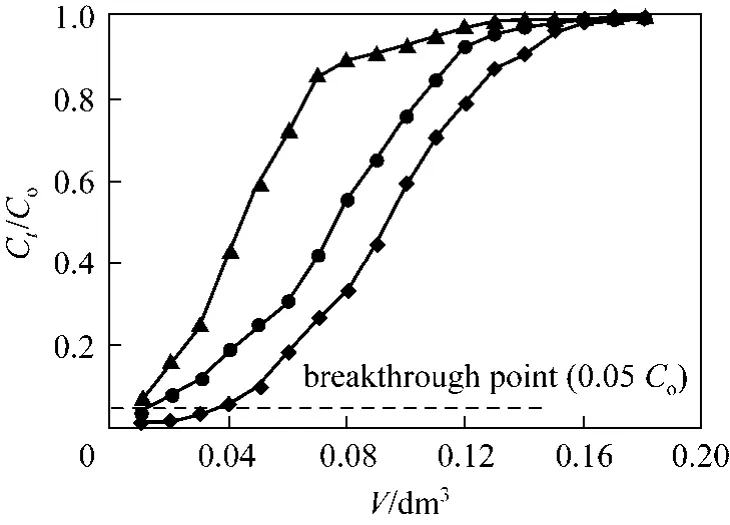
Figure 1 Cr(VI) adsorption breakthrough curves at three different influent pHs (Experimental conditions: mass of PAL:0.167 g, initial Cr(VI) concentration: 0.961 mmol·L−1, flow rate:1.00 cm3·min−1, internal diameter: 1.2 cm)◆ pH 2; ● pH 5; ▲ pH 8
It can be seen from Fig. 1 that the shape of the breakthrough curves of adsorption of Cr(VI) at various influent pH showed a characteristic “S” shape. It can also be observed that the mass of Cr(VI) removed decreased with increase in pH and that the relevant exhaust time decreased from 180 min to 120 min, with increased in pH from pH 2 to pH 8, respectively.
The breakthrough curves shifted from left to right,with a decrease of influent pH, which shows that more chromium can be removed and the efficiency of adsorption was higher. The results demonstrated that with the decreasing of pH in experimental condition,the adsorption capacities increase. The chromium uptake q, calculated using Eqs. (2) and (3) for influent pH=2, 5 and 8, were 0.648, 0.514 and 0.381 mmol·g−1,respectively. This may be due to the electrostatic attraction of anionic Cr(VI) at acidic conditions. At pH<pHPZC(pH at point of zero charge), PAL surface is positively charged (PAL-COOH+), thus a force of attraction is present between the Cr(VI) anions and the PAL adsorbent surface, resulting in high adsorption capacity.
From our previous studies on removal of Cr(VI)by PAL in batch and kinetic processes, it was found that Cr(VI) can spontaneously be reduced to Cr(III) at acidic pH [8]. The results for columns studies indicated that the percentage of Cr(III) concentration detected in the aqueous solution at pH 2 was approximately 5%. Also, when the pH is increased above 2.0,adsorption of Cr(III) (formed due to the adsorption couple reduction) may occur due to the increase in the negative charge on the lignin surface [13]. However, at pH 5, the maximum Cr(III) concentration in effluent was only 0.057 mmol·L−1and it decreased thereafter with no Cr(III) in effluent at pH 8.
4.1.2 Effect of influent Cr(VI) concentration on breakthrough curve
The effect of influent Cr(VI) concentration on the breakthrough curves is illustrated in Fig. 2. A decreased inlet Cr(VI) concentration provided higher treated volume since the lower concentration gradient caused slower transport due to a lower driving force [32]. It was found that with the increase in Cr(VI) concentration, mass of Cr(VI) uptake increased, with increased in concentration from 0.480 mmol·L−1to 1.923 mmol·L−1the corresponding Cr(VI) uptake increased from 0.412 to 0.976 mmol·g−1PAL. These suggest that initial concentration of adsorbate effects the diffusion of adsorbate in adsorbent [33]. The measured concentrations of Cr(III) decreased with an increase in the influent concentration from 0.480 to 0.961 mmol·L−1and no Cr(III) was detected in the effluent for 1.346 and 1.9623 mmol·L−1initial concentrations.
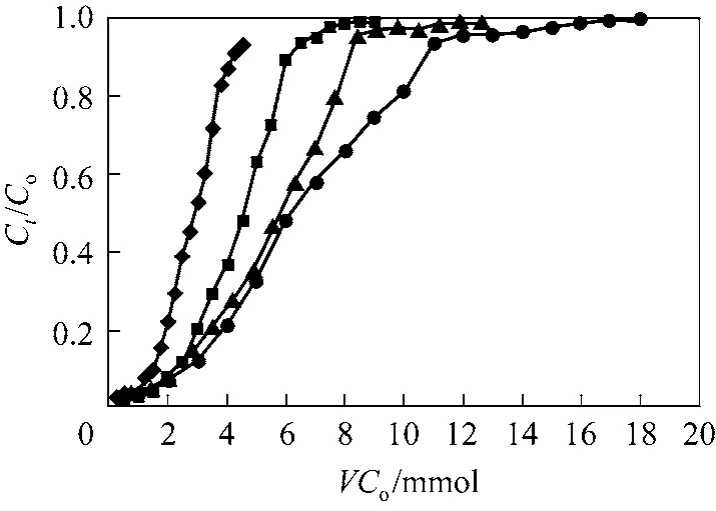
Figure 2 Cr(VI) adsorption breakthrough curves at four different solution influent concentrations (Experimental conditions: mass of PAL: 0.167 g, influent pH: 2, flow rate: 1.00 cm3·min−1, internal diameter: 1.2 cm)◆ 0.480 mmol·L−1; ■ 0.961 mmol·L−1; ▲ 1.346 mmol·L−1;● 1.923 mmol·L−1
4.1.3 Effect of ionic strength on breakthrough curve
In light that industrial wastewater will probably include ions other than chromium, the influence of ionic strength on Cr(VI) adsorption on PAL was examined and depicted in Fig. 3. The data indicate that with an increase of salt concentration in the influent,the efficiency of adsorption decreased (q: 0.01 mol·L−1, 0.326 mmol·g−1; 0.05 mol·L−1, 0.268 mmol·g−1; 0.10 mol·L−1, 0.230 mmol·g−1; and 0.30 mol·L−1, 0.169 mmol·g−1). The shift in the breakthrough curves and decrease in the adsorption capacity can be attributed to the competition between the chromate ions and the negatively charged ions in the salt. Interestingly, Cr(III) concentrations in the aqueous solution were unobservable, even at low pH value.The occurrence of dissolved NO3−in the aqueous solution may influence the Cr(VI) adsorption and also the reduction of Cr(VI) to Cr(III) [8].
4.1.4 Effect of flow rate on breakthrough curve
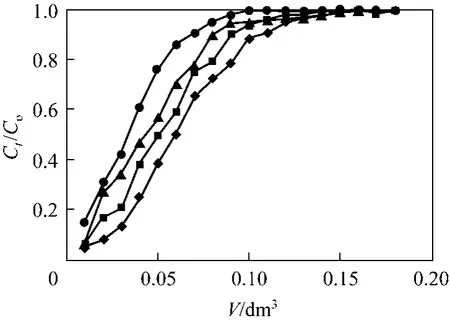
Figure 3 Cr(VI) adsorption breakthrough curves at four different ionic strengths (Experimental conditions: mass of PAL: 0.167 g, influent pH: 2, initial Cr(VI) concentration: 0.961 mmol·L−1, flow rate: 1.00 cm3·min−1, internal diameter: 1.2 cm)◆ 0.01 mol·L−1; ■ 0.05 mol·L−1; ▲ 0.10 mol·L−1; ● 0.30 mol·L−1
Contact time is the most important variable in column systems and hence solution flow rate and bed depth are the main parameters [34]. Therefore, adsorption of Cr(VI) ions onto PAL was examined at the flow rates of 1.0, 1.60, 2.40 and 3.10 cm3·min−1so as to explore the influence of flow rate on the adsorption performance. Fig. 4 illustrates that the breakthrough took place considerably sooner with increasing flow rate. Initially, adsorption was rapid at lower flow rate due to the availability of reaction sites near the particle surface able to capture Cr(VI). In the next stage of the process as a result of the gradual occupancy of these sites, the uptake rate decreases. As the flow rate was increased from 1.0 to 3.1 cm3·min−1, the exhaust time (related to 98% of influent concentration) was found to decrease from 180 to 60 min and the amount adsorbed q decreased from 0.648 to 0.096 mmol·g−1.The breakthrough curve in Fig. 4 increased in gradient as the flow rate increased. The higher removal of Cr(VI) ions at low flow rates was due to the longer contact time with PAL adsorbent.
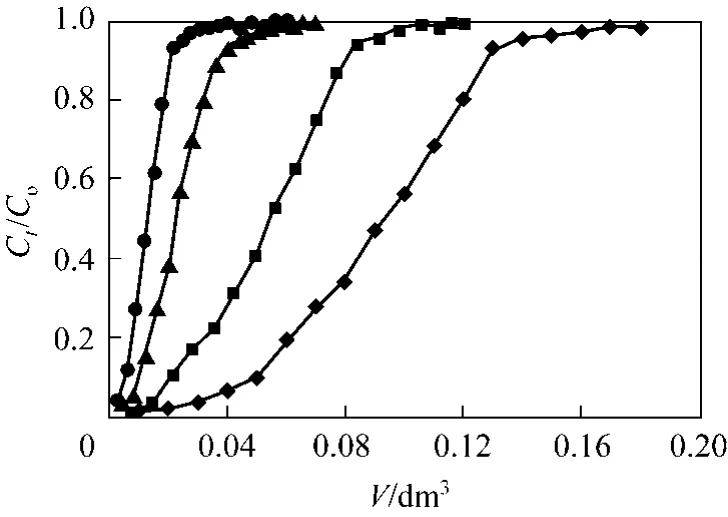
Figure 4 Cr(VI) adsorption breakthrough curves at four different flow rates (Experimental conditions: mass of PAL:0.167 g, influent pH: 2, initial Cr(VI) concentration: 0.961 mmol·L−1, internal diameter: 1.2 cm)◆ 1.00 ml·min−1; ■ 1.60 ml·min−1; ▲ 2.40 ml·min−1; ● 3.10 ml·min−1
4.1.5 Effect of PAL mass on breakthrough curve
The accumulation of metals in a fixed-bed column depends on the bed depth or on the amount of solid sorbent employed [35]. The sorption behaviour of PAL was investigated while increasing the adsorbent mass: 0.110, 0.167, 0.319 and 0.465 g at pH 2, inlet chromium concentrations of 0.961 mmol·L−1and flow rate 1 cm3·min−1. The adsorption breakthrough curves found by altering the amount of PAL adsorbent are illustrated in Fig. 5. The Cr(VI) uptake capacity increased with the increase of the adsorbent mass in the column (0.377, 0.663, 0.682 and 0.824 mmol·g−1for PAL mass 0.110, 0.167, 0.319 and 0.465 g, respectively) was due to the increase in the overall surface area of adsorbent and thus binding sites for adsorption.The Cr(VI) concentration in the effluent at low adsorbent mass increased rapidly and the bed became saturated with Cr(VI) and the Cr(VI) concentration in the effluent increased abruptly to approach the Cr(VI)inlet concentration.
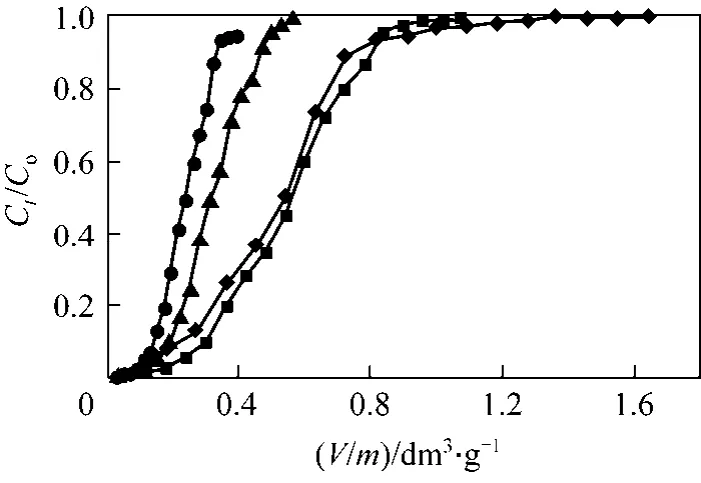
Figure 5 Cr(VI) adsorption breakthrough curves at four different adsorbent masses (Experimental conditions: influent pH: 2, initial Cr(VI) concentration: 0.961 mmol·L−1, flow rate:1.00 cm3·min−1, internal diameter: 1.2 cm)◆ 0.110 g; ■ 0.167 g; △ 0.319 g; ● 0.465 g
4.2 Application of various breakthrough curve models
The shape of the breakthrough cures vary depending on the concentration of the solution, the fluid velocity and the bed height [36]. Breakthrough curves with a high gradient are found for systems that demonstrate high internal diffusion coefficients or a flat adsorption isotherm and high film transfer coefficients[37]. The dynamic performance of the fixed bed column was represented with the Thomas model [17],modified model [18] and BDST model [19].
4.2.1 Application of Thomas model
Thomas model was fitted to the experimental data to determine the Thomas rate constant (kT) and maximum solid concentration q. The calculated relative constants kTand q values using non-linear regression (Sigma-plot 2012) along with the statistical parameters given in Table 2. Interestingly, the values of qocalculated from Thomas model [Eq. (4)] were comparable to the q values calculated using Eq. (3). It was found that the Thomas model (R2) range from 0.933 to 0.994 exhibited an excellent fit to the experimental data for all the parameters studied. As the influent pH increased, the value of qodecreased,whereas the value of kTincreased. Similar trends where observed when increasing the flow rate and ionic strength (Table 2). The value of qodecreased from 0.645 to 0.098 mmol·g−1when the flow rate changed from 1.0 cm3·min−1to 3.1 cm3·min−1. At lower flow rates, there is a longer contact time between the chromate ions and the PAL adsorbent and therefore, a higher value of the rate constant suggested that the adsorption capacity will reach the equilibrium value faster (slope ∝ 1/F). A considerable decrease in the adsorption capacity of the bed at various solution ionic strengths indicate that ion exchange may be a possible adsorption mechanism [38].
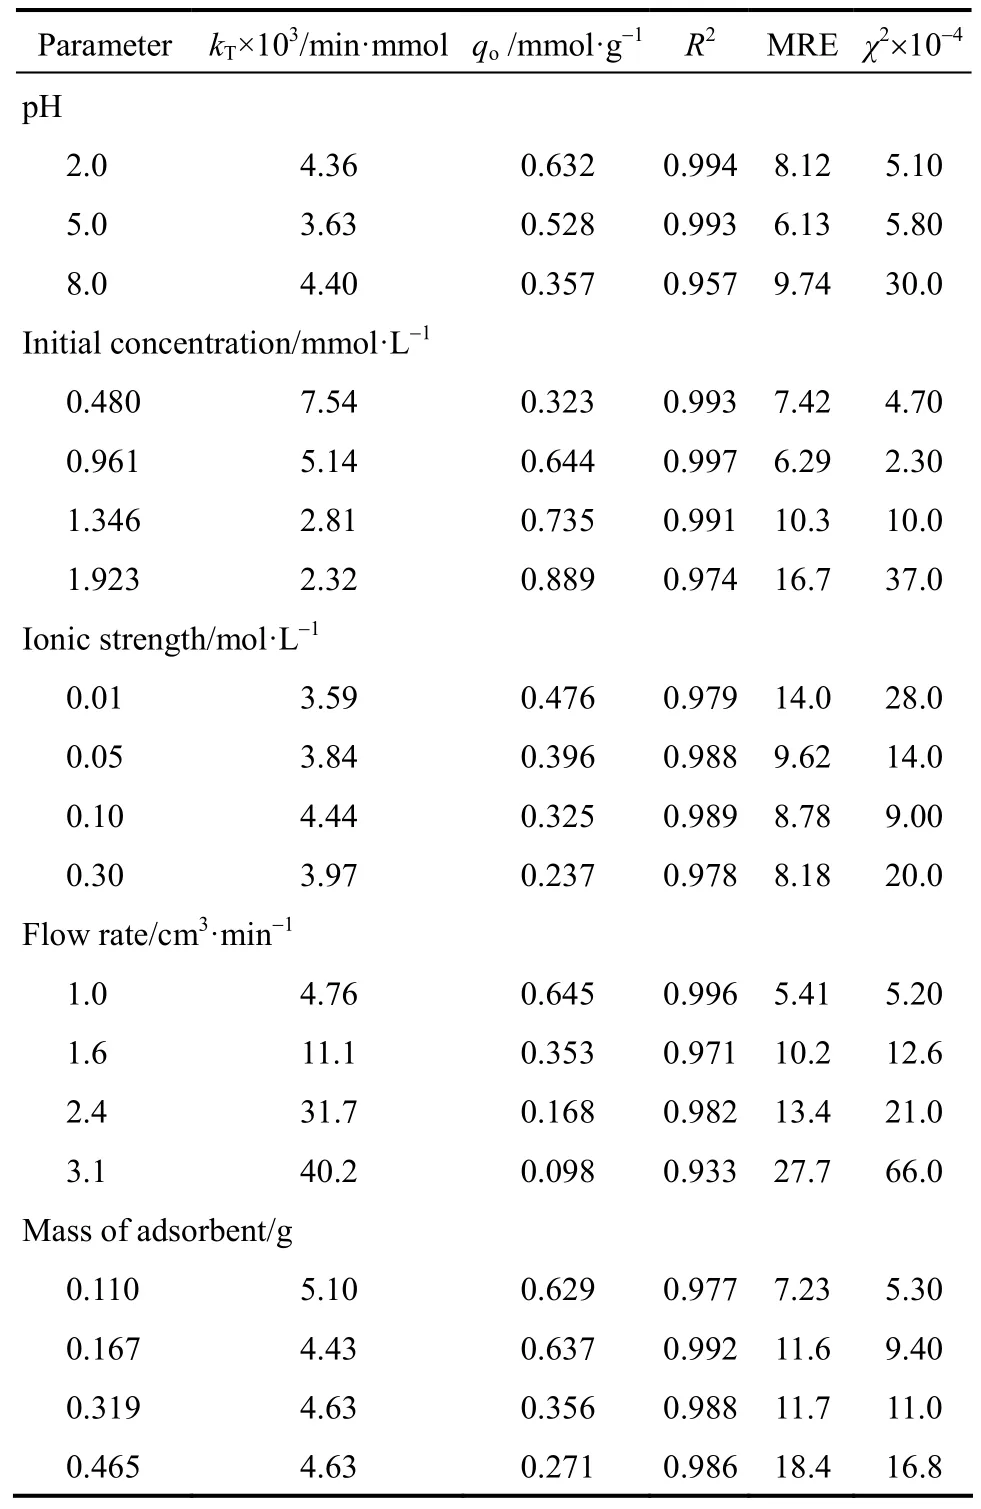
Table 2 Thomas model constants and statistical parameters
The bed capacity qoincreased from 0.323 to 0.889 mmol·g−1when the initial concentration increased from 0.480 to 1.923 mmol·L−1, whereas the value of kTdecreased from 7.54×10⁻³to 2.32×10⁻³min·mmol, respectively, which correlates to the data of other researchers [20, 35, 39]. Also, qo, the maximum column adsorption capacity, decreased with increase in PAL mass as expected. Again, these findings are due to more adsorption sites being available for chromate ions as the amount of PAL increased. In was demonstrated in Albadarin et al. [8], that Cr(VI)
adsorption onto PAL followed pseudo-second order reaction and both external and intraparticle diffusion were involved in the adsorption process. The high values of the determination coefficients R2, low MRE and Chi-square (χ2) show that the Thomas model is able to describe the adsorption of Cr(VI) onto PAL process and the external and internal diffusion were not the rate limiting steps [40]. Figs. 6 (a) and 6 (b)showed the breakthrough curves obtained for each parameter studied at 20 °C.
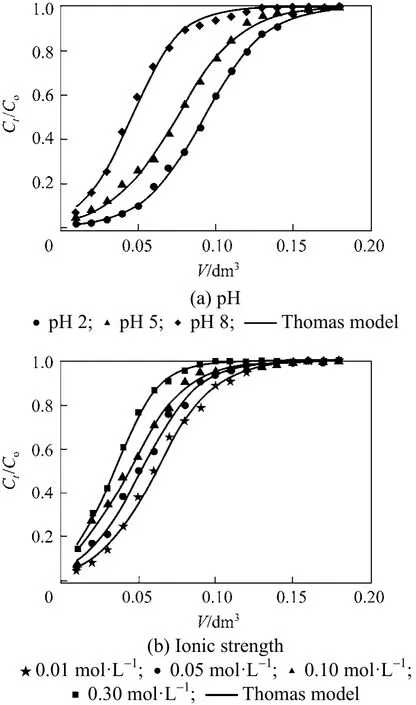
Figure 6 Experimental and theoretical breakthrough curves based on Thomas model: (a) various pHs, (b) various ionic strengths
Clearly, the breakthrough curves show a negligible difference between the experimental and predicted values calculated by Thomas model for all the conditions examined. This confirms the applicability of this model in describing the experimental data.
4.2.2 Application of modified dose-response model
At all conditions investigated, the predicted breakthrough curves of the modified dose-response model illustrate an excellent agreement with the experimental plots. Figures for the predicted qofor the modified dose-response model have not been included as they are very similar to those depicted for the Thomas model in Fig. 6.
Moreover, as can be seen in Table 3, the values of R2for the modified dose-response model were similar to those for the Thomas model (R2higher than 0.977).According to Gokhale et al. [38] the modified dose-response model reduces the error that results from use of the Thomas model, especially with lower and higher breakthrough curve times [41]. The modified dose-response constants amdrand b decreased with an increase in solution pH, initial metal concentration,ionic strength and flow rate. On the other hand, the values of amdrand b increased with increasing the PAL amount (bed height).
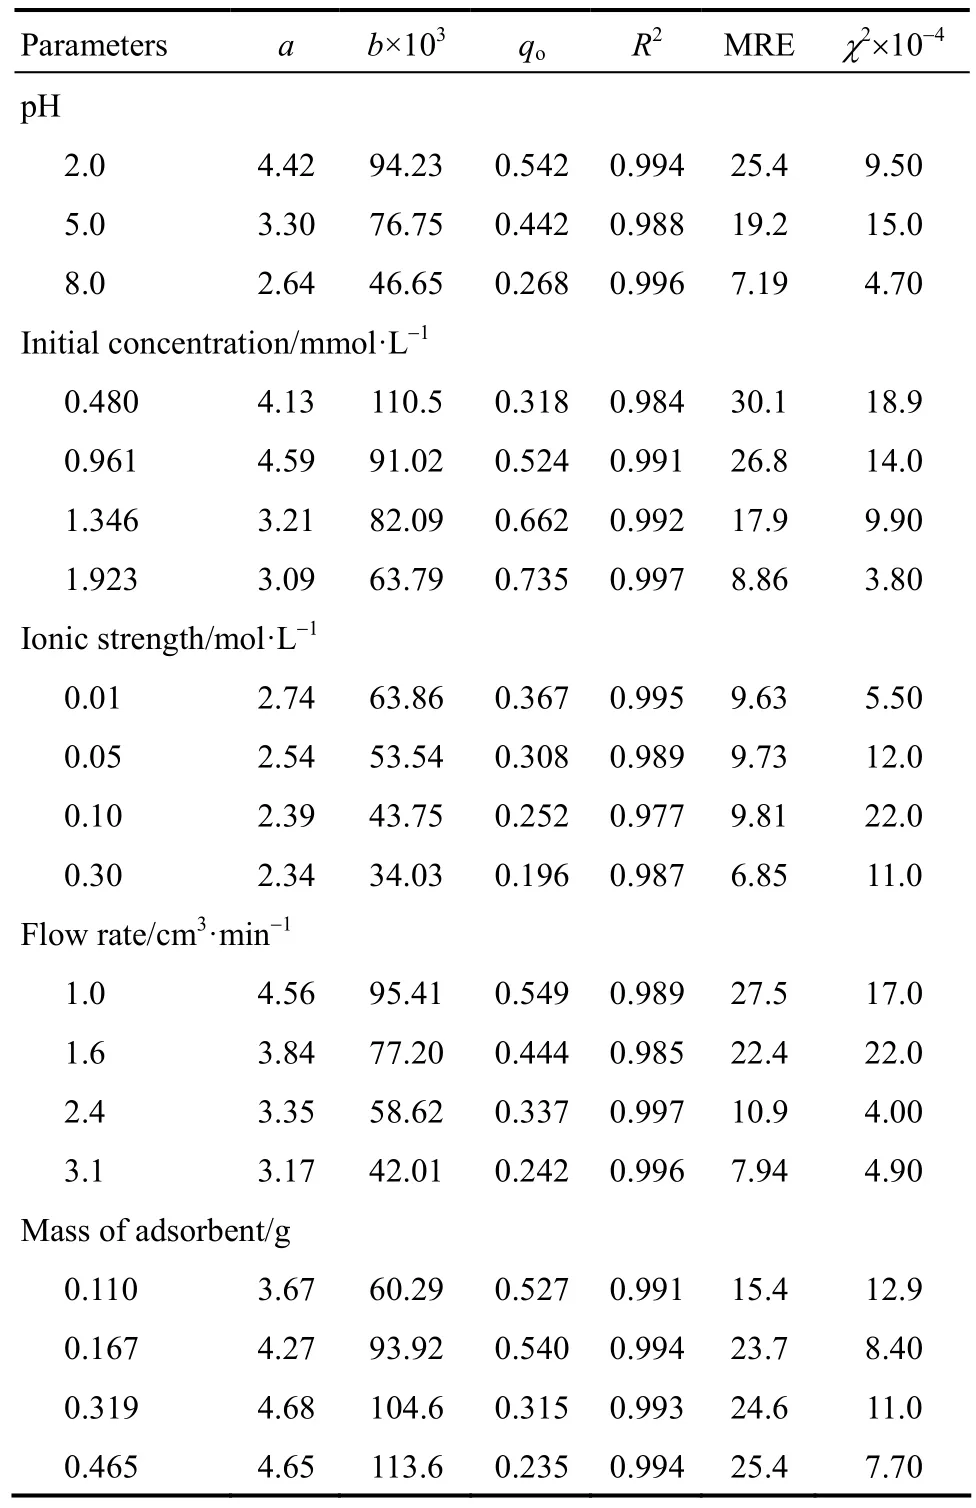
Table 3 Modified dose-response constants and statistical parameters
Similar conclusions were reported by Kumar and Chakraborty [21]. However, when comparing the results, the values of the models’ constants for [21] did not vary to the same extent as observed here. In theory,the values should not change considerably. In this study the values did actually change considerably, this is most likely due to insufficient data points being recorded.
4.2.3 Application of bed depth-service time model(BDST)
The residence time of the metal ions in solution within the column increases when the bed depth increases allowing more time for intraparticle diffusion [42]. Bed depth and service time (tB) results are illustrated in Fig. 7 according to Eq. (7) for 20%, 40%,60% and 80% breakthrough at column bed depth of 0.75, 1.14, 2.18 and 3.17 cm.
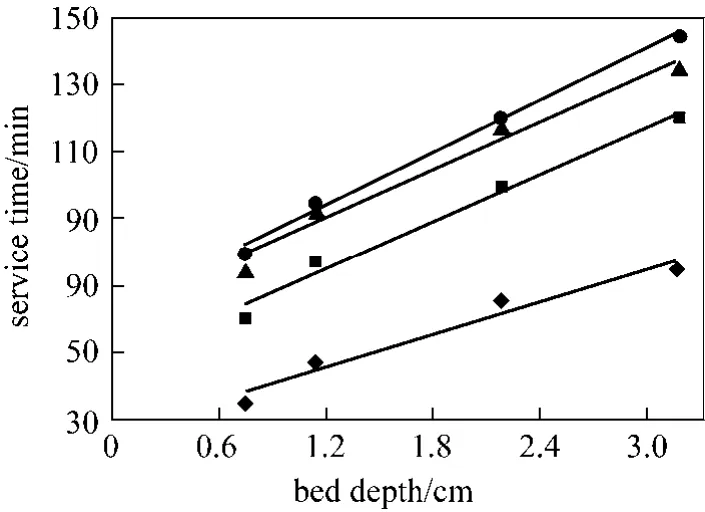
Figure 7 Plots of service time (tB) vs. bed depth at different percentage breakthrough points (The BDST parameters,No adsorption capacity and Ka rate constant were obtained and are given in Table 4)◆ 20% tB 16.14Z + 26.28; ■ 40% tB=23.88Z + 46.02;▲ 60% tB 24.10Z + 61.14; ● 80% tB=26.17Z + 62.63
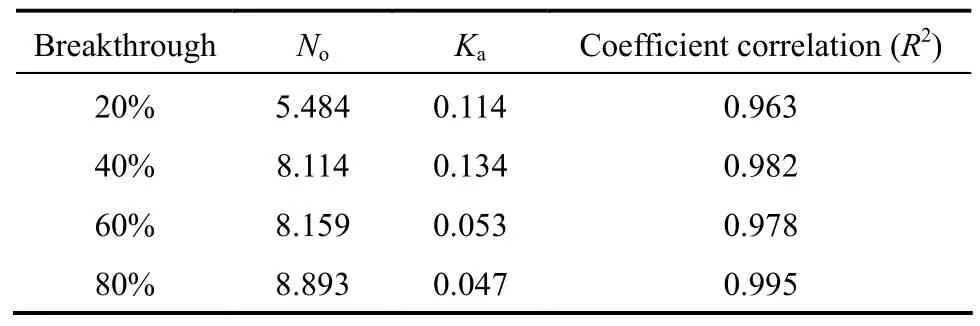
Table 4 BDST equation coefficients at different breakthrough
The BDST model assumes that the metal ions are adsorbed on the adsorbent surface directly without any diffusion effect.
As can be seen in Fig. 7, apart from 80% breakthrough, the experimental points deviate from a theoretical straight line, suggesting a complex diffusional resistance involved in the Cr(VI)-PAL adsorption system, i.e. the data cannot be described successfully using the traditional BDST model.
A consistent increase in slopes from 16.14 to 26.17 for breakthroughs of 20%-80% and consequent increase in corresponding dynamic adsorption capacity Nofrom 5.484 to 8.893 mmol·L−1. On the PAL,some active sites remain unoccupied by metal ions at lower breakthrough value, and hence the adsorbent remained unsaturated. The dynamic adsorption capacity in such low breakthrough condition was consequently bound to be lower than the full bed capacity of the adsorbent [21]. Further to check the validity of BDST model the breakthrough curve was inspected at 50%. At 50% breakthrough, Co/Cb=2, therefore reducing the logarithmic term of BDST equation to zero.Intercept of 52.11 was obtained at 50% breakthrough suggesting the non-conformity of BDST models with adsorption of Cr(VI) by PAL. According to Chen et al.[43], applicability of the BDST model is restricted to the range of conditions studied, though, it provides a comprehensive approach to estimate and conduct sorption-column test.
5 CONCLUSIONS
This paper identified orthophosphoric acid-activated lignin (PAL) as a promising adsorbent to be used for the continuous removal of Cr(VI) ions from aqueous solution. The adsorption capacity was strongly dependent on pH and the uptake of Cr(VI)decreased with increase in pH. Similar trends where observed when increasing the flow rate and ionic strength. Experimental data of individual runs were well represented by the Thomas and modified dose-response model for variable influent initial pH,ionic strength, initial Cr(VI) concentration, flow rate and mass of the PAL adsorbent. The modified dose-response model was able to describe the adsorption of Cr(VI) onto PAL process and the external and internal diffusion were not the rate limiting steps.However, in theory, the Thomas and modified dose-response model constants values should not change considerably. In this study the values did actually change considerably, this is most likely due to insufficient data points being recorded.
1 Goel, J., Kadirvelu, K., Rajagopal, C., Kumar Garg, V., “Removal of lead(II) by adsorption using treated granular activated carbon: Batch and column studies”, J. Hazard. Mater, 125, 211-220 (2005).
2 Serpone, N., Borgarello, E., Pelizzeti, E., Schiavello, E., Photocatalysis and Environment, Kluwer Academic, The Netherlands (1988).
3 Barnhart, J., “Occurrences, uses, and properties of chromium”,Regul. Toxicol. Pharmacol., 26, 3-7 (1997).
4 Alemayehua, E., Thiele-Bruhnb, S., Lennartza, B., “Adsorption behaviour of Cr(VI) onto macro and micro-vesicular volcanic rocks from water”, Separ. Purif. Tech., 78, 55-61 (2011).
5 Beukes, J.P., Pienaar, J.J., Lachmann, G., Giesekke, E.W., “The reduction of hexavalent chromium by sulphite in wastewater”, Water Sou. Afr., 25, 363-370 (1999).
6 Wojcika, G., Neagub, V., Buniab, I., “Sorption studies of chromium(VI) onto new ion exchanger with tertiary amine, quaternary ammonium and ketone groups”, J. Hazard. Mater., 190, 544-552(2011).
7 Wang, Y.T., Shen, H., “Bacterial reduction of hexavalent chromium”,J. Indust. Microbiol., 14, 159-163 (1995).
8 Albadarin, A.B., Al-Muhtaseb, A.H., Walker, G.M., Allen, S.J.,Ahmad, M.N.M., “Retention of toxic chromium from aqueous phase by H3PO4-activated lignin: Effect of salts and desorption studies”,Desalination, 274, 64-73 (2011).
9 Cronje, K.J., Chetty, K., Carsky, M., Sahu, J.N., Meikap, B.C., “Optimization of chromium(VI) sorption potential using developed activated carbon from sugarcane bagasse with chemical activation by zinc chloride”, Desalination, 275, 276-284 (2011).
10 Uddin, M.T., Rukanuzzaman, M., Khan, M., M.M., Islam, M.A.,“Adsorption of methylene blue from aqueous solution by jackfruit(Artocarpus heteropyllus) leaf powder: A fixed-bed column study”, J.Environ. Manag., 90, 3443-3450 (2009).
11 Muthukumaran, K., Sophie, B., “Removal of chromium (VI) from wastewater using chemically activated Syzygium jambolanum nut carbon by batch studies”, Procedia Environ. Sci., 4, 266-280 (2011).
12 Klimaviciute, R., Bendoraitiene, J., Rutkaite, R., Zemaitaitis, A.,“Adsorption of hexavalent chromium on cationic cross-linked starches of different botanic origins”, J. Hazard. Mater., 181,624-632 (2010).
13 Albadarin, A.B., Al-Muhtaseb, A.H., Al-laqtah, N.A., Walker, G.M.,Allen, S.J., Ahmad, M.N.M., “Biosorption of toxic chromium from aqueous phase by lignin: mechanism, effect of other metal ions and salts”, Chem. Eng. J., 169, 20-30 (2011).
14 Maji, S.K., Pal, A., Pal, T., Adak, A., “Modeling and fixed bed column adsorption of As(III) on laterite soil”, Separ. Purif. Tech., 56,284-290 (2007).
15 Li, F., Yuasa, A., Ebie, K., Azuma, Y., “Microcolumn test and model analysis of activated carbon adsorption of dissolved organic matter after precoagulation: effects of pH and pore size distribution”, J.Colloid Inter. Sci., 262, 331-341 (2003).
16 Liu, K.T., Weber, W.J., “Characterization of mass transfer parameters for adsorber modeling and design”, J. Water Pollut. Control Feder., 53, 1541-1550 (1981).
17 Thomas, H.C., “Heterogeneous ion exchange in a flowing system”, J.Amer. Chem. Society, 66, 1664-1666 (1966).
18 Yan, G.Y., Viraraghavan, T., Chen, M., “A new model for heavy metal removal in a biosorption column”, Adsorp. Sci. Technol., 19,25-43 (2001).
19 Hutchin, R.A., “New simplified design of activated carbon systems”,J. Amer. Society, 80, 133-136 (1973).
20 Aksu, Z., Gönen, F., “Biosorption of phenol by immobilized activated sludge in a continuous packed bed: prediction of breakthrough curves”, Process Biochem., 39, 599-613 (2004).
21 Kumar, P.A., Chakraborty, S., “Fixed-bed column study for hexavalent chromium removal and recovery by short-chain polyaniline synthesized on jute fiber”, J. Hazard. Mater., 162, 1086-1098(2009).
22 Rozada, F., Otero, M., García, A.I., Morán, A., “Application in fixed-bed systems of adsorbents obtained from sewage sludge and discarded tyres”, Dyes Pigm., 72, 47-56 (2007).
23 Adak, A., Pal, A., “Removal of phenol from aquatic environment by SDS-modified alumina: Batch and fixed bed studies”, Separ. Purif.Tech., 50 256-262 (2006).
24 Bohart, G.S., Adams, E.Q., “Behavior of charcoal towards chlorine”,J. Chem. Society, 42, 523-529 (1920).
25 Ayoob, S., Gupta, A.K., Bhakat, P.B., “Analysis of breakthrough developments and modeling of fixed bed adsorption system for As(V)removal from water by modified calcined bauxite (MCB)”, Separ.Purif. Tech., 52, 430-438 (2007).
26 Hutchins, R.A., “New method simplifies design of activated-carbon system”, Amer. J. Chem. Eng., 80, 133-138 (1973).
27 Padmesh, T.V.N., Vijayaraghavan, K., Sekaran, G., Velan, M., “Biosorption of Acid Blue 15 using fresh water macroalga Azolla filiculoides: Batch and column studies”, Dyes Pigmen., 71, 77-82 (2006).
28 Hayashi, J., Kazehaya, A., Muroyama, K., Watkinson, A.P., “Preparation of activated carbon from lignin by chemical activation”, Carbon, 38, 1873-1878 (2000).
29 Gilcreas, F.W., Tarars, V., Ingols, R.S., “Standard Methods for the Examination of Water and Wastewater”, American Public Health Association (APHA) Inc., New York (1965).
30 Park, D., Yun, Y.S., Lee, H.W., Park, J.M., “Advanced kinetic model of the Cr(VI) removal by biomaterials at various pHs and temperatures”, Bioresour. Technol., 99, 1141-1147 (2008).
31 Suksabye, P., Thiravetyan, P., Nakbanpote, W., “Column study of chromium(VI) adsorption from electroplating industry by coconut coir pith”, J. Hazard. Mater., 160, 56-62 (2008).
32 Malkoc, E., Nuhoglu, Y., Dundar, M., “Adsorption of chromium(VI)on pomace-An olive oil industry waste: Batch and column studies”,J. Hazard. Mater., B138, 142-151 (2006).
33 Chu, K.H., “Improved fixed-bed models for metal biosorption”,Chem. Eng. J., 97, 233-239 (2004).
34 Calero, M., Hernáinz, F., Blázquez, G., Tenorio, G., Martín-Lara,M.A., “Study of Cr (III) biosorption in a fixed-bed column”, J. Hazard. Mater., 171, 886-893 (2009).
35 Sarin, V., Singh, T.S., Pant, K.K., “Thermodynamic and breakthrough column studies for the selective sorption of chromium from industrial effluent on activated eucalyptus bark”, Bioresour. Technol.,97, 1986-1993 (2006).
36 Faust, S.D., Aly, O.M., Adsorption Processes for Water Treatment,Butterworth Publishers, USA (1987).
37 Fan, Q., Shao, D., Lu, Y., Wu, W., Wang, X., “Effect of pH, ionic strength, temperature and humic substances on the sorption of Ni(II)to Na-attapulgite”, Chem. Eng. J., 150, 188-195 (2009).
38 Gokhale, S.V., Jyoti, K.K., Lele, S.S., “Modeling of chromium (VI)biosorption by immobilized Spirulina platensis in packed column”, J.Hazard. Mater., 170, 735-743 (2009).
39 Wu, J., Yu, H.Q., “Biosorption of 2,4-dichlorophenol from aqueous solutions by immobilized Phanerochaete chrysosporium biomass in a fixed-bed column”, Chem. Eng. J., 138, 128-135 (2008).
40 Vijayaraghavan, K., Prabu, D., “Potential of Sargassum wightii biomass for copper(II) removal from aqueous solutions: Application of different mathematical models to batch and continuous biosorption data”, J. Hazard. Mater., 137, 558-564 (2006).
41 El Qada, E.N., Allen, S.J., Walker, G.M., “Adsorption of basic dyes onto activated carbon using microcolumns”, Ind. Eng. Chem. Res.,45, 6044-6049 (2006).
42 Ko, D.C.K., Porter, J.F., McKay, G., “Correlation-based approach to the optimization of fixed-bed sorption units”, Ind. Eng. Chem. Res,38, 4868-4877 (1999).
43 Chen, N., Zhang, Z.Y., Feng, C.P., Li, M., Chen, R.Z., Sugiura, N.,“Investigations on the batch and fixed-bed column performance of fluoride adsorption by Kanuma mud”, Desalination, 268, 76-82(2011).
2012-02-17, accepted 2012-05-23.
* To whom correspondence should be addressed. E-mail: g.walker@qub.ac.uk
 Chinese Journal of Chemical Engineering2012年3期
- Chinese Journal of Chemical Engineering的其它文章
- Adsorptive Removal of Para-chlorophenol Using Stratified Tapered Activated Carbon Column
- Flame Imaging in Meso-scale Porous Media Burner Using Electrical Capacitance Tomography*
- Top-cited Articles in Chemical Engineering in Science Citation Index Expanded: A Bibliometric Analysis
- Mass Transfer of Copper(II) in Hollow Fiber Renewal Liquid Membrane with Different Carriers*
- Analysis of Absorption and Reaction Kinetics in the Oxidation of Organics in Effluents Using a Porous Electrode Ozonator*
- Advances in Large-eddy Simulation of Two-phase Combustion (I)LES of Spray Combustion*