
Transmission cable fault detector based on waveform reconstruction
2013-01-08 08:26WuJianfengYuZhongzhouLiJianqingWangLeiLiXiaoming
Wu Jianfeng Yu Zhongzhou Li Jianqing Wang Lei Li Xiaoming
(1 School of Instrument Science and Engineering, Southeast University, Nanjing 210096, China)(2 School of Automation, Nanjing Institute of Technology, Nanjing 210013, China)
Cable testing and fault finding disciplines are well employed in the telecommunication and electrical power utility industry for a good quality of signal transmission service to telephone subscribers and a stable electrical energy supply to domestic and industrial consumers. Traditional cable fault detection methods[1], such as the electric bridge method, the sound playback method, the capacitance and resistance test method, are always time-consuming, labor-intensive and complex to use and they are also of low precision in fault location. In recent years, scientists have introduced some new methods to improve the test accuracy on cable fault diagnosis and its positioning technology such as the frequency-domain reflection (FDR) method[2]and the time-domain pulse reflection (TDR) method[3-12]. TDR is instrumental in the development of test and measurement calibration for transmission cable characterization and reconstruction in domestic and industrial applications. In these methods, expensive instruments such as the high-frequency oscilloscope[5]or the vector network analyzer[9]are necessary.
In order to improve the precision of cable fault position location at a low cost and make the testing results intuitive, a cable fault detector based on the time-domain multi-pulse reflection method is introduced in this paper. This detector uses a cheap high-speed comparator[8]and a FPGA chip to sample and reconstruct the pulse waveform transmitted in the tested cable. By analyzing the reconstructed waveform, the cable fault type and its location can be achieved, and different properties of the tested cables can also be found by comparing the reflected pulse waveform.
1 Test Mechanism
1.1 Cable fault distance test mechanism
Pair cables always have an open circuit fault or a short circuit fault. While an electric pulse is loaded on a proximal endpoint of pair cables, the pulse begins to transmit on it, as shown in Fig.1. If the two cables are electrical open circuit or electrical short circuit at a pointL0away from the local place, the pulse will reflect at the cable fault position. If the cable fault is open circuit, the reflected pulse will keep its polarity (see Fig.1(a)). When the cable fault is short circuit, the negative polarity reflected pulse (see Fig.1(b)) will be received. The timeT1between transmitting the original pulse and receiving the first reflected pulse is proportional to the distance between the cable fault position and its proximal endpoint. If the electric pulse propagation velocityvis a constant,L0can be calculated as
(1)
Also a new reflected pulse will occur on the proximal endpoint, and so on. Under the ideal conditions, the pulse will transmit on the cable forever. So several reflected pulses can be received at the proximal endpoint. But in the real case, the pulse will attenuate and distort, and the pulse waveform on the cables with a short circuit will attenuate and distort more rapidly than the one on the open circuit cables. So only several reflected pulses will be received. Also attenuation and distortion of pulses have some relationship with the properties of the tested cables.
Fig.1 Time-domain pulse reflection mechanism.(a) Open circuit waveform; (b) Short circuit waveform;(c) Binary signal; (d) Clock signal
IfNpulse waveforms are received in the test process,L0can be calculated as
(2)
whereTis the clock cycle; ΔCis the count value from the original pulse to the last pulse;vis the propagation velocity of the pulse.
From Eq.(2), we know that differentTcorresponds to different resolutions. When the maximum count value is fixed, the smaller theTvalue, the higher the precision and the smaller the measured range.
1.2 Pulse waveform reconstruction method (PWRM)
A high-speed comparator is specially designed to binarize the test pulse waveform (see Figs.1(a) and (b)) to a binary sequence (see Fig.1(c)) at a certain reference voltage. The negative input port of the high-speed comparator is connected to the reference voltage, and the positive input port is connected to the tested cable port. For different reference voltages, their binary sequence data are different. By changing the reference voltage from high to low, we can obtain some binary sequences (see Fig.2 (a)).
Letidenote thei-th reference voltage level andjdenote thej-th time interval. All the lattices in Fig.1 are indexed withiandj. The voltage at the test port can be denoted asVij. If all the binary sequences are aligned at every clock, we can obtain a new data sequence by adding the same clock binary data together as
(3)
With the new data sequence, we can obtain a broken-line waveform as shown in Fig.2(b). It can well represent the original waveform. A better waveform can be obtained by curve fitting, as shown in Fig.2(c).

Fig.2 Reconstructing schematic of pulse waveform. (a)Binary sequences; (b) Broken-line waveform;(c) Curve fitting waveform
2 System Function Structure of the Detector
The system function structure of the cable fault detector is shown in Fig.3. An Altera Cyclone Ⅲ EP3C10E144C8N chip is implemented in our cable fault detector, and its fastestTis 2ns. In the FPGA chip, an embedded NIOS software core is designed as a center processor; a PWM wave module is designed to generate amplitude adjustable reference voltage for the high-speed comparator; and a shift register module with 2048 D-Triggers is designed to collect the binary sequence signal from the high-speed comparator. If more D-Triggers are used, more waveforms data are recorded, and the data processing time is longer. To meet the requirements of different test ranges and test accuracy, 200 MHz and 500 MHz clock frequencies are implemented in the FPGA chip by a phase-lock loop. In the detector, a SDRAM memory chip is used to store the detection signal collected by the shift register module. An LCD monitor is used to display the reconstruction waveform and the waveform analysis results. A UART interface is used for the data communication between the cable fault detector and the host computer.
Fig.3 System function structure of the cable fault detector
3 Experimental Results and Discussion
3.1 Open circuit experiment
Pair net cables with a length of 14.0 m are tested. One endpoint is connected to the test detector, and the other endpoint keeps the electrical circuit open. In the test, the clock cycle is 2 ns; the propagation velocity is 2.0×10⁸m/s and the stimulated pulse width is 30 ns. By scanning the reference voltage from+1.0 to+4.0 V, 18 groups of bit binary sequences are acquired. With the PWRM, the pulse waveform is reconstructed as shown in Fig.4(a).
Fig.4 Electrical open cable test results. (a) Proposed detector; (b) TDS1012 oscilloscope
A TDS1012 oscilloscope gives a reference test pulse waveform for comparison (see Fig.4(b)). In Fig.4, the first pulse is the stimulated pulse and other pulses are reflected pulses for the electrical open circuit. Since the reference voltage is between+1.0V and +4.0V, the waveform under+1.0V is removed. From Fig.4, multi reflected pulses with amplitudes gradually attenuating can be found. By comparing the amplitude attenuation of reflected pulses, we can know the aging properties of the net cable. From this reconstructed waveform, we know that the net cable is electrical open. From the test data, the peak time of reflected pulses are shown in the first line in Tab.1.
Tab.1 Electrical open test results of 14.0 m ns
3.1.1 Multi pulse peak time difference method (MPPTM)
From Fig.4, eight pulses (N=8) are found; the peak time of the first pulse is 26 ns and the peak time of the last pulse is 1034 ns, so ΔT=1008 ns andT=2 ns,V=200 m/μs. From Eq.(2),L0=14.4 m. The test error is 2.9%.
3.1.2 Single pulse peak time difference method (SPPTDM)
From Fig.4, the peak time difference values of the pulses are shown as the second line in Tab.1. From Eq.(1), the average cable length using SPPTDM is 14.2 m and its test error is 1.4%.
3.1.3 Pulse waveform gravity center method (PWGCM)
From the test data of Fig.4, we can calculate every gravity center time of each pulse waveform. Then the time difference values of every gravity center of the pulses are shown in the third line in Tab.1. From Eq.(1), the average cable length using PWGCM is 14.32 m, and its test error is 2.2%.
3.2 Short circuit experiment
A pair cable of one net cable with a length of 100.0 m is tested. One endpoint is connected to the test detector, and the other endpoint remains electrical short. In this test, the clock cycle is 5 ns and the stimulated pulse width is 50 ns. By scanning the reference voltage from -1.5V to+4.0V, 28 groups of bit binary sequences are acquired. With the PWRM, the pulse waveform is reconstructed as shown in Fig.5(a). Also, a TDS1012 oscilloscope gives a reference test pulse waveform for comparison as shown in Fig.5(b).
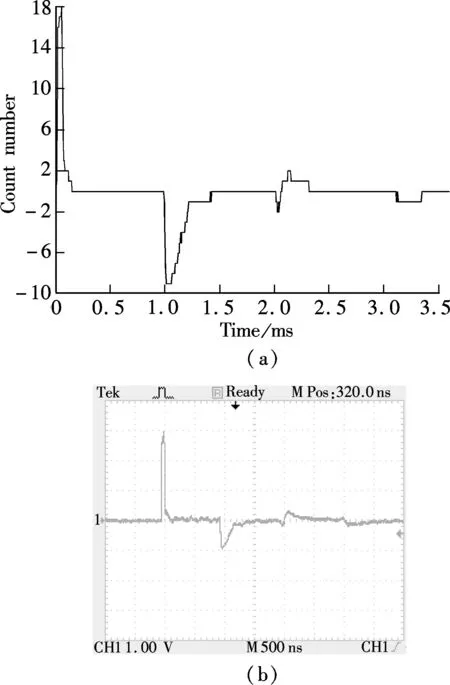
Fig.5 Short circuit cable test results. (a) Proposed detector; (b) TDS1012 oscilloscope
As shown in Figs.5(a) and (b), the reflected pulse waveforms attenuate and distort rapidly. Only two negative reflected pulses and one positive reflected pulse can be used. The following pulse waveform is difficult to use since there is too much noise in it. From this pulse waveform, we know that the cable is electrical short circuit. By analysis, the forefront of the pulse waveform is suitable for testing the short circuit cable. The electrical short circuit test results are shown in Tab.2. The average length of the cable is 103.5 m and the best result is 99.0 m.

Tab.2 Short circuit test results of 100.0m ns
4 Conclusion
A cable fault detector based on the time-domain multi-pulses reflection method is introduced. The detector can reconstruct the pulse waveform in the cable fault test. With the reconstructed pulse waveform, the fault type and its location on the tested cable can be achieved. From the experimental results, it can be seen that the SPPTDM and PWGCM have better effects on locating the electrical open position of the cable, and the forefront of every pulse waveform is suitable for the testing of the short circuit cable.
[1]Xu Binggeng, Li Shengxiang, Chen Zongjun.Communicationcablelinefaulttestingtechniques[M]. Beijing: Beijing University of Posts and Telecommunications Press, 2000. (in Chinese)
[2]Dodds D E, Shafique M, Celaya M. TDR and FDR identification of bad splices in telephone cables[C]//CanadianConferenceonElectricalandComputerEngineering. Ottawa, Canada, 2006:838-841.
[3]Guinee R A. A novel pulse echo correlation tester for transmission line fault location and identification using pseudorandom binary sequences[C]//34thAnnualConferenceoftheIEEEIndustrialElectronicsSociety. Orlando, Florida, USA, 2008: 1833-1838.
[4]Agilient Technologies. Time domain reflectometry theory application note 1304-2[EB/OL]. (2006-05-10)[2012-06-10].http://cp.literature.agilent.com/litweb/pdf/5966-4855E.pdf.
[5]Horan D M, Guinee R. A novel pulse echo correlation tool for transmission path testing and fault finding using pseudorandom binary sequences[C]//IEEEInternationalSymposiumonDefectandFaultToleranceinVLSISystems. Monterey, CA, USA, 2005: 229-237.
[6]Vanaja R, Udayakumar K. Fault location in power transformers during impulse tests[C]//ProceedingsofIEEEPowerEngineeringSociety2000WinterMeeting. Singapore, 2000: 2199-2204.
[7]Anderson W E, Ramboz J D, Ondrejka A R. The detection of incipient faults in transmission cables using time domain reflectometry techniques: technical challenges[J].IEEETransactionsonPowerApparatusandSystems, 1982,PAS-101(7):1928-1934.
[8]Xu Yi, Wu Jianfeng, Li Jianqing. Development of new multifunctional instrument for measuring faulted cables used in network[J].InstrumentTechniqueandSensor, 2009 (4):117-120. (in Chinese)
[9]Liu Y, Tong L, Zhu W X, et al. Impedance measurements of nonuniform transmission lines in time domain using an improved recursive multiple Reflection computation method[J].ProgressinElectromagneticsResearch, 2011,117:149-164.
[10]Wu Jianfeng, Li Jianqing, Wang Yinan, et al. A wired sensor network nodes ranging method[J].InstrumentTechniqueandSensor, 2012(2):71-73. (in Chinese)
[11]Parkey C, Hughes C, Locken N. Analyzing artifacts in the time domain waveform to locate wire faults[J].IEEEInstrumentation&MeasurementMagazine, 2012,15(4):16-21.
[12]Abboud L, Cozza A, Pichon L. A matched-pulse approach for soft-fault detection in complex wire networks[J].IEEETransactionsonInstrumentationandMeasurement, 2012,61(6): 1719-1732.
 Journal of Southeast University(English Edition)2013年1期
- Journal of Southeast University(English Edition)的其它文章
- Uplink capacity analysis of single-user SA-MIMO system
- A broad-band sub-harmonic mixer for W-band applications
- Feature combination via importance-inhibition analysis
- Force measurement between mica surfaces in electrolyte solutions
- Flexural behaviors of double-reinforced ECC beams
- Heat flow balance and control strategies for a large GSHP