
Identification of unconditional and conditional QTL for oil,protein and starch content in maize
2013-03-13 05:50YuqiuGuoXiohongYngSubhshChnderJinbingYnJunZhngTongmingSongJinshengLi
The Crop Journal 2013年1期
Yuqiu Guo,Xiohong Yng,Subhsh Chnder,Jinbing Yn,c,Jun Zhng,Tongming Song,Jinsheng Li,*
aNational Maize Improvement Center of China,Beijing Key Laboratory of Crop Genetic Improvement,China Agricultural University,Beijing 100094,China
bCrop Research Institute,Shandong Academy of Agricultural Sciences,Jinan,Shandong 250100,China
cNational Key Laboratory of Crop Genetic Improvement,Huazhong Agricultural University,Wuhan,Hubei 430070,China
1.Introduction
Kernel oil,protein and starch content are considered as paramount target traits in maize breeding due to their nutritional and economic importance.Genetic improvement of relative proportions of oil,protein or starch in maize grain could be beneficial for specific end-uses.High-oil maize with oil content of >6% has higher caloric and better nutritional quality,and is therefore important for vegetable oil for human consumption and animal feed [1–3].In addition,high-starch maize adds value for ethanol production.
The first systematic effort to explore selective responses to maize kernel chemical compositions was initiated using an open-pollinated variety Burr's White in 1896,and nine related populations,such as IHO(Illinois High Oil)and ILO(Illinois Low Oil),and IHP(Illinois High Protein)and ILP(Illinois Low Protein),were derived after 103 cycles of selection [4].In China,the development of high-oil maize germplasm was readdressed in the early 1980s[5],and five high-oil populations were developed over one decade [6].Among these populations,one high-oil population,Beijing High Oil(BHO),was derived from synthetic variety Zhongzong No.2,and its oil content had increased from 4.71 to 15.55% after 18 cycles of selection.These long-term experiments provide useful genetic resources to investigate the genetic basis of chemical composition in maize kernels[4].
With the development of molecular marker technology and statistical methods in QTL mapping,several reports were published on dissection of the genetic basis of kernel chemical composition,including oil,protein and starch content,in various populations generated from the Illinois long-term experiments [7–13] and other genetic background materials[14–18].A number of QTL for these quality traits were mapped to various chromosomal regions in populations with different genetic backgrounds.However,the genetic relationships among these three quality traits remained unknown at the individual QTL level although the relationship among them was clear from the phenotypic data.
Identification of conditional QTL provides an alternative way for exploring the genetic relationship of related quantitative traits.The only difference from general QTL mapping is that the phenotypic data used in conditional QTL mapping is the target trait values conditioned on related traits.A statistical method was initially proposed for analyzing conditional genetic effects and variance components [19],and had been mainly used in developmental quantitative genetics [20–22].With the combination of QTL mapping,conditional QTL mapping was widely used to dissect the genetic basis of agronomic traits in rice,maize and soybean at different developmental stages [23–29].Zhao et al.also used this approach to dissect the genetic interrelationship between two traits at the level of individual QTL,and to identify additional small-effect QTL that were not detected in unconditional mapping[30].
In this study,an RIL population,derived from a single cross of high-oil line By804 and regular line B73,was used to: map unconditional and condition QTL for oil,protein and starch content in maize kernels; explore the genetic interrelationships among three quality traits based on identified conditional and unconditional QTL.
2.Materials and methods
2.1.Plant materials and field experiments
An RIL population consisting of 245 F7:8lines derived from a cross between regular inbred line,B73,and high-oil inbred line,By804 (derived from BHO after 13 selection cycles),was utilized in the present study.The RIL population,along with its parents,was evaluated in a randomized complete block design with three replications at the Agronomy Farm,China Agricultural University,Beijing,over two years (2005 and 2006).Each line was grown in a single row of 3 m with a planting density of 45,000 plant ha-1.The row-to-row distance was kept at 67 cM.For each line,more than six plants in each row were pollinated with bulked pollen collected within the row.Only pollinated ears were harvested at maturity,and equal amounts of grains from each harvested ear were bulked for measuring oil,protein and starch content.
2.2.Measurements of oil,protein and starch content
Two hundred and twenty four RILs with sufficient amounts of well-developed kernels from three field replications over two years were utilized for phenotyping.For each line,approximately 200 randomly chosen kernels from the bulked grain were analyzed by a VECTER22/N near-infrared analyzer(Bruker Corporation,Germany)for oil,protein and starch content.
2.3.Genotyping and construction of genetic linkage map
Genomic DNA was extracted from young leaves of 245 RILs using the CTAB method [31].DNA amplification procedure was: template DNA 50 ng,0.67 μmol L-1of each forward and reverse primer,1.5 μL of 10×PCR reaction buffer,2.5 mmol L-1MgCl2,0.2 mmol L-1of each dNTP,Taq DNA polymerase of 0.5 U,made to the final volume of 15 μL with deionized double distilled water.PCR were programmed as denaturation at 95 °C for 5 min,followed by 35 cycles of denaturation at 95 °C for 0.5 min,annealing at 58 °C for 0.5 min and elongation at 72 °C for 1 min,with a final extension at 72 °C for 10 min and storage in a refrigerator at 4 °C.Amplified PCR products were separated by 6% polyacrylamide gel electrophoresis (PAGE)and visualized by silver-staining[32].
MAPMAKER/EXP 3.0 [33] was used to construct a genetic linkage map for the RIL population.The critical LOD score for the tests of independence of marker pairs was set at 3.0 and the Kosambi mapping function was used for the calculation of map distances.The sequence command was used to obtain linkage groups for all markers.The order of markers within the linkage groups was determined by the ‘compare' command,and finally the‘ripple'command was used to establish the most likely marker order.
2.4.Data analysis and QTL mapping
The variance components of oil,protein and starch content were estimated using PROC GLM in SAS 8.02 software (SAS Institute,Kerry).On the basis of variance components,broadsense heritability(H2b)was calculated according to Knapp et al.[34].The Shapiro–Wilk normality test was used to test whether the trait values follow normal distribution.Genotypic and phenotypic correlation coefficients were calculated for oil,protein and starch content using the MINQUE method,and significance levels of the correlation coefficients were derived by a jackknife re-sampling procedure[35].Conditional phenotypic values y (T1|T2) were obtained using a mixed model approach for the conditional analysis of quantitative traits[19],where T1|T2 means trait 1 conditioned on trait 2.
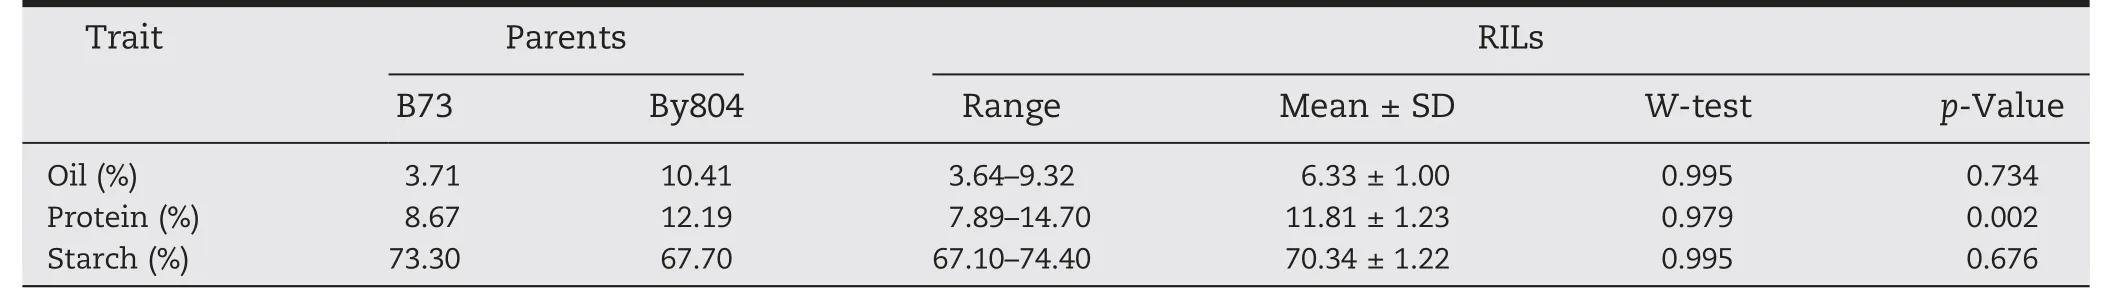
Table 1-Descriptive statistics of oil,protein and starch content in the RIL population and parents.
QTL mapping and estimation of QTL effects were conducted following composite interval mapping(CIM)[36]using Model 6 of the Zmapqtl procedure in QTL Cartographer Version 2.5[37].QTL were identified at 2 cM intervals with a window size of 10 cM.Five background cofactors were chosen by forward–backward stepwise regression,and genome-wide threshold values (α = 0.05) for declaring the presence of QTL were estimated by 1000-permutations [38,39].The marker interval of each QTL was considered by 1-LOD support interval on either side of the peak,and the position of the highest LOD peak within the range was taken to be the QTL position.The additive effect and percentage of phenotypic variation explained by each QTL were obtained from the final CIM results.The total genetic variance explained by all QTL was estimated by multiple interval mapping (MIM) [40] using windows QTL Cartographer Version 2.5[37].
3.Results
3.1.Variations in oil,protein and starch content
Significant differences between the two parents and ranges of variation in the RIL population were investigated for oil,protein and starch content(Table 1).Normal distributions were observed for all traits except protein content(Table 1).The mean value of RIL was 6.33%,11.81% and 70.34% for oil,protein,and starch content,respectively.The genotypic and phenotypic correlations among these traits showed highly significant negative correlations between starch content and oil and protein content whereas there was a significant positive correlation between oil and protein content(Table 2).Thus,conditioning the content of one component over another led to a strong reduction of variance (Table 2).The broad-sense heritabilities (H2b) for oil,protein and starch content were 94.0,92.1 and 91.3%,respectively.High heritability levels indicated that kernel composition was stable over environments(Table 2).
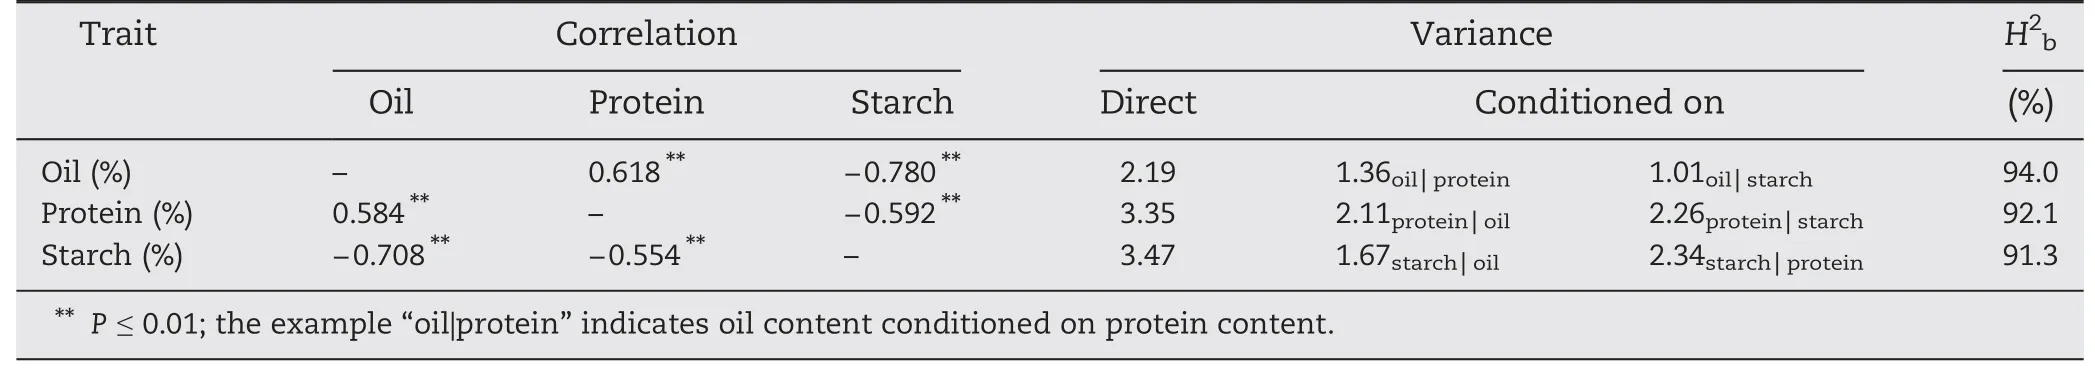
Table 2-Genotypic(above diagonal),phenotypic(below diagonal)correlations,phenotypic variances(one trait conditioned on the other two traits)and broad-sense heritabilities(H2b)for oil,protein and starch content.
3.2.Genetic linkage map
A total of 236 molecular markers including 211 SSR (Simple Sequence Repeats),6 CAPS (Cleaved Amplified Polymorphic Sequences),5 STS (Sequence Tagged Sites),2 SNP (Single Nucleotide Polymorphisms) and 12 IDP (InDel Polymorphisms) were used to construct a genetic linkage map of the B73 × By804 RIL population (Fig.1).The proportion of lines with B73 homozygous markers ranged from 27.5 to 70.2%with an average value of 48.9%,and that of lines with By804 homozygous markers ranged from 29.8 to 72.5% with an average value of 51.1%.Seventy eight markers showed slightly distorted segregation,and among them,27 were skewed towards B73 and 51 towards By804.The total length of the genetic map was 1693.3 cM with an average marker interval of 7.18 cM.The numbers of markers on each chromosome ranged from 17 (chromosomes 4 and 5) to 36 (chromosome 6),whereas the linkage groups varied in size from 101.2 cM(chromosome 10)to 273.3 cM(chromosome 1).
3.3.Unconditional QTL for oil,protein and starch content
For oil content,unconditional QTL mapping identified nine QTL across all chromosomes,except chromosomes 3 and 7(Fig.1 and Table 3).Each QTL explained 2.4 to 20.6% of the phenotypic variation,and all QTL accounted for 76.1% of the total phenotypic variation.By804 alleles at all loci had increased effects on oil content.
Five unconditional QTL were detected for protein content on five chromosomes(Fig.1 and Table 4),explaining 32.0%of the total phenotypic variation.The phenotypic variation explained by each QTL ranged from 5.2%to 9.0%.All favorable alleles were from By804.
Eight unconditional QTL were associated with starch content and explained 53.4%of the total phenotypic variation(Fig.1 and Table 5).These QTL,accounting for 4.0% to 10.2%of the phenotypic variation,were distributed across all chromosomes except chromosomes 4 and 8.The enhancing alleles at these loci were contributed by B73.
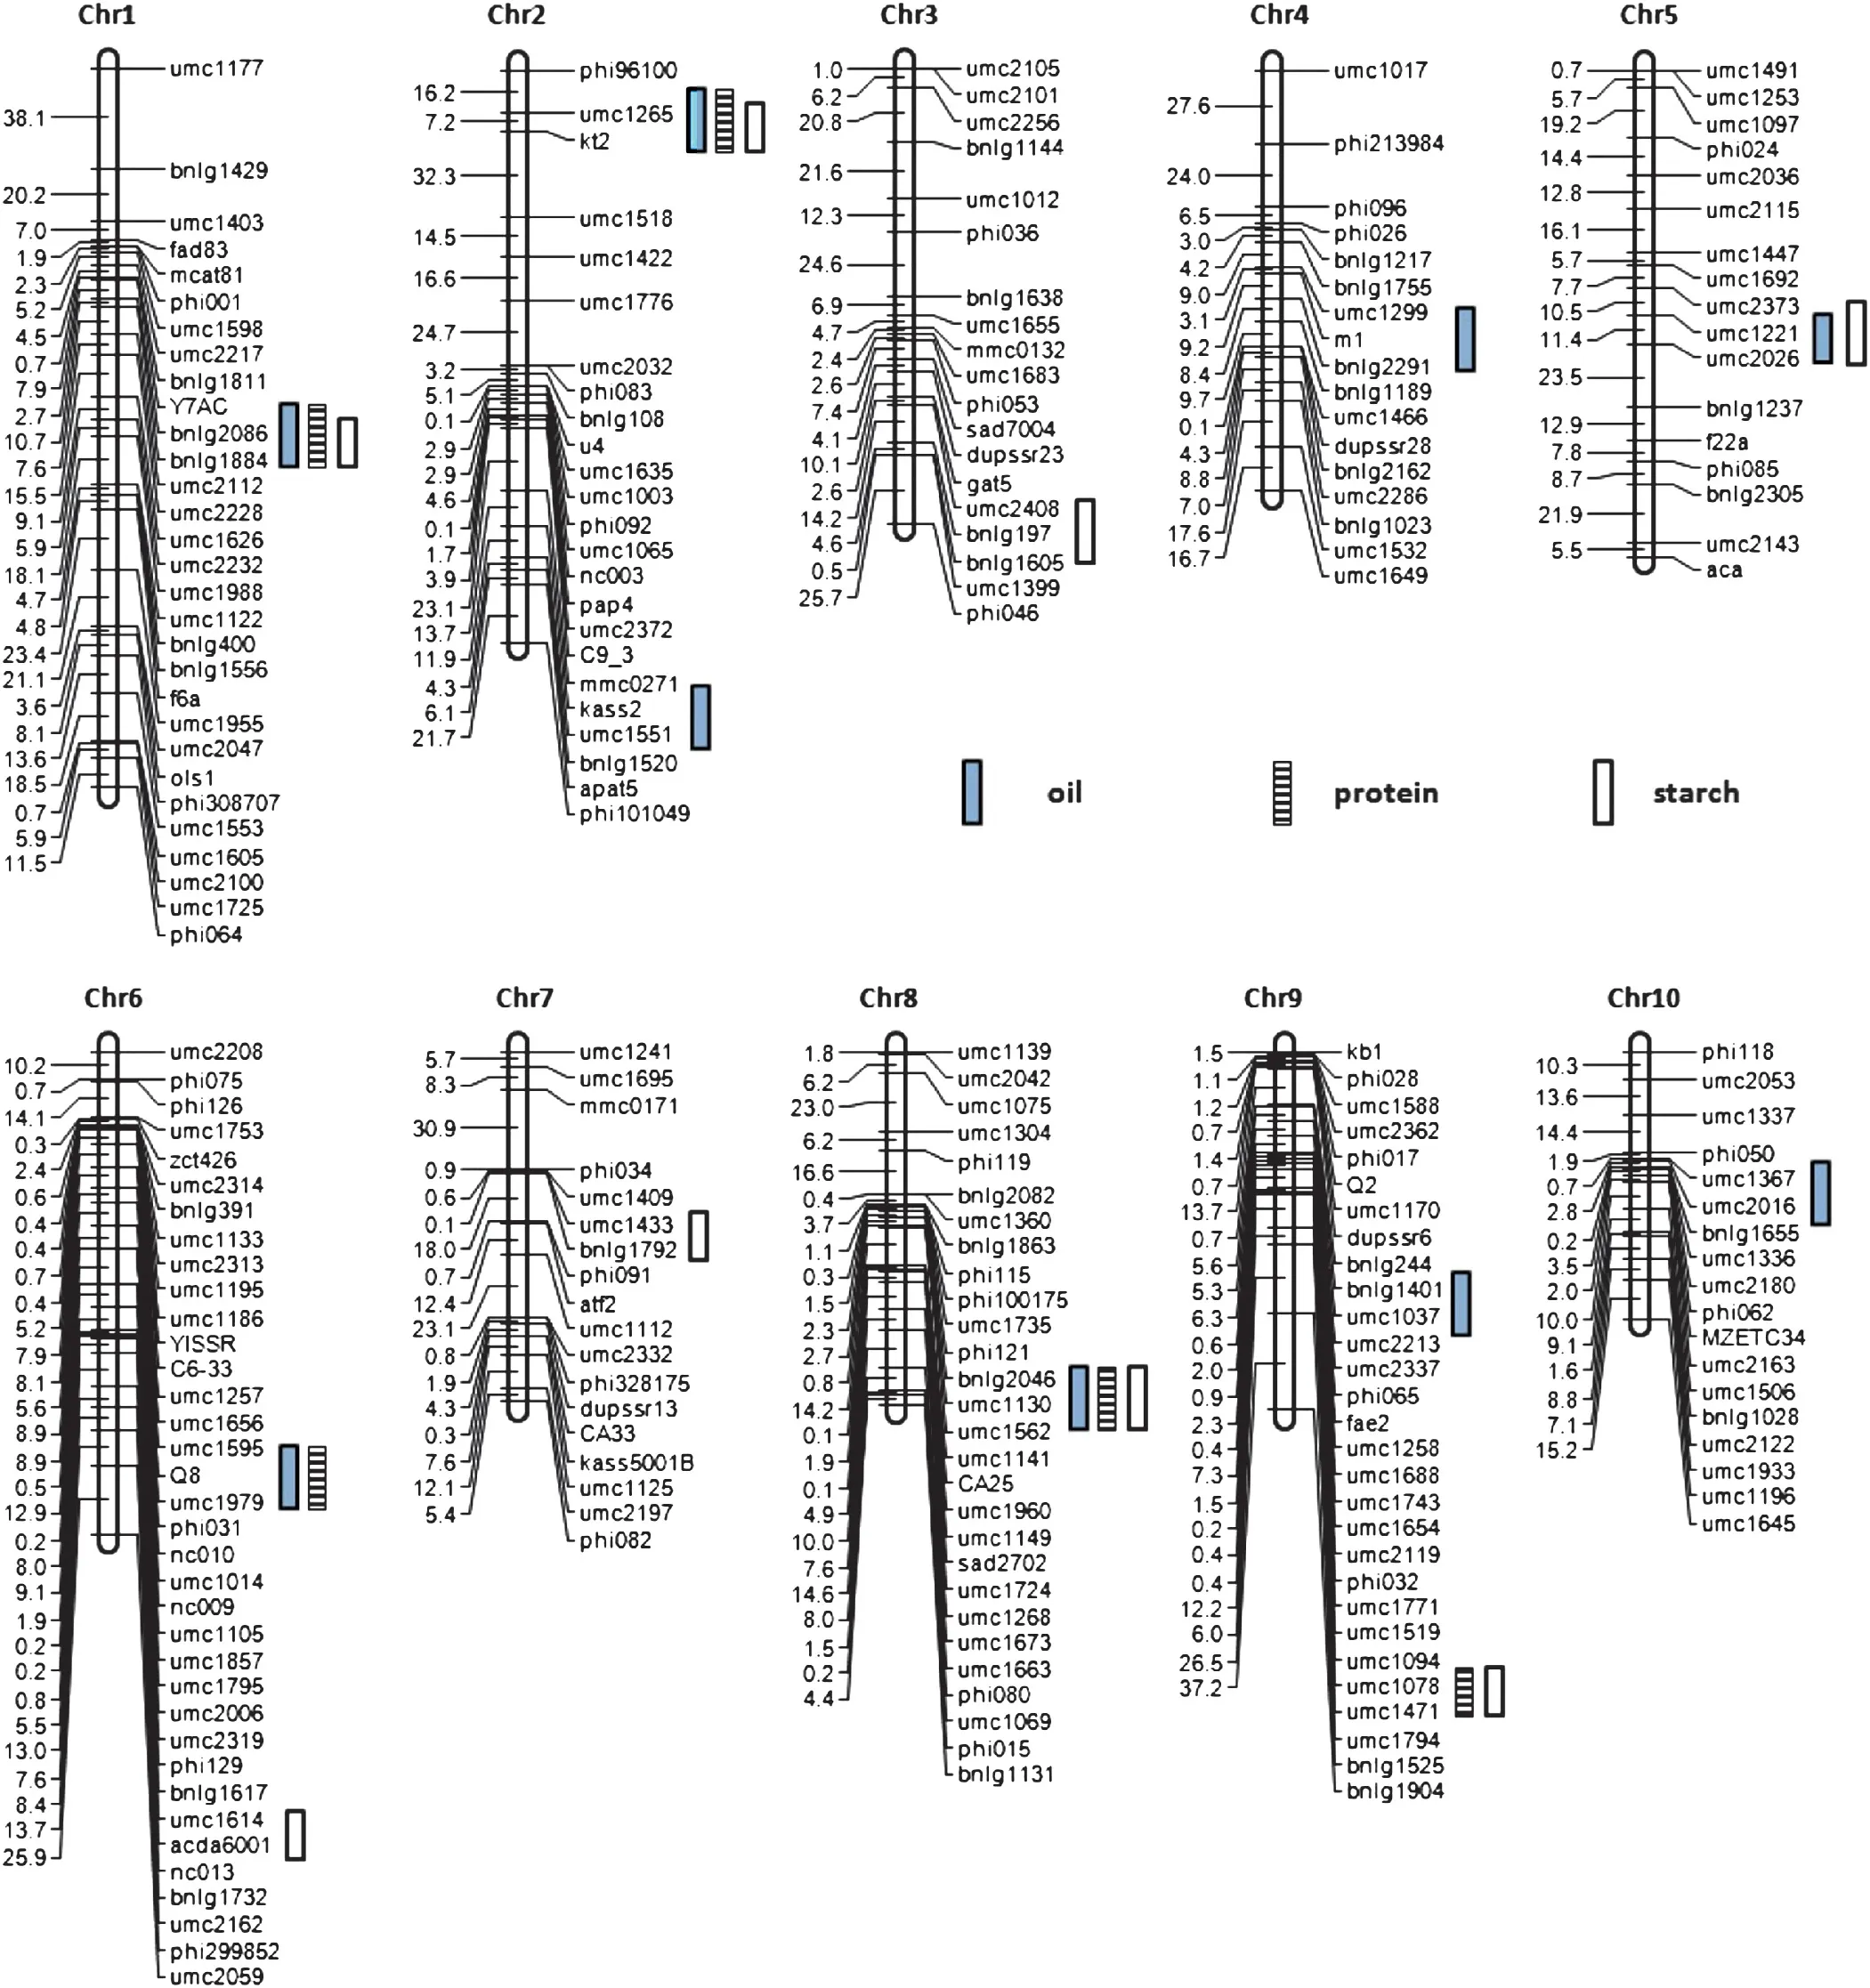
Fig.1-QTL for oil,protein and starch content in the B73 × By804 RIL population.Bars indicate the QTL identified for each trait.
3.4.Conditional QTL mapped for oil,protein and starch content
When oil content was conditioned on protein and starch content,eight QTL explaining 52.7% of the total phenotypic variation and seven QTL explaining 36.5% of the total phenotypic variation were detected,respectively.QTL mapping for oil content conditioned on protein content showed that two of nine QTL for oil content located on chromosomes 8 and 9 failed to show significant effects,whereas one additional QTL was detected on chromosome 3.Four QTL showed large reductions in additive effects,whereas the other three showed only small changes in additive effects (Table 3).On the other hand,when oil content was conditioned on starch content,six of nine QTL failed to show significant effects and four new QTL were observed.There were strong reductions in additive effects by two QTL located on chromosomes 1 and 6,and one QTL on chromosome 10.

Table 3-Putative unconditional and conditional QTL for oil content in the B73 × By804 RIL population.
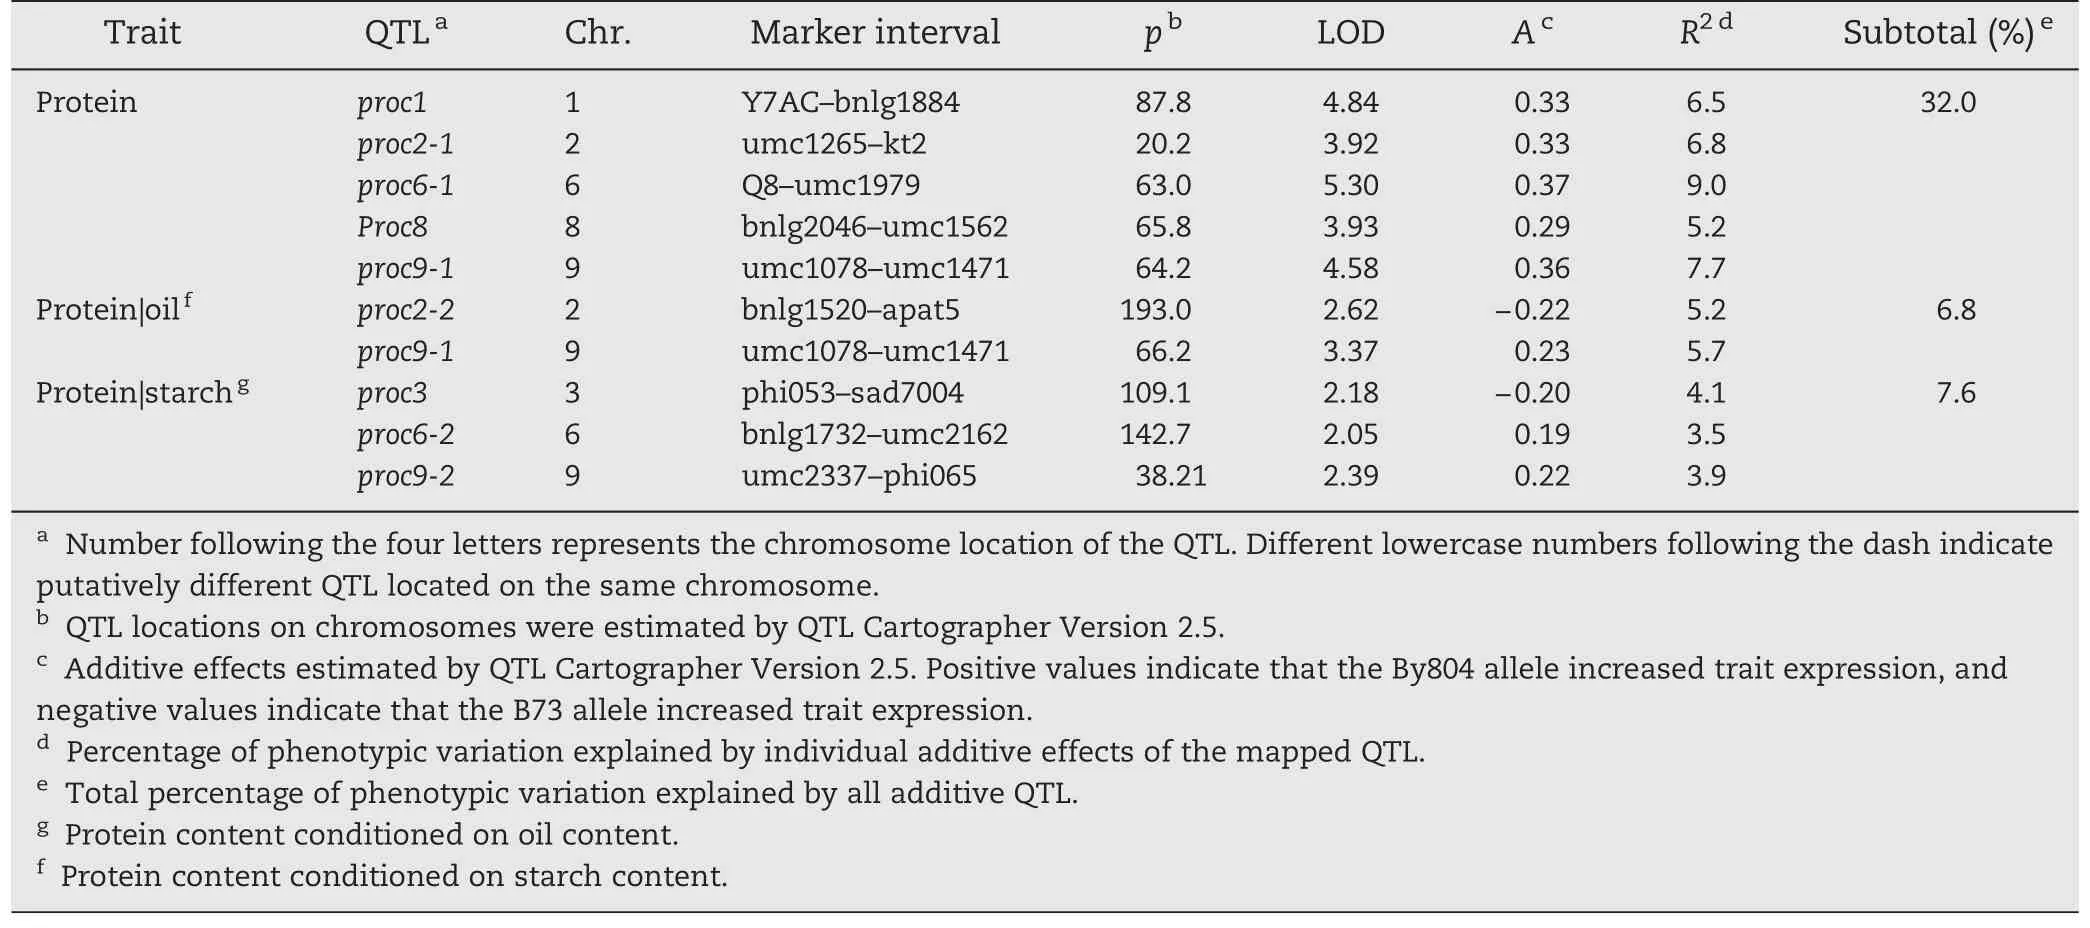
Table 4-Putative unconditional and conditional QTL for protein content in the B73 × By804 RIL population.
When protein content was conditioned on oil content,one of five QTL with reduced effects on protein content was detected,and one new QTL was identified on chromosome 2(Table 4).When starch content was conditioned,all five unconditional QTL for protein content were detected and three new QTL explaining 3.5% to 4.1% of the phenotypic variation for protein content were found.
When starch content was conditioned on kernel oil content,none of QTL showed significant effects and four additional QTL accounting for 3.2% to 6.3% of the phenotypic variation were identified (Table 5).When starch content was conditioned on protein content,only four of eight QTL were detected with slightly reduced additive effects.In addition,four new QTL were detected,accounting for 3.4%to 12.4%of the variation in starch content.
In summary,more than half of the unconditional QTL for each measured trait were not detected or showed large reductions,when conditional QTL mapping were performed.These results suggest that there is a strong genetic association among oil,protein and starch content in maize kernels.

Table 5-Putative unconditional and conditional QTL for starch content in the B73 × By804 RIL population.
4.Discussion
4.1.Comparison of QTL identified in the present study with previous reports
We detected 9,5 and 7 unconditional QTL for oil,protein and starch content in the presently investigated RIL population,one of whose parents involved BHO background.In the early generations of this RIL population (F2,F3and F2:3),a total of 26 QTL were detected(15 for oil,6 for protein,5 for starch)[15,16].Combining the present and previous studies using B73 × By804 segregating populations[15–18],10,4 and 3 QTL were detected in over at least two generations.In contrast,about 66,66 and 65 loci for oil,protein and starch content had been reported in six different populations generated from IHO germplasm [7–13].Furthermore,QTL for three quality traits detected in IHO and BHO populations were compared using the IBM neighbor genetic map (http://www.maizegdb.org/) as a bridge.For oil content,about 20 QTL were detected in both germplasms.However,the strongest QTL in IHO germplasm was detected in Bin 6.04,and QTL in Bin 1.04 had the largest effect on oil content in BHO germplasm.For protein and starch content,most of the QTL in BHO germplasm coincided with IHO germplasm except QTL proc9-1,which explained 7.7%of the phenotypic variation for protein content on chromosome 9 (Bin 9.04–9.05).These results suggest that there might be many different loci for maize kernel composition in different maize germplasms in spite of the positional consistency of QTL for oil,protein and starch content across different maize populations.
4.2.Correlations among quality traits and QTL co-locations
Oil,protein and starch are major chemical components of maize kernels.Consistent with previous studies [13,16],starch shows highly negative correlations with oil and protein content,whereas oil content showed a positive correlation with protein content in the present RIL population.These strong correlations reflect the close genetic relationships among the three quality traits.Additionally,the positive correlation between oil and protein content suggests that it might be possible to increase oil and protein content simultaneously.
Among 22 unconditional QTL for oil,protein and starch content detected in the present investigation,15 QTL were clustered in six chromosomal regions with each containing QTL for at least two traits(Fig.1 and Tables 3–5).These results also confirmed the strong correlations among oil,protein and starch content at the molecular level.In addition,common QTL associated with oil,protein and starch content on chromosomes 1,2 and 8 had positive effects on oil and protein content,and negative effects on starch content,consistent with the direction of the correlations.Furthermore,QTL on chromosome 5 for oil and starch content,QTL on chromosome 6 for oil and protein content and QTL on chromosome 9 for protein and starch content also might be common QTL as the directions of these QTL were consistent with the sign of correlations among them.Similar correlations among these quality traits at the QTL level were also investigated in previous studies [9,11,16].However,it is still difficult to conclude that the co-localized QTL detected in the present investigation is the result of true pleiotropic effects or tight linkage until they are cloned.
4.3.Comparison between unconditional and conditional QTL
Combining the conditional genetic analysis method with QTL mapping provides an alternative way to identify major traits controlled by common QTL.If the phenotypic correlations among the measured traits are high,the comparison between unconditional and conditional analysis shows an abrupt reduction in variance and a strong alteration in QTL mapping when one trait is conditioned on another.Strong reductions in variance for oil (37.9%) and protein (37.0%) content were observed when oil content was conditioned on protein content and vice-versa(Tables 2 and 3).Accordingly,two unconditional QTL for oil content and four for protein content failed to show significant effects in conditional mapping.These six QTL may be involved in interaction between oil and protein content,and could be valuable resources in marker-assisted selection for simultaneous enhancement of oil and protein content.Five QTL,oilc1-1,oilc2-1,oil5,oil6 and proc9-1,showed reduced effects in conditional QTL mapping,indicating that they mainly affected the unconditional traits and had only weak effects on the conditional traits.Three QTL,oilc2-2,oilc4-1 and oilc10,showed similar effects in both unconditional and conditional QTL mapping,showing independent effects on the unconditional traits at these loci.Additionally,two QTL,oilc3 and proc2-2,were detected in conditional QTL mapping.These results suggested that the genetic relationship between oil and protein content was complex and all of the 10 QTL were not useful for the simultaneous improvement of oil and protein content.
Higher levels of correlation between oil and starch content than between protein and starch content were reflected by the higher reduction in variance (about 52%) for oil and starch content than that for protein and starch content(about 33%) when these traits were conditioned on each other.When oil and protein content were conditioned on starch content,six of nine unconditional QTL for oil content and all of the five QTL for protein content disappeared.In contrast,all of eight and four of eight unconditional QTL for starch content failed to show significant effects in conditional QTL mapping for starch|oil and starch|protein content,respectively.These QTL are likely to represent substrate level genes that affect starch content via indirect effects.For these unconditional traits,some new QTL also appeared in conditional QTL mapping,suggesting that conditional QTL mapping could unravel additional QTL with minor effects for closely correlated traits.
One noteworthy aspect in this study was that the effects of some major unconditional QTL for these quality traits were significantly reduced under conditional QTL mapping.When oil content was conditioned on starch content,two unconditional QTL showed reduced but still significant effects,and likewise,three QTL for starch content.It indicates that these five QTL for one trait were partly affected by another trait.In contrast,the effects of two unconditional QTL,oilc10 and stc6,showed slight reductions under conditional QTL mapping.It demonstrates that these two QTL each represent QTL that influence one trait independently of another trait.
4.4.Application of conditional QTL mapping in molecular breeding
One of the great challenges to improve the relative proportions of oil,protein or starch in maize kernels for specific end-uses is the strong phenotypic and genetic correlations among them.For each trait,55 to 100% of unconditional QTL were co-localized with QTL for the other two traits.Thus,the real genetic mechanism of the detected QTL regulating target traits remains unclear due to pleiotropic effects or tight linkages.However,the genetic interrelationships among oil,protein and starch content at the individual QTL level can be dissected by conditional QTL mapping.The information generated in the present investigation could be helpful in marker-assisted breeding of maize varieties with desirable kernel quality traits.For example,the genetic effect of QTL associated with oil content on chromosome 1 was sharply reduced but still remained significant when oil content was conditioned on protein or starch content.This indicated that this locus mainly affected variation in oil content,but still had weak effects on both protein and starch content.Thus,when this locus is targeted for increasing oil content,the protein content will improve simultaneously along with a decrease in starch content.Similarly,protein content will improve simultaneously with no effect on starch content when a common QTL associated with oil and protein content on chromosome 6 is used to improve oil content.Therefore,different strategies for improving oil,protein and starch can be applied by focusing on different QTL clusters in specific genomic regions.
5.Conclusions
Nearly all unconditional QTL for oil,protein and starch content were not detected or showed reduced effects in conditional QTL mapping.This indicated strong genetic associations between these important components of maize kernels,consistent with the phenotypic correlations.These QTL may be involved in interactions among oil,protein and starch content,and could be valuable targets for resource markerassisted breeding of maize varieties with specific kernel quality traits.
We appreciate Dr.Jun Zhu from Zhejiang University for providing valuable suggestions in conditional mapping technology,and Dr.Robert McIntoch for the language editing.We gratefully acknowledge the editor and two anonymous reviewers for their valuable suggestions.This study was financially supported by the National High Technology Research Program of China(No.2012AA101104).
[1] J.A.Benitez,A.G.Gernat,J.G.Murillo,M.Araba,The use of high oil corn in broiler diets,Poult.Sci.78 (1999)861–865.
[2] R.J.Lambert,High-oil corn hybrids,in: A.R.Hallauer(Ed.),Specialty Corns,CRC Press Inc.,Boca Raton,Florida,2001,pp.131–154.
[3] R.J.Lambert,D.E.Alexander,I.J.Mejaya,Single kernel selection for increased grain oil in maize synthetics and high-oil hybrid development,Plant Breed.Rev.24(2004)153–175.
[4] S.P.Moose,J.W.Dudley,T.R.Rocheford,Maize selection passes the century mark: a unique resource for 21st century genomics,Trends Plant Sci.9 (2004) 358–364.
[5] T.M.Song,F.Kong,C.J.Li,G.H.Song,Eleven cycles of single kernel phenotypic recurrent selection for percent oil in Zhongzong No.2 maize synthetics,J.Genet.Breed.53(1999)31–35.
[6] T.M.Song,S.J.Chen,Long term selection for oil content in five maize populations,Maydica 49(2004) 9–14.
[7] I.L.Goldman,T.R.Rocheford,J.W.Dudley,Quantitative trait loci influencing protein and starch content in the Illinois long term selection maize strains,Theor.Appl.Genet.87(1993)217–224.
[8] I.L.Goldman,T.R.Rocheford,J.W.Dudley,Molecular markers associated with maize kernel oil content in an Illinois high protein × Illinois low protein cross,Crop.Sci.34 (1994)908–915.
[9] T.Berke,T.R.Rocheford,Quantitative trait loci for flowering,plant and ear height,and kernel traits in maize,Crop.Sci.35(1995) 1542–1549.
[10] C.C.Laurie,S.D.Chasalow,J.R.LeDeaux,R.M.McCarroll,D.Bush,B.Hauge,C.Q.Lai,D.Clark,T.R.Rocheford,J.W.Dudley,The genetic architecture of response to long-term artificial selection for oil content in the maize kernel,Genetics 168(2004) 2141–2155.
[11] D.Clark,J.W.Dudley,T.R.Rocheford,J.R.Ledeaux,Genetic analysis of corn kernel chemical composition in the random mated 10 generation of the cross of generation 70 of IHO × ILO,Crop.Sci.46(2006) 807–819.
[12] J.W.Dudley,D.Clark,T.R.Rocheford,J.R.Ledeaux,Genetic analysis of corn kernel chemical composition in the random mated 7 generation of the cross of generations 70 of IHP × ILP,Crop.Sci.47(2007) 45–57.
[13] J.J.Wassom,J.C.Wong,E.Martinez,J.J.King,J.Debaene,J.R.Hotchkiss,V.Mikkilineni,M.O.Bohn,T.R.Rocheford,QTL associated with maize kernel oil,protein,and starch content;kernel mass; and grain yield in Illinois High Oil × B73 backcross-derived lines,Crop.Sci.48(2008) 243–251.
[14] C.A.Mangolin,C.L.de Souza Jr.,A.A.F.Garcia,A.F.Garcia,S.T.Sibov,A.P.de Souza,Mapping QTL for kernel oil content in a tropical maize population,Euphytica 137 (2004)251–259.
[15] X.F.Song,T.M.Song,J.R.Dai,T.R.Rocheford,J.S.Li,QTL mapping of kernel oil concentration with high-oil maize by SSR markers,Maydica 49 (2004) 41–48.
[16] J.Zhang,X.Q.Lu,X.F.Song,J.B.Yan,T.M.Song,J.R.Dai,T.Rocheford,J.S.Li,Mapping quantitative trait loci for oil,starch,and protein contents in grain with high-oil maize by SSR markers,Euphytica 162 (2008) 335–344.
[17] X.H.Yang,Y.Q.Guo,J.B.Yan,J.Zhang,T.M.Song,T.Rocheford,J.S.Li,Major and minor QTL and epistasis contribute to fatty acid compositions and oil content in high-oil maize,Theor.Appl.Genet.120 (2010) 665–678.
[18] X.H.Yang,H.L.Ma,P.Zhang,J.B.Yan,Y.Q.Guo,T.M.Song,J.S.Li,Characterization of QTL for oil content in maize kernel,Theor.Appl.Genet.125 (2012) 1169–1179.
[19] J.Zhu,Analysis of conditional genetic effects and variance components in developmental genetics,Genetics 141 (1995)1633–1639.
[20] W.R.Atchley,J.Zhu,Developmental quantitative genetics,conditional epigenetic variability and growth in mice,Genetics 147 (1997) 765–776.
[21] C.H.Shi,J.G.Wu,L.J.Fan,J.Zhu,P.Wu,Developmental genetic analysis of brown rice weight under different environmental conditions in indica rice,Acta Bot.Sin.43(2001) 603–609.
[22] Z.H.Ye,Z.Z.Lu,J.Zhu,Genetic analysis for developmental behavior of some seed quality traits in upland cotton(Gossypum hirsutum L.),Euphytica 129 (2003) 183–191.
[23] J.Q.Yan,J.Zhu,C.X.He,M.Benmoussa,P.Wu,Molecular dissection of developmental behavior of plant height in rice(Oryza sativa L.),Genetics 150 (1998) 1257–1265.
[24] J.Q.Yan,J.Zhu,C.X.He,M.Benmoussa,P.Wu,Quantitative trait loci analysis for developmental behavior of tiller number in rice(Oryza sativa L.),Theor.Appl.Genet.97(1998)267–274.
[25] G.Q.Cao,J.Zhu,C.X.He,Y.M.Gao,J.Q.Yan,P.Wu,Impacts of epistasis and QTL × environment interaction for developmental behavior of plant height in rice (Oryza sativa L.),Theor.Appl.Genet.100 (2001) 153–160.
[26] R.L.Wu,C.X.Ma,J.Zhu,G.Casella,Mapping epigenetic quantitative trait loci (QTL)altering a developmental trajectory,Genome 45(2002) 28–33.
[27] J.B.Yan,H.Tang,Y.Q.Huang,Y.G.Shi,J.S.Li,Y.L.Zheng,Dynamic analysis of QTL for plant height at different developmental stages in maize (Zea mays L.),Chin.Sci.Bull.48(23) (2003) 2601–2607.
[28] D.S.Sun,W.B.Li,Z.C.Zhang,Q.S.Chen,H.L.Ning,L.J.Qiu,G.L.Sun,Quantitative trait loci analysis for the developmental behavior of soybean(Glycine max L.Merr.),Theor.Appl.Genet.112 (2006) 665–673.
[29] Y.L.Li,Y.B.Dong,D.Q.Cui,Y.Z.Wang,Y.Y.Liu,M.G.Wei,X.H.Li,The genetic relationship between popping expansion volume and two yield components in popcorn using unconditional and conditional QTL analysis,Euphytica 140(2007) 171–179.
[30] J.Y.Zhao,H.C.Becker,D.Q.Zhang,Y.F.Zhang,W.Ecke,Conditional QTL mapping of oil content in rapeseed with respect to protein content and traits related to plant development and grain yield,Theor.Appl.Genet.113 (2006)33–38.
[31] M.G.Murry,W.F.Thompson,Rapid isolation of high molecular weight plant DNA,Nucl.Acids Res.8(1980)4321–4325.
[32] S.B.Xu,Y.F.Tao,Z.Q.Yang,J.Y.Chu,A simple and rapid method used for silver staining and gel preservation,Heredity 24(1980) 335–336.
[33] S.E.Lincoln,M.J.Daly,E.S.Lander,Constructing Genetic Linkage Maps With MAPMAKER/EXP Version,1993.
[34] S.J.Knapp,W.W.Stroup,W.M.Ross,Exact confidence intervals for heritability on a progeny mean basis,Crop.Sci.25 (1985) 192–194.
[35] J.Zhu,Mixed model approaches for estimating genetic variance and covariance,J.Biomath.7(1992) 1–11.
[36] Z.B.Zeng,Precision mapping of quantitative trait loci,Genetics 136 (1994) 1457–1468.
[37] S.C.Wang,C.J.Basten,Z.B.Zeng,Windows QTL Cartographer 2.5 User Manual,North Carolina State University,Raleigh,NC,2012.
[38] G.A.Churchill,R.W.Doerge,Empirical threshold values for quantitative trait mapping,Genetics 138 (1994) 963–971.
[39] R.W.Doerge,G.A.Churchill,Permutation tests for multiple loci affecting a quantitative character,Genetics 142 (1996)285–294.
[40] C.H.Kao,Z.B.Zeng,R.D.Teasdale,Multiple interval mapping for quantitative trait loci,Genetics 152 (1999) 1203–1216.
- The Crop Journal的其它文章
- Identification and fine mapping of two blast resistance genes in rice cultivar 93-11
- Zea mays(L.) P1 locus for cob glume color identified as a post-domestication selection target with an effect ontemperate maize genomes
- Effects of narrow plant spacing on root distribution and physiological nitrogen use efficiency in summer maize
- Variation of high-molecular-weight glutenin subunits and glutenin macropolymer particle distribution in wheat grains produced under different water regimes
- Dissection of two quantitative trait loci for grain weight linked in repulsion on the long arm of chromosome 1 of rice(Oryza sativa L.)
- Genome-wide association of 10 horticultural traits with expressed sequence tag-derived SNP markers in a collection of lettuce lines