Analysis of the Scientific Collaboration Patterns in the Emergy Accounting Field: A Review of the Co-authorship Network Structure
Gengyuan Liu, Zhifeng Yang†, Bin Chen, Sergio Ulgiati
1State Key Joint Laboratory of Environment Simulation and Pollution Control, School of Environment, Beijing Normal University, Beijing 100875, China
2Department of Environmental Sciences, Parthenope University of Naples, Centro Direzionale – Isola C4, 80143 Naples, Italy
Analysis of the Scientific Collaboration Patterns in the Emergy Accounting Field: A Review of the Co-authorship Network Structure
Gengyuan Liu1, Zhifeng Yang1†, Bin Chen1, Sergio Ulgiati2
1State Key Joint Laboratory of Environment Simulation and Pollution Control, School of Environment, Beijing Normal University, Beijing 100875, China
2Department of Environmental Sciences, Parthenope University of Naples, Centro Direzionale – Isola C4, 80143 Naples, Italy
Submission Info
Communicated by Guoqian Chen
Using Social network analysis techniques, the authors visualize the co-authorship network and provide descriptive statistics regarding the degree to which researchers are embedded in it. The aim of this paper is to point out three issues including: (1) the use and quantification of international bibliographic databases; (2) Social Network Analysis and interpreting merits; and (3) visualization and the analysis of coauthorship networks for co-authorship data. The results showed that there was a strong linear relationship between the number of papers published and an author’s h-index. And the co-author network displayed the following features: with medium connected groups of authors; the network density is low; many sparse ties since there are still observed isolated authors or simple clusters in the network; and a medium propensity to collaborate with co-authors. Such an understanding is a necessary pre-requisite to establish an information flow and collaboration pattern among authors involved in the progress of the emergy accounting field.
© 2013 L&H Scientific Publishing, LLC. All rights reserved.
1 Introduction
The current phase of globalization represents a “double-edged sword” challenge facing researchers and policy makers. The first “edge” throws light on multi-disciplinary integration in the field of globalized problems. For instance, the rising concern about global energy crisis and its impact on the environment implies a transition from the current development paradigm to a sustainable one, which remains a significant challenge for scientists, industries and government to make reasonable energy and environmentalpolicies to save energy and reduce environmental impact as well as carbon emission during the managing and controlling process at each level of the concerned ecosystems [1]. Complex overlap of various factors creates a bumpy road to sustainability [2]. No single discipline has the capacity to cope with these kinds of coupled complex issues. Growing interests have thus led us to integrate the main disciplines as our development strategy in order to adapt our future to the irreversible changes inherent in the human civilization [3,4]. It has become evident that the complexity of such problems requires the need to enhance and deepen the understanding of the implications of different aspects of societal development. The second“edge” is that of global collaboration, and raises the question, “how can we measure and consolidate the type of collaboration through a number of activities, including implicit ones (advice, insights and data sharing)?”
Since ecologist H.T. Odum published his inf l uential book Environment, Power, and Society in the 1970s [5], where he summarized his insights from studying the energetics of ecological systems and applying them to social issues, multi-disciplinary integration and inter-disciplinarily collaboration become a wider trend of improvement of shared competences and production of new scientific knowledge. Along with these early efforts, many new inter and transdisciplinary fields, and their associated scientific communities and journals, have been created. The study of “Emergy Synthesis” is one such transdisciplinary community. Recognizing that human-dominated systems are special ecological systems, where renewable and nonrenewable resource flows support the growth of complexity under human control, H.T. Odum [6,7] pointed out the need for a more comprehensive investigation approach, where energy and matter flows are accounted for jointly with economic and information flows, from the point of view of the biosphere that supplies resources and environmental services, i.e. a “donor-side” point of view [7, 8]. In particular, Odum underlined that quality, not only quantity, of input resources should also be taken into proper account, and suggested this to be done by means of a special accounting and evaluation procedure named Emergy Synthesis [9,10]. Emergy Synthesis is a method of environmental accounting derived from complex systems theory, that uses the energy (in units of the same kind) required to produce a good or service as a nonmonetary measure of the value or worth of components or processes within ecosystems and the economy [7]. Till now, a large number of cooperation-published papers related to emergy theories were published in international scientific journals. Also, several reports dealing with emergy evaluation of different regions were presented to local governments for decision-making. Emergy theories were applied to valuation of ecosystems and eco-industrial parks, as well as to studies of benefits/cost analysis and feasibility of ecological engineering. Moreover, a series of monographs and translated books related to emergy theories were published, some of which are used as text books in different universities and institutes [11]. Meanwhile, the International Society for the Advancement of Emergy Research (ISAER) (website: http://isaer.org/) and the Center for Environmental Policy at University of Florida (established in 1971 by H.T. Odum; http://www.cep.ees.ufl.edu/) are the key institutions to support and encourage cross-disciplinary collaboration and improve the quality of emergy research throughout the world. The soon to be established ISAER Asia-Pacific Chapter is expected to generate further important steps ahead.
In order to better understand the dynamics and perspectives of such increasing scholar activity, it would be very useful to define and identify where and how it is structured [12]. One of the most tangible and formal ways of analysing collaboration patterns is to count co-authored papers (multi-authored papers) [13, 14]. Scientific collaboration is engendered by the increasing complexity of knowledge and by the demand for more specialized and inter-disciplinary skills in research [15]. As Acedo et al. [16] reported, the study of collaboration among researchers looks at the factors that justify why authors decide to collaborate in research, the type of relationship existing among the researchers and the idea that collaboration creates a network among researchers. Social Network Analysis (SNA) is a sociological approach used for analysing scientific collaboration patterns by co-authorship relationships in order to discover underlying social structure such as: central nodes that act as hubs, leaders or gatekeepers; highly connected groups; and patterns of interactions between groups [17]. It is an interdisciplinary researchparadigm that combines, among others, information systems, sociology, physics, biology, computer science, and management science [18]. The idea of studying research collaboration patterns using SNA method is not new as there is a substantial body of literature in Information Science dealing with coauthorship patterns [19], since it is relatively easy to construct large social networks with high reliability. These networks are true social networks, in the sense that it is very likely that two authors who write a paper together are acquainted with each other [20]. For instance, using bibliographic data extracted from an Endnote database, Cheong and Corbtt [21] generate and analyse a network of co-authors with the aim of developing an understanding of the research community that produces the research knowledge published by the Pacific Asia Conference on Information Systems (PACIS) from 1993 to 2008. Said et al. [22] investigated the properties of the co-authorship networks defined for the statisticians affiliated with prominent US universities. Costanza and Kubiszewski [23] developed a quantification, mapping, and visualization of the authorship structure of the transdisciplinary field of ecosystem services
In this study, we propose to use SNA to study the community of emergy researchers who publish their papers in the Scientific Information’s (ISI) Web of Science in order to reveal interesting patterns and features within this academic community. With the help of SNA, we hope to develop an understanding of the research community that produces the research knowledge published by ISI Web of Science by the analysis and the interpretation of network measures for co-authorship data.
2 Methods
2.1 Data collection
The bibliometric data used in this study is based on online data available on February 9, 2013 from the Institute for Scientific Information’s (ISI) Web of Science for the analysis of the topic area of ‘‘emergy’’. ISI provides data for a large subset of peer-reviewed journal articles. Different subscription levels are available. The one we used through Web of Knowledge includes articles published from 1900. ISI contains the majority, although not all, of peer-reviewed journal articles within the topic area [23]. However, databases most frequently used to define a co-authorship network might not be able to cover all kinds of publications (e.g. books, articles in book chapters, non-english journals, technical reports and national conference proceedings) produced by researchers as a means to communicate their research outcomes. We also did not include the conference proceedings citation index databases including both Science (CPCI-S) from 1998 to present and Social Science & Humanities (CPCI-SSH) from 1998 to present not to run the risk of including papers that have not undergone quality peer-review. The bibliographic data available from the ISI Web of Science was copied to text files and manipulated in Excel spreadsheets to sequence the fields in the appropriate order and saved as tab-delimited text files for import by the Endnote bibliographic software to create an Endnote database. An Endnote database format was selected to store the data because of the flexibility offered for processing activities as well as export capabilities to a variety of formats for further processing.
2.2 Definition of the co-authorship data matrix
ISI’s Web of Science is utilized to retrieve the names of all authors that have published at least four papers with the term “emergy” as a ‘‘topic’’ (the term appears in the title, Abstract, or Keywords of the paper). This search resulted in 74 authors, which we will call key authors. For these key authors we retrieved the number of papers published on emergy, the h-index based on these papers, the total number ofco-authors, total number of citations, the institution from which they published their latest paper, and the country of that institution (data can be found in Table 2). We then plotted those results using a Bubble Chart with Excel.
Using ISI, we were also able to retrieve, for each key author, the number of papers co-authored with all other key authors. Using the export capabilities of Endnote, the data in the Endnote database was exported as an XML file which was further processed by a custom-written Java to extract a list of coauthors. Since we are only interested in co-authored publications, all papers written by single authors were ignored. This data was put into Omnigraffle software to create a visualization of the emergy coauthor network [23].
2.3 Network data analysis and interpreting merits
In general, Social Network Analysis (SNA) is based on structural variables that are measured on pairs of relational co-authors. Co-authorship data are extracted from the Endnote database of papers and can be arranged in an affiliation matrix. Therefore, let U (m×n) be the affiliation matrix in which the generic elementai,j(i= 1, . . . ,m;j= 1, . . . ,n) is equal to 1 if thei-th co-author is present in thej-th paper. Otherwise,ai,jis equal to 0. We can derive an adjacency matrix Amof size (m×m) from the matrix product of U and its transpose U’:

In the following analyses, two different ways are employed for computingai,j. Whereas in some analysesai,jexpresses the number of papers published jointly by a pair of two authors, in other analysesai,jis assumed to be 1 if two authors published at least one paper jointly. Otherwise, the value is equal to 0. After the definition of binary and weighted adjacency matrices, SNA techniques applied to co-authorship data make it possible to describe the knowledge flow throughout a scientific community and to highlight the role and position of researchers into the network. In general, we can distinguish the main component percentage results obtained for authors in largest components versus all the authors. The analysis of a coauthorship network can focus on: (i) the network density; (ii) the average betweeness centrality of whole network; and (iii) the average network efficiency index. The description of the network characteristics is listed in Table 1.
3 Results
After the first paper using the term ‘‘emergy’’ was published in the 1970s, 486 papers on this topic have been published in journals included in the ISI database. This trend has been, up until now, on an exponential trajectory (see Figure 1). Citations to these papers have been increasing on a similar trajectory (see Figure 1) and have now reached over 6800.
This study looked at the 74 most prolific authors in this topic area—those that published 4 or more papers (see Table 2). These authors came from 35 institutions in 13 countries/territories. They published a total of 486 papers, or 61% of the total papers published on this topic. They had an average h-index of 5.34 and an average number of citations per paper of 23 (when considering only the papers they published on emergy analysis). They had an average number of co-authors per paper of 3.33.
This study looked at the 74 most prolific authors in this topic area—those that published 4 or more papers (see Table 2). These authors came from 35 institutions in 13 countries/territories. They published a total of 486 papers, or 61% of the total papers published on this topic. They had an average h-index of 5.34 and an average number of citations per paper of 23 (when considering only the papers they pub-lished on emergy analysis). They had an average number of co-authors per paper of 3.33.

Table 1 Characteristics of the co-author network

i.e.Eff(ni) standardizes an author’sscore by the size of the author’s network. Since in this study this measure would be biased for small components (Eff(ni)=1), we present three tables for the subsamples. (ni) standardizes an author’s ES(ni) score by the size of the author’s ego network.
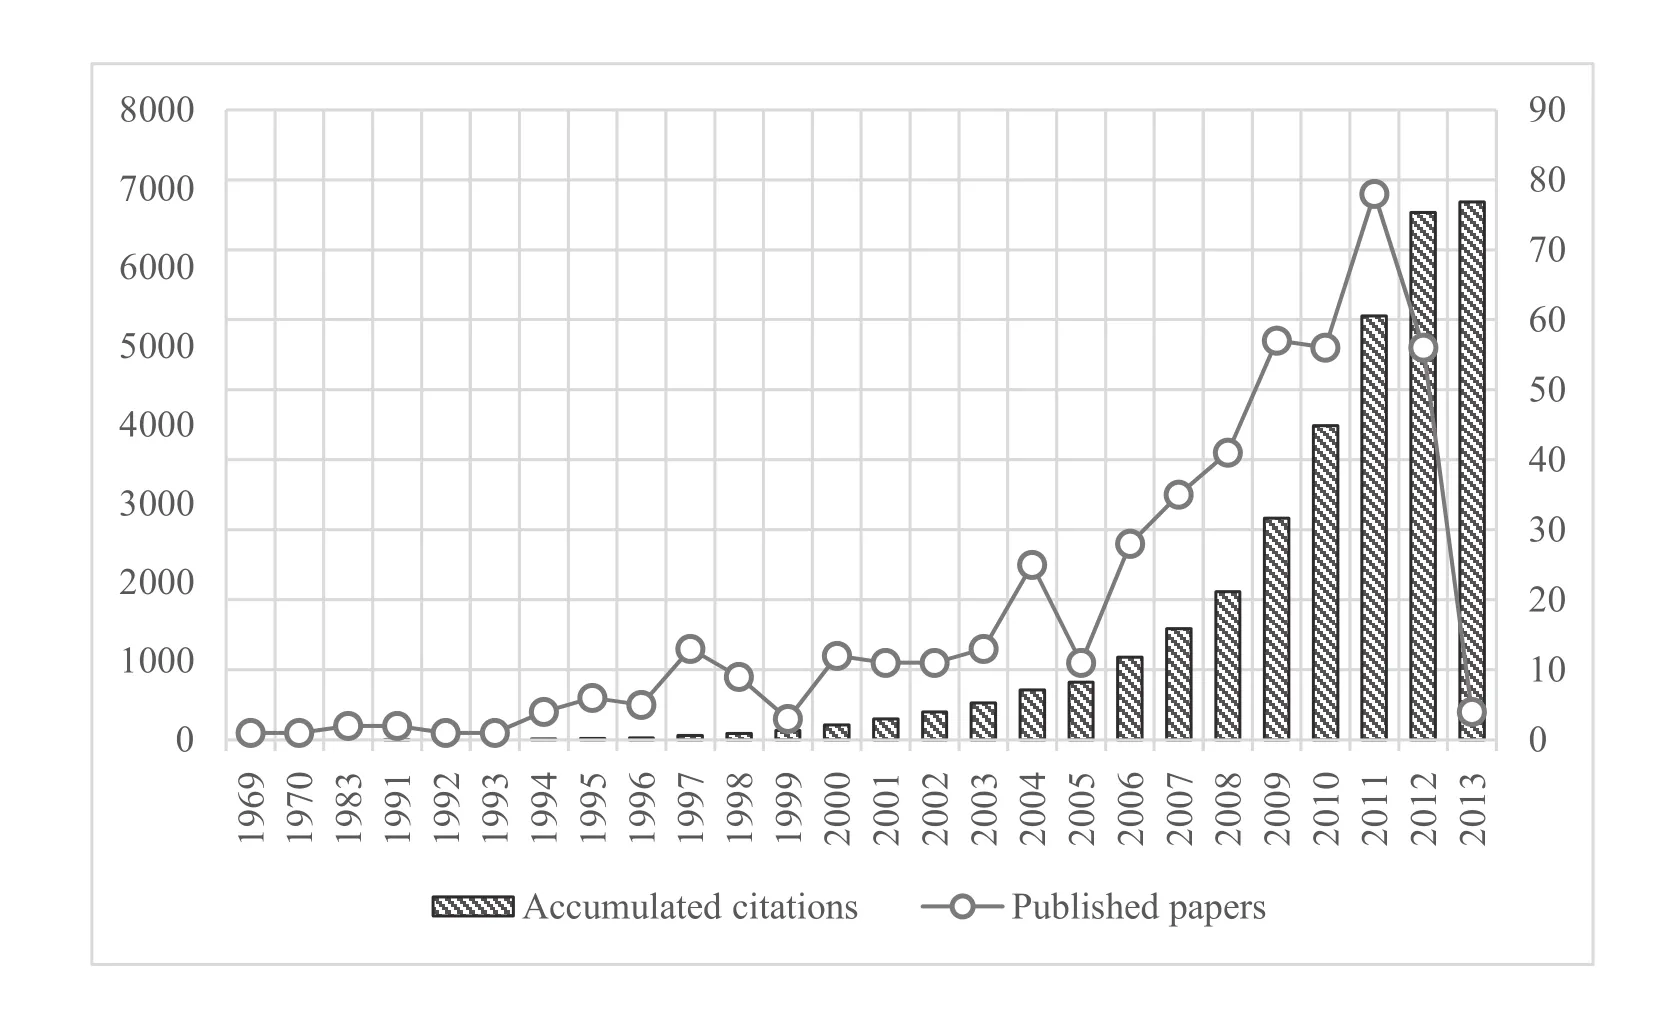
Fig. 1 Citation and publication report of “emergy” in ISI Web of Science

Table 2 Data for the 74 authors (key authors) who have published 4 or more papers on emergy according to the ISI Web of Science as of Feb, 2013
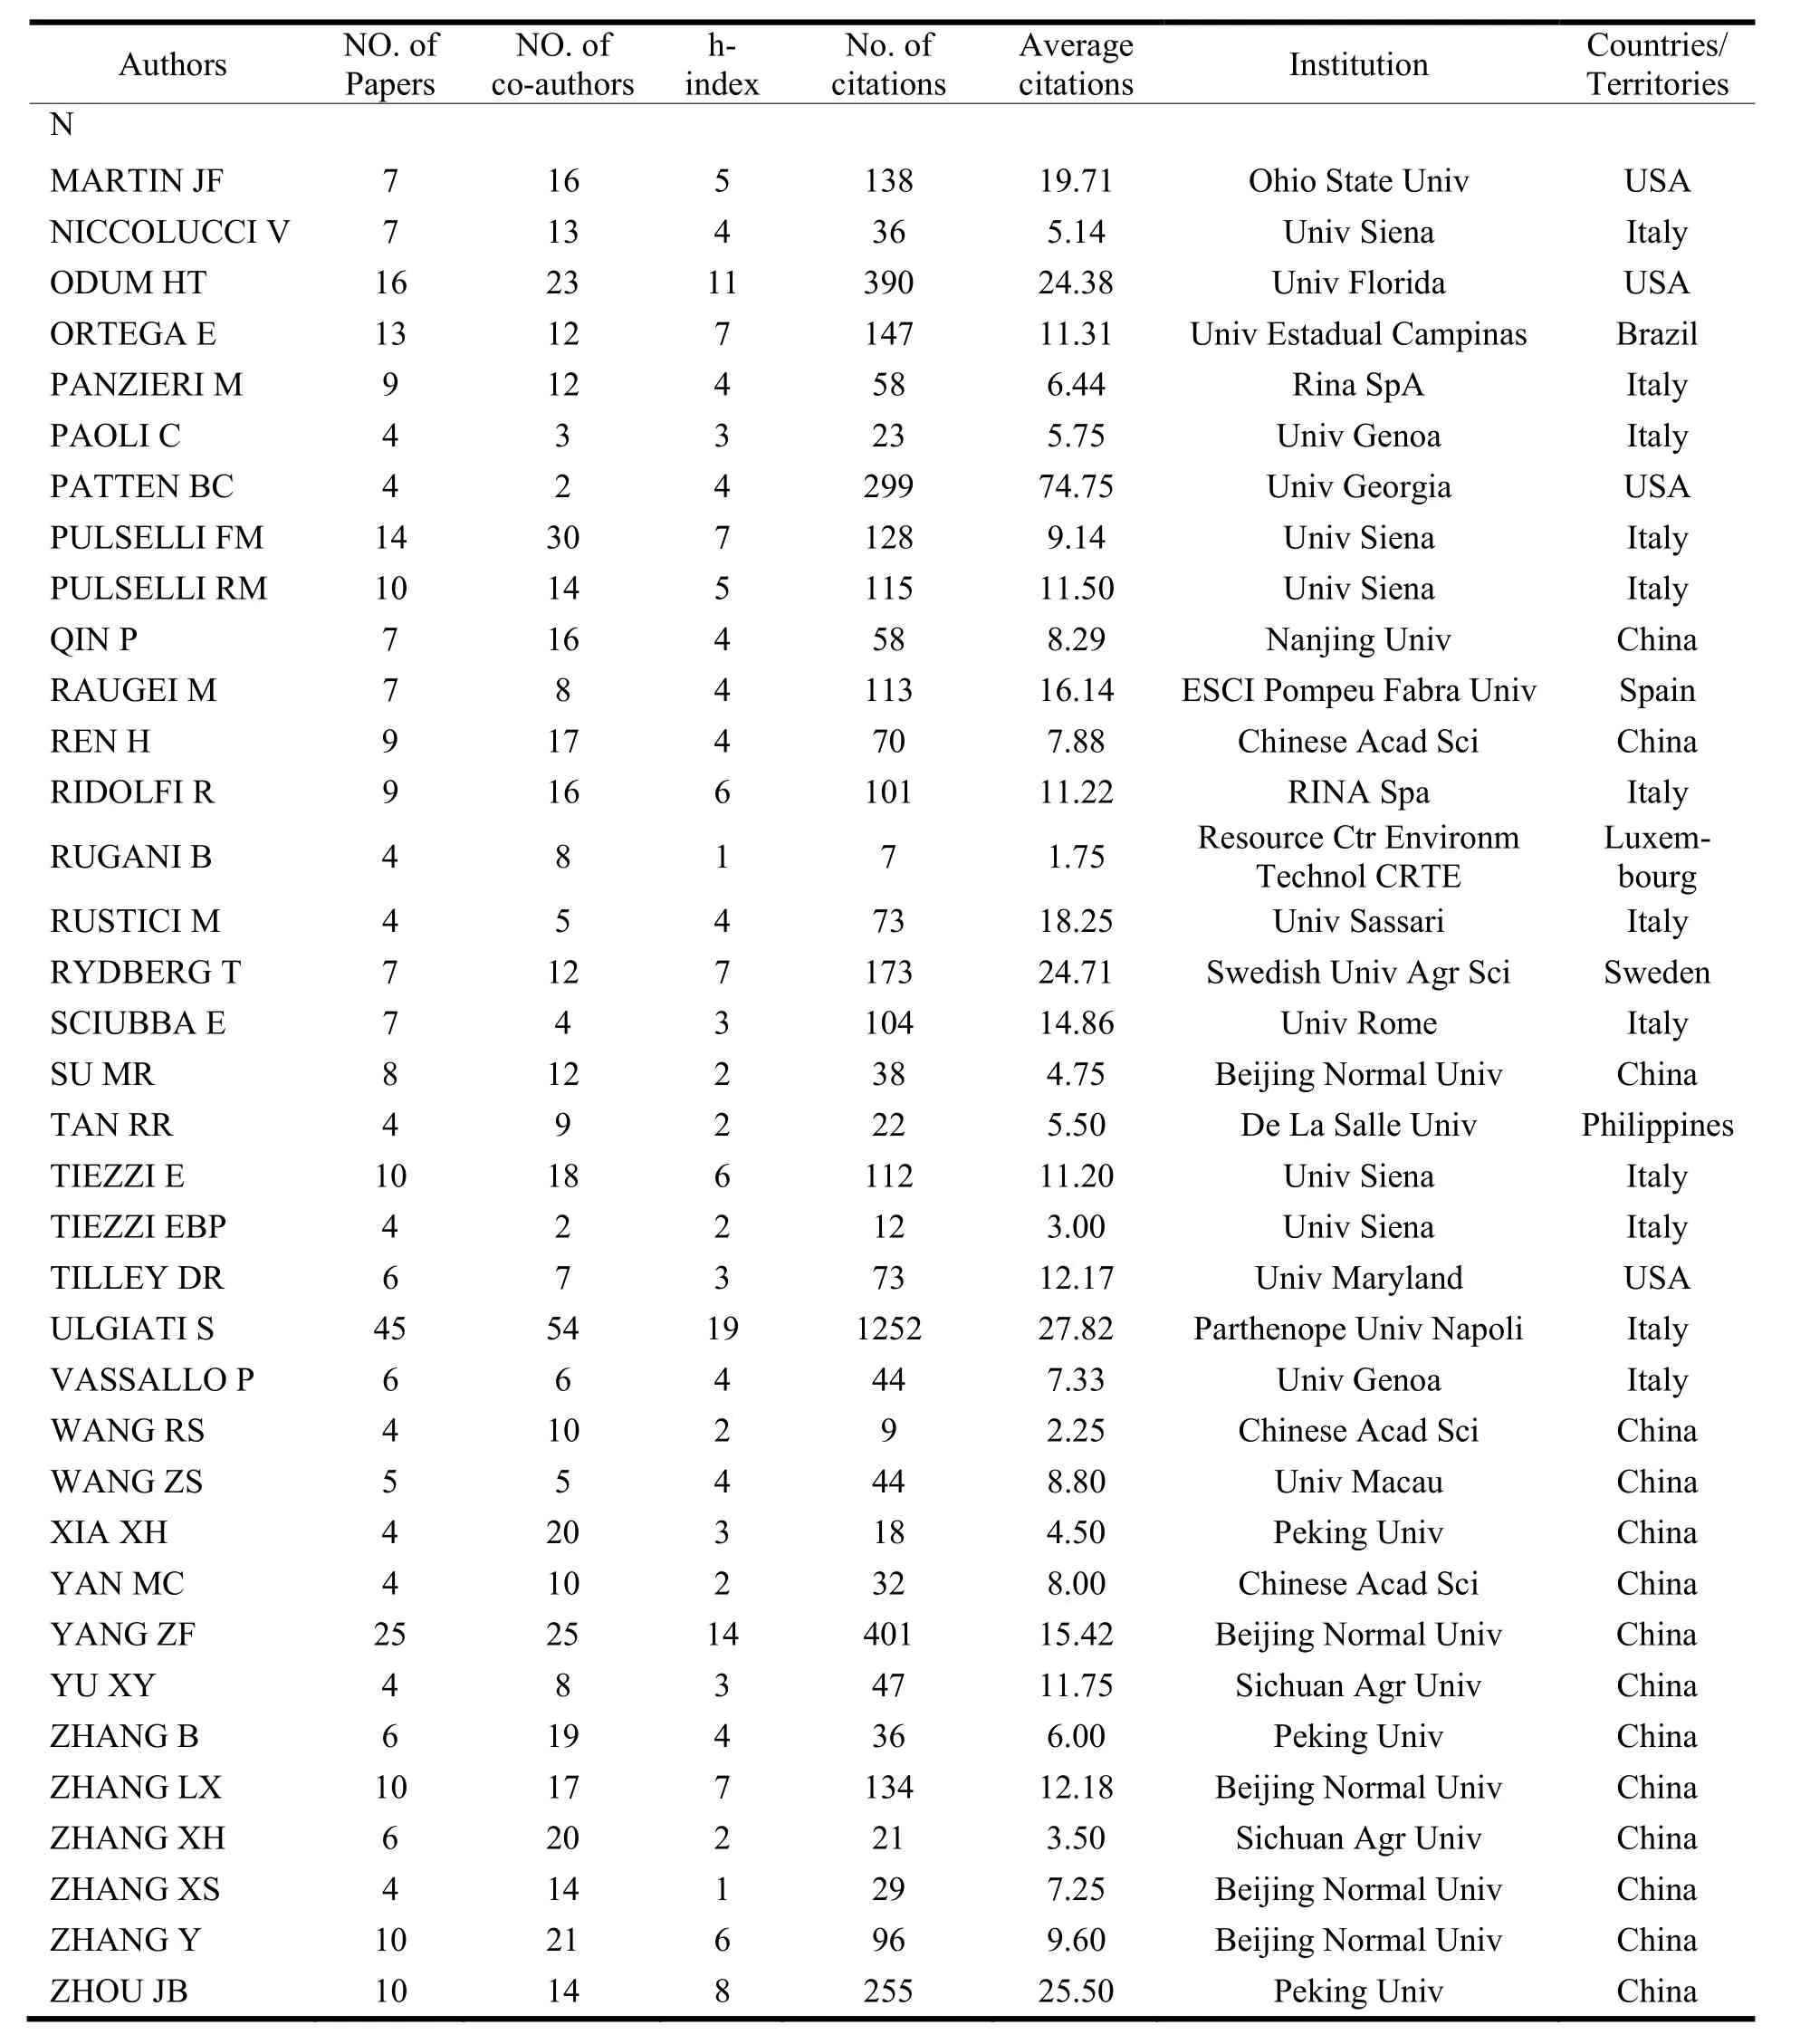
N Authors NO. of Papers NO. of co-authors h-index No. of citations Average citations Institution Countries/ Territories MARTIN JF 7 16 5 138 19.71 Ohio State Univ USA NICCOLUCCI V 7 13 4 36 5.14 Univ Siena Italy ODUM HT 16 23 11 390 24.38 Univ Florida USA ORTEGA E 13 12 7 147 11.31 Univ Estadual Campinas Brazil PANZIERI M 9 12 4 58 6.44 Rina SpA Italy PAOLI C 4 3 3 23 5.75 Univ Genoa Italy PATTEN BC 4 2 4 299 74.75 Univ Georgia USA PULSELLI FM 14 30 7 128 9.14 Univ Siena Italy PULSELLI RM 10 14 5 115 11.50 Univ Siena Italy QIN P 7 16 4 58 8.29 Nanjing Univ China RAUGEI M 7 8 4 113 16.14 ESCI Pompeu Fabra Univ Spain REN H 9 17 4 70 7.88 Chinese Acad Sci China RIDOLFI R 9 16 6 101 11.22 RINA Spa Italy RUGANI B 4 8 1 7 1.75 Resource Ctr Environm Technol CRTE Luxembourg RUSTICI M 4 5 4 73 18.25 Univ Sassari Italy RYDBERG T 7 12 7 173 24.71 Swedish Univ Agr Sci Sweden SCIUBBA E 7 4 3 104 14.86 Univ Rome Italy SU MR 8 12 2 38 4.75 Beijing Normal Univ China TAN RR 4 9 2 22 5.50 De La Salle Univ Philippines TIEZZI E 10 18 6 112 11.20 Univ Siena Italy TIEZZI EBP 4 2 2 12 3.00 Univ Siena Italy TILLEY DR 6 7 3 73 12.17 Univ Maryland USA ULGIATI S 45 54 19 1252 27.82 Parthenope Univ Napoli Italy VASSALLO P 6 6 4 44 7.33 Univ Genoa Italy WANG RS 4 10 2 9 2.25 Chinese Acad Sci China WANG ZS 5 5 4 44 8.80 Univ Macau China XIA XH 4 20 3 18 4.50 Peking Univ China YAN MC 4 10 2 32 8.00 Chinese Acad Sci China YANG ZF 25 25 14 401 15.42 Beijing Normal Univ China YU XY 4 8 3 47 11.75 Sichuan Agr Univ China ZHANG B 6 19 4 36 6.00 Peking Univ China ZHANG LX 10 17 7 134 12.18 Beijing Normal Univ China ZHANG XH 6 20 2 21 3.50 Sichuan Agr Univ China ZHANG XS 4 14 1 29 7.25 Beijing Normal Univ China ZHANG Y 10 21 6 96 9.60 Beijing Normal Univ China ZHOU JB 10 14 8 255 25.50 Peking Univ China
Using the Bubble Chart with Microsoft Excel 2013, we produced several graphs based on data and indicators in Table 2: average number of coauthors, average citations, h-index, total number of citations, total number of coauthors, and total number of papers. We found a strong linear relationship (R2= 0.88) between the number of papers published and an author’s h-index (see Figure 2). This is not surprising, since the more papers an author publishes the better their chances of getting cited and raising their h-index. We also found that there are no significant relationships between the other three pairs, including number of papers published vs. number of co-authors (R2= 0.33), number of co-authors vs. number of citations (R2=0.04), and number of co-authors vs. h-index (R2= 0.02). However, we found a significant relationship between number of papers vs. number of citations and h-index vs. number of citations. This could be the result of more papers leading to higher proportion of good quality paper, more citable papers. However, it could also be that more papers allow greater opportunities for self-citation, but the coauthors is not the key factor of self-citation. If we analyze papers published in different countries/territories individually, we can found that papers written by researchers from Italy, China and Brazil accord with above-mentioned behavior even more. It also suggests that the authors in those countries prefer to cite those papers by associates.
To illustrate the co-authorship network graphically, as in Figure 6, each author is represented by a circle using the data collected from ISI Web of Science. Within this network, each bubble represents an author, the size of the bubble represents the number of emergy papers published by that author, the color of the bubble indicates the country of the author. A line (“edge”) between two authors indicates they published a paper of emergy analysis together. The small numbers next to the names are the total published article numbers. The thickness of the lines varies with the number of publications two authors have written jointly. The thicker the line, the more papers the dyad wrote together.
Figure 6 shows the key authors arranged into clusters that minimize the distance between authors (weighted by line thickness) and the number of line crossings. We identified six relatively distinct clusters of co-author groupings, all with slightly different characteristics. For example, four clusters had a composition of key authors from only one country with 58 authors (78.38%) and 5 smaller components: two cluster of Chinese authors in the bottom right corner of the diagram, two cluster of Brazilian authors in the upper left corner, and one cluster of American and Mexican authors in the upper middle of the diagram. These clusters showed high rates of co-authorship within the group. Several authors do not neatly fit into any of the clusters and were placed between the clusters as connectors (i.e. A. Gasparatos, B.R. Bakshi, R.R. Tan). 9.5% of co-authors were not connected to any other key authors. These were arranged at the top of the figure with no lines connecting them to other authors.
The main component includes 58 authors from 10 countries/territories, eight of whom have published more than 20 papers. It also shows that currently the percentage of co-authored papers in the main component represents over 80% of the total number of papers. The main component contains several well-connected nodes, which create a large, dense cluster of highly interconnected authors. It is worth noting that although key researchers play an important role in the emergy network (contribute 40% of papers), other researchers are also important as without them is no emergy community. The main component could be divided into several sub-clusters, including the sub-cluster on the lower left is interesting in the number and degree of co-authorship of its members. Three key researchers built this sub-network, which shows that several current generation leading researchers train their doctoral students and junior collaborators to form a large pool of researchers from which new leaders may emerge for the scientific community in the future. Meanwhile, there are also a few key persons in the main component for strengthening the connection between different sub-clusters and promote the information travel quickly enough for effective collaboration.
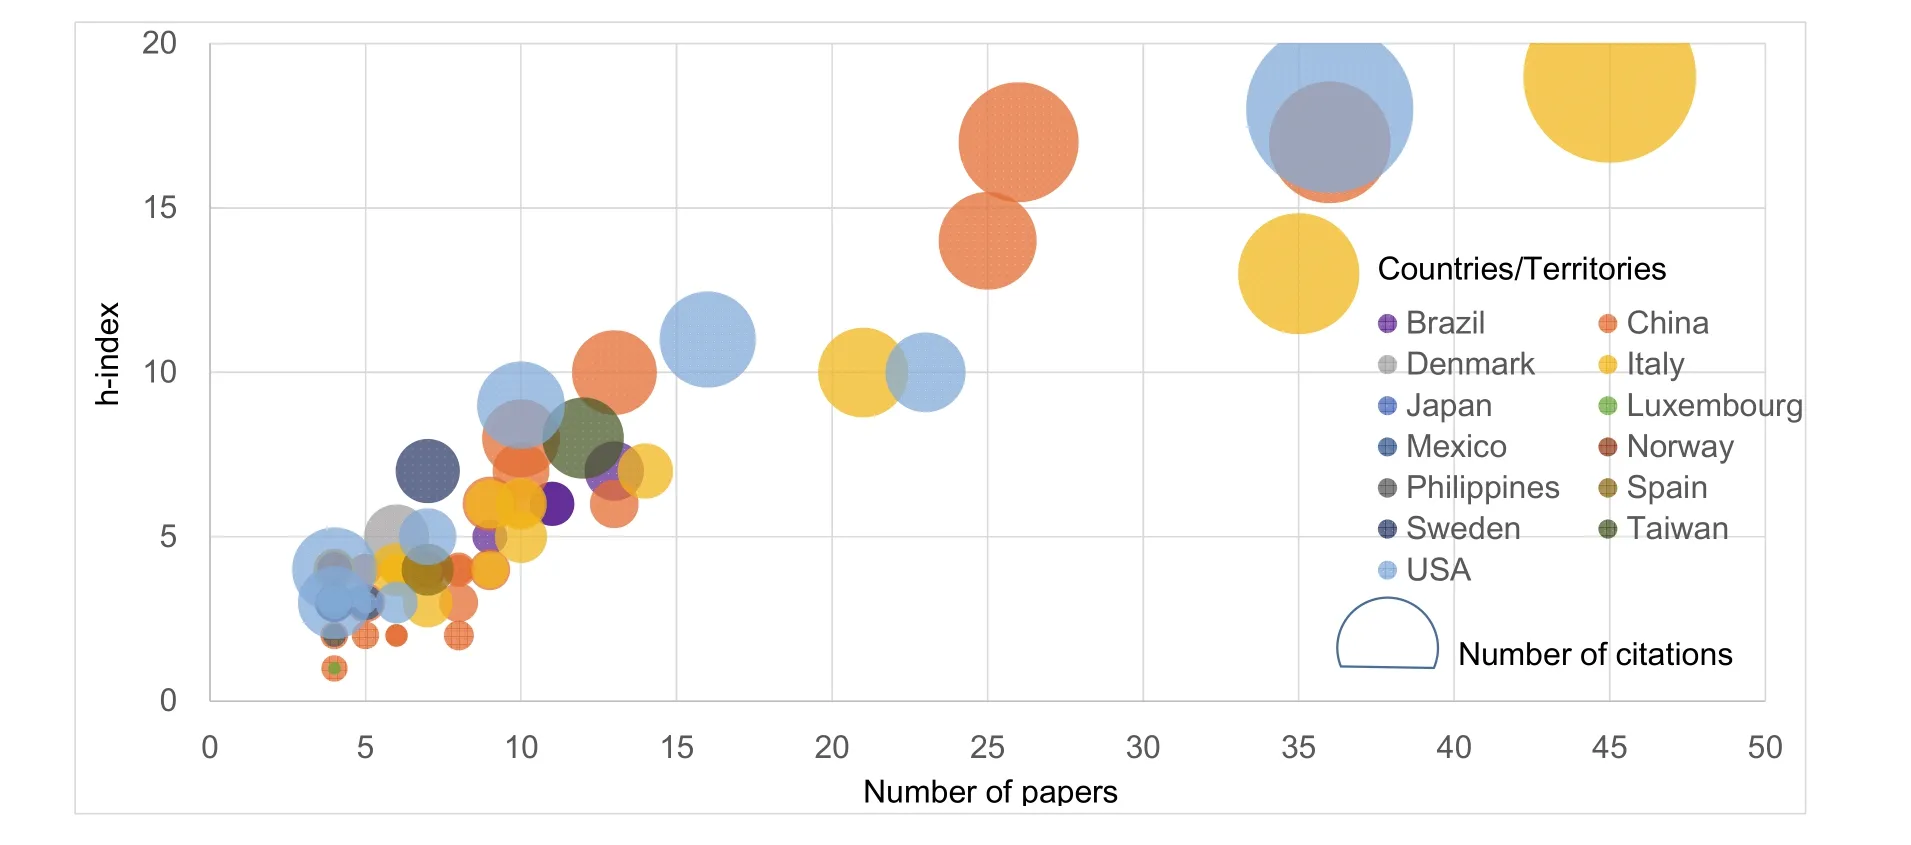
Fig. 2 Number of papers published vs. h-index for the 74 key authors (R2=0.88). Size of the circles indicates total number of citations to the authors’ papers on emergy. Color of the circles indicates the country of the author
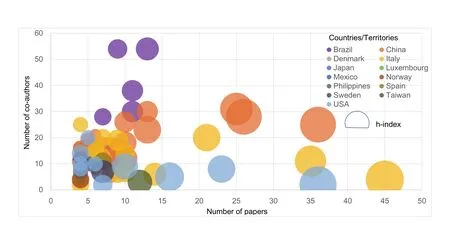
Fig. 3 Number of papers published vs. number of co-authors for the 74 key authors (R2= 0.33). Size of the circles indicates the author’s h-index for papers on emergy. Color of the circles indicates the country of the author
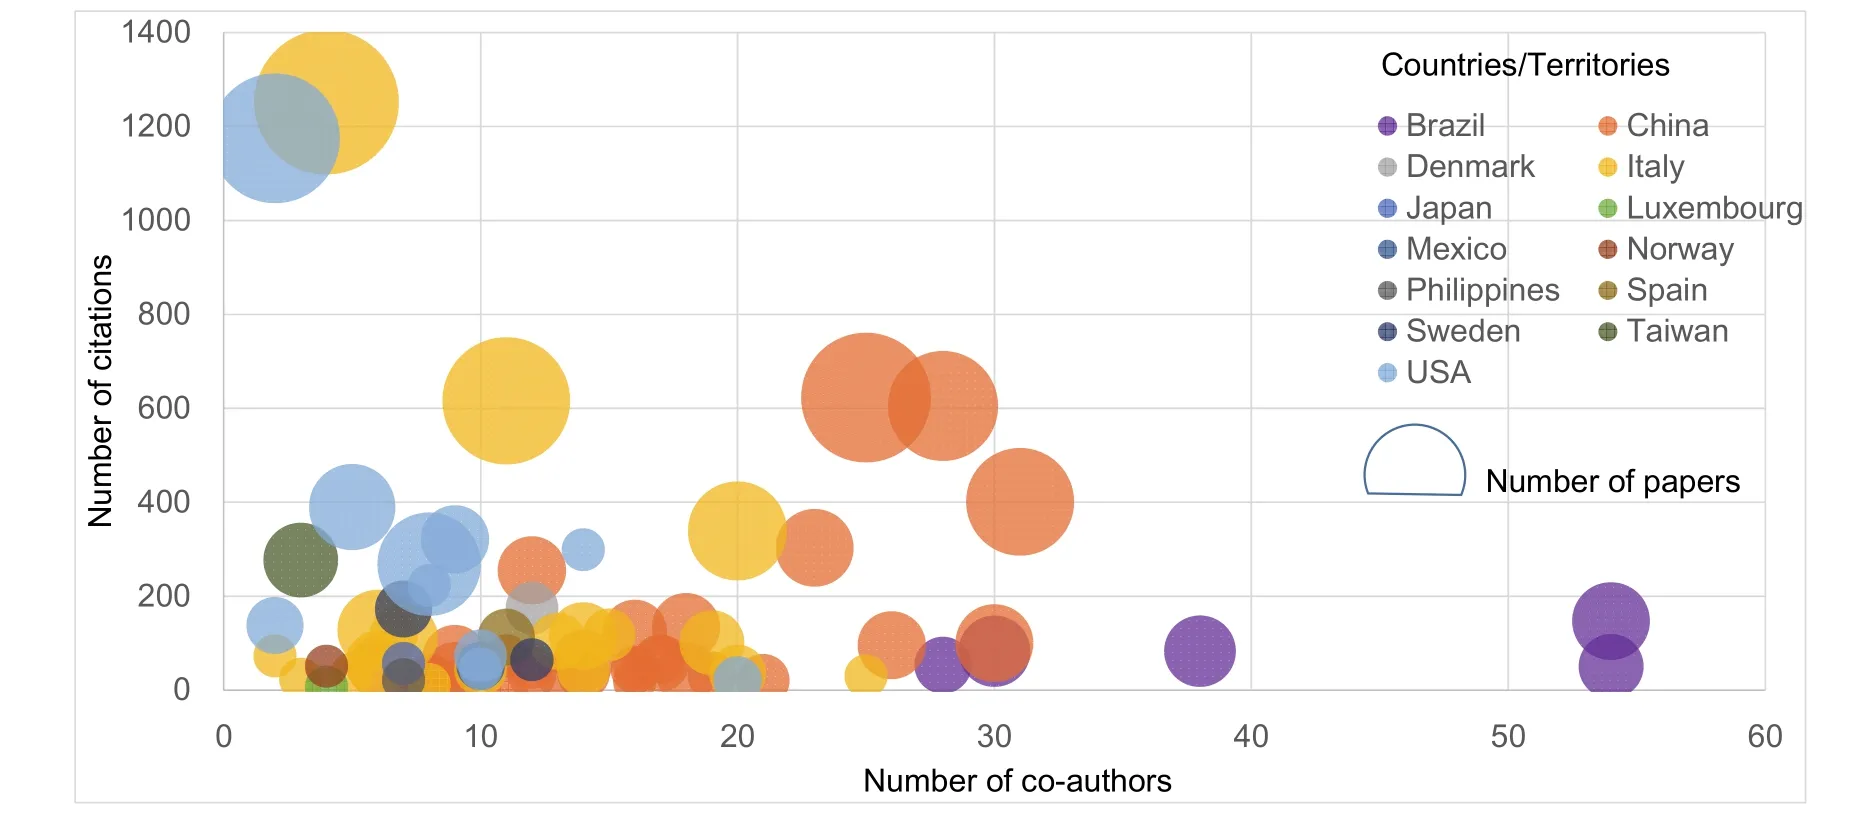
Fig. 4 Number of co-authors vs. number of citations for the 74 key authors (R2= 0.04). Size of the circles indicates total number of papers by each author on emergy. Color of the circles indicates the country of the author
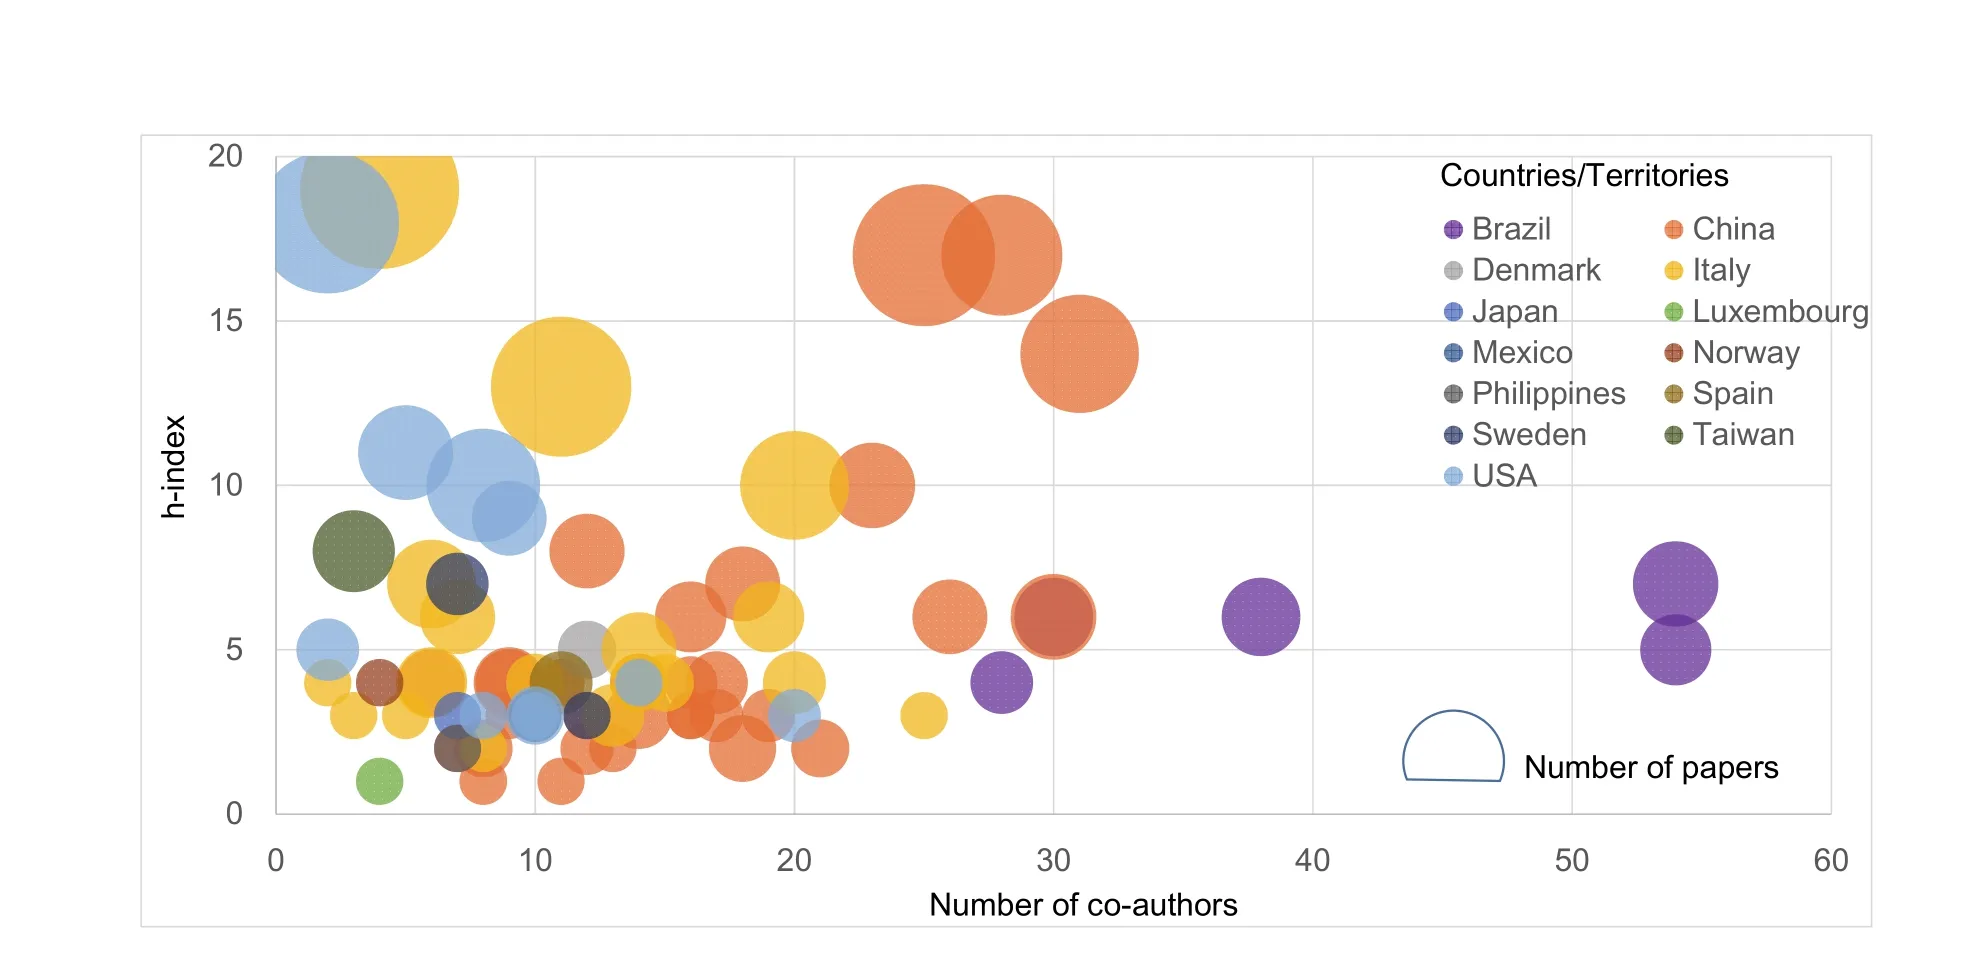
Fig. 5 Number of co-authors vs. h-index for the 74 key authors (R2= 0.02). Size of the circles indicates total number of papers by each author on emergy. Color of the circles indicates the country of the author
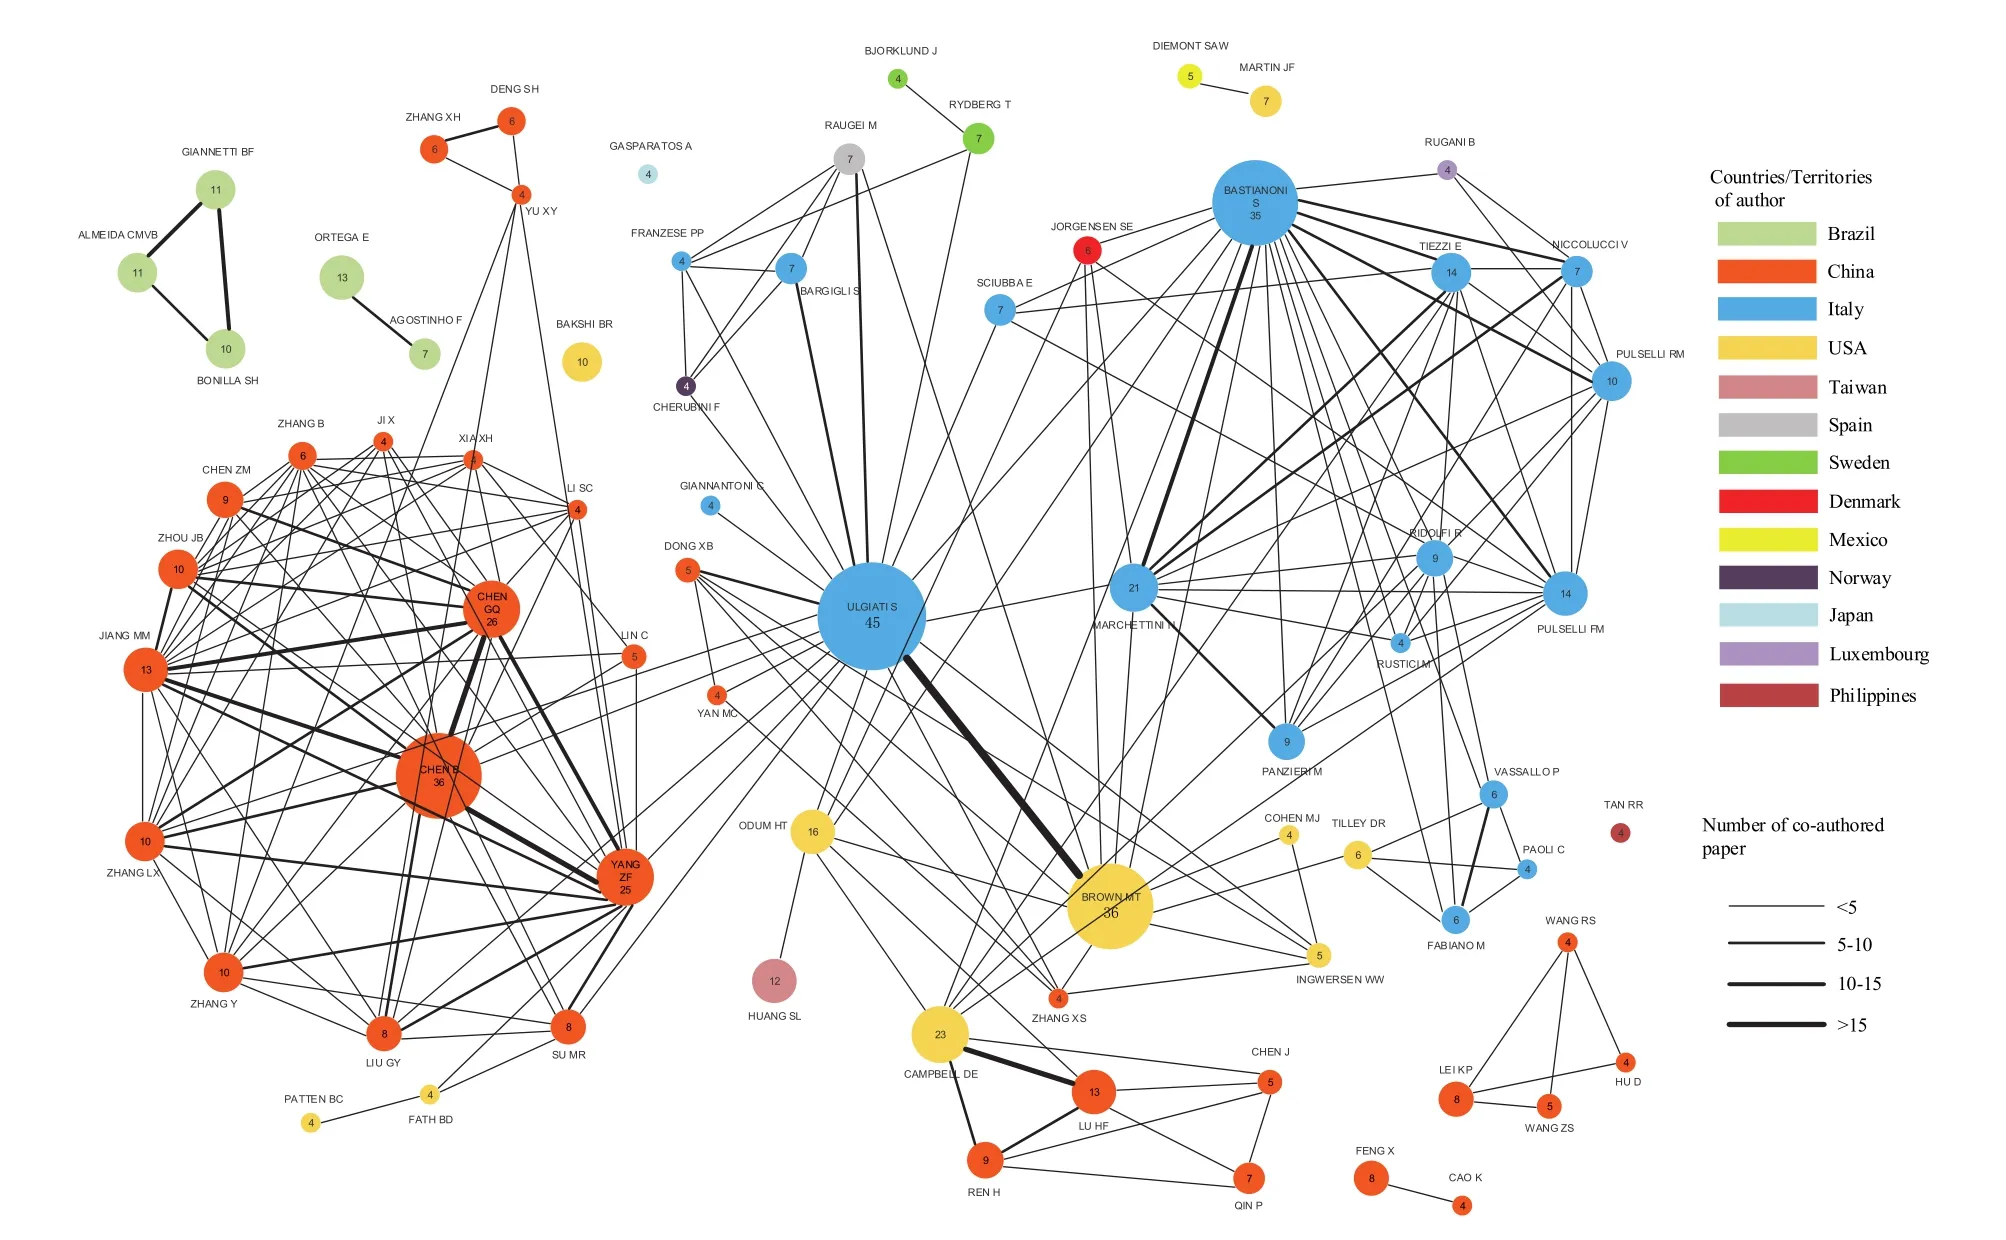
Fig. 6 Co-authorship network diagram for the 74 key authors. Size of the circles indicated total number of papers by each author on emergy (number is also given inside the circle). Color of the circles indicates the country of the author. Width of the lines connecting authors indicates the number of co-authored papers
The analysis of network merits is achieved by describing the network structural characteristics and by exploring the network topology for each discipline. Based on the network merits of the complete networks (see Table 3), average degree (=27.40) show networks with medium connected groups of authors; the network density is low for all complete networks (0.008); average betweenness centrality is characterised by many sparse ties since there are still observed isolated authors or simple clusters in the network; and finally average efficiency (=17.23%) show a medium propensity to collaborate with co-authors.
4 Conclusion
In this paper we used Social Network Analysis method to deal with some issues related to quantification, visualization and the analysis of co-authorship networks. The main issues are related to the possible use of different data sources in data collection, SNA interpreting merits and the network analysis results. Of course, as with any empirical study, this study is subject to some limitation. For instance, only 486 papers were collected in the ISI web of Science database. And admittedly, we should not ignore the important role of books, book chapters and proceedings of the ISAER. In fact, the limitations suggest some future research that examines the authors’ embeddedness in co-authorship networks and citation frequency of their articles in a variety of different disciplines.

Table 3 The co-author network merits
Acknowledgments
This work is supported by the Creative Research Groups of the National Natural Science Foundation of China (No. 51121003), National Key Technology R&D Program (No. 2012BAK30B03), Key Program of National Natural Science Foundation (Nos. 50939001, 41271543) and National Natural Science Foundation of China (Grant No. 41101564).
[1] Ulgiati, S. and Brown, M.T. (2002), Quantifying the environmental support for dilution and abatement of process emissions: The case of electricity production,Journal of Cleaner Production, 10, 335-348.
[2] Liu, G.Y., Yang, Z.F., Chen, B. and Ulgiait, S. (2011), Monitoring trends of urban development and environmental impact of Beijing, 1999-2006,Science of The Total Environment, 409(18), 3295-3308.
[3] Sachs, J. (2005),Investing in Development: A Practical Plan to Achieve the Millennium Development Goals, UN Millennium Project, London, UK: Earthscan.
[4] Harris, P.J., Harris, E., Thompson, S., Harris-Roxas, B. and Kemp, L. (2009), Human health and wellbeing in environmental impact assessment in New South Wales, Australia: auditing health impacts within environmental assessments of major projects,Environmental Impact Assessment Review, 29(5), 310-318.
[5] Odum, H.T. (1971),Environment, Power, and Society, New York: Wiley Interscience.
[6] Odum, H.T., Diamond, C. and Brown, M.T. (1987), Emergy analysis and public policy in Texas, policy research project report,Ecological Economics, 12, 54-65.
[7] Odum, H.T. (1996),Environmental accounting: Emergy and Environmental Decision Making, New York: John Wiley and Sons.
[8] Brown, M.T. and Ulgiati, S. (2004), Emergy analysis and environmental accounting,Encyclopedia of Energy, 2, 329-354.
[9] Odum, H.T. (1988), Self-organization, transformity, and information,Science, 242, 1132-1139.
[10] Campbell, D.E. (2005), Financial accounting methods to further develop and communicate environmental accounting using emergy, In:Brown, M.T., Bardi, E., Campbell, D., Comar, V., Huang, S.L., Rydberg, T., Tilley, D., Ulgiati, S. (Eds.), Emergy Synthesis. 3 - Theory and Applications of the Emergy Methodology, Center for Environmental Policy, University of Florida, USA, pp. 185-198.
[11] Dong, X.B., Ulgiati, S., Yan, M.C. and Gao, W.S. (2008), Progress, influence and perspectives of emergy theories in China, in support of environmentally sound economic development and equitable trade,Energy Policy, 36, 1019-1028.
[12] Aram, J.D. (2004), Concepts of interdisciplinarity: Configurations of knowledge and action,Human Relations, 57(4), 379-412.
[13] Glanzel, W. and Schubert, A. (2005), Analyzing scientific networks through co-authorship, In:Moed, H., Glanzel, W., Schmoch , U. (eds.) Handbook of Quantitative Science and Technology Research, pp. 257-276. Springer, Netherlands.
[14] De Stefano, D., Giordano, G. and Vitale, M.P. (2011), Issues in the analysis of co-authorship networks,Quality & Quantity, 45, 1091-1107.
[15] Gibbons, M., Limoges, C., Nowotny, H., Schwartzman, S., Scott, P. and Trow, M. (1994),The New Production of Knowledge, London: Sage.
[16] Acedo, F.J., Barroso, C., Casanueva, C. and Galán, J.L. (2006), Co-authorship in management and organizational studies: An empirical and network analysis,Journal of Management Studies, 43, 957-983.
[17] Faust, K. (2006), Comparing social networks: Size, density, and local structure,Metodološki zvezki, 3(2), 185-216.
[18] Putzke, J., Fischbach, K., Schoder, D. and Gloor, P. (2010), The evolution of interaction networks in massively multiplayer online games,Journal of the Association for Information Systems, 11(2), 69-94.
[19] Persson, O. and Beckmann, M. (1995). Locating the network of interacting authors in scientific specialties,Scientometrics, 33(3), 351-366.
[20] Newman, M.E.J. and Park, J. (2003), Why social networks are different from other types of networks,Physical Review E, 68(3), 1-8.
[21] Cheong, F. and Corbitt, B.J. (2009), A social network analysis of the co-authorship network of the pacific Asia conference on information system from 1993 to 2008, In:Proceedings of 17th European Conference on Information Systems (ECIS 2009), Verona, Italy, 8-10 June 2009.
[22] Said, Y., Wegman, E., and Sharabati, W. (2010), Author-coauthor social networks and emerging scientific subfield, In:Palumbo, F., Lauro, N.C., Greenacre, M.J. (eds.) Data Analysis and Classification, Berlin: Springer.
[23] Costanza, R. and Kubiszewski, I. (2012), The authorship structure of ‘‘ecosystem services’’ as a transdisciplinary field of scholarship,Ecosystem Services, 1, 16–25.
[24] Freeman, L. (1979), Centrality in social networks: Conceptual clarification,Social Networks, 1, 215-239.
6 January 2013
†Corresponding author.
Email address: zfyang@bnu.edu.cn
ISSN 2325-6192, eISSN 2325-6206/$- see front materials © 2013 L&H Scientific Publishing, LLC. All rights reserved.
10.5890/JEAM.2013.01.001
Accepted 18 February 2013
Available online 2 April 2013
Social network analysis
Emergy
Collaboration patterns
 Journal of Environmental Accounting and Management2013年1期
- Journal of Environmental Accounting and Management的其它文章
- Carbon Footprint and Life Cycle Assessment of Organizations
- Environmental Performance and Biophysical Constrains of Italian Agriculture Across Time and Space Scales
- Keeping the Books for the Environment and Society: The Unification of Emergy and Financial Accounting Methods
- Multi-scale Input-output Analysis for Multiple Responsibility Entities: Carbon Emission by Urban Economy in Beijing 2007
- Global Gold Mining: Is Technological Learning Overcoming the Declining in Ore grades?
- Sustainability Ethics and Metrics: Strategies for Damage Control and Prevention
