
Multi-scale Input-output Analysis for Multiple Responsibility Entities: Carbon Emission by Urban Economy in Beijing 2007
2013-06-15 17:32ShanGuoandChen
Shan Guoand G.Q. Chen,2,3†
1State Key Laboratory of Turbulence and Complex Systems, College of Engineering, Peking University, Beijing 100871, China
2School of Environment, Beijing Normal University, Beijing 100875, China
3Nonlinear Analysis and Applied Mathematics Research Group, King Abdulaziz University, Jeddah, Saudi Arabia
Multi-scale Input-output Analysis for Multiple Responsibility Entities: Carbon Emission by Urban Economy in Beijing 2007
Shan Guo1and G.Q. Chen1,2,3†
1State Key Laboratory of Turbulence and Complex Systems, College of Engineering, Peking University, Beijing 100871, China
2School of Environment, Beijing Normal University, Beijing 100875, China
3Nonlinear Analysis and Applied Mathematics Research Group, King Abdulaziz University, Jeddah, Saudi Arabia
Submission Info
Communicated by Sergio Ulgiati
Multi-scale ecological accounting
Input-output analysis
Carbon emission
Urban economy
In ecological accounting for various responsibility entities, embodied ecological endowment fluxes across the local system boundary have different mitigation implications. A framework for the multi-scale input-output analysis is presented in this article to support ecological accounting for mitigation policy making by global, domestic and local responsibility entities. A case study for carbon emissions by the urban economy in Beijing 2007 is made to compare corresponding perspectives. With intensive tertiary industry, the urban economy is revealed as a net carbon emission importer.
© 2013 L&H Scientific Publishing, LLC. All rights reserved.
1 Introduction
To cope with the universal hierarchy inherent in complex ecological systems, multi-scale analysis technique can be most effective to account and distinguish the effects from different dependent domains. For ecological accounting of economic systems, a general formulation for the multi-scale input-output analysis has been presented by Chen et al. [1] in context of the globalized world economy.
As an ecological endowment flux, carbon emission to the atmosphere has become a global concern in context of global climate change, in the background that various levels of authorities are striving to achieve mutually beneficial development [2]. Extensive measures have been introduced by different responsibility entities to promote urban carbon reduction [3].
For urban economies, many efforts have been paid to make carbon emission inventories [4-7]. Some indirect emissions associated with the cross-boundary trade have also been estimated [8-11]. Besides, conventional input-output analyses were made to calculate the embodied emissions in urban trades [12-15]. In the conventional treatment, embodied emission intensities for cross-boundary imports have oftenbeen assumed equal to those of the local products, for a possible solution. As the cross-boundary trade is essential for an urban economy, this assumption must be too strong for an acceptable accounting.
The embodied carbon emission and other ecological endowment fluxes in global [16-19], national [20-23], urban economies [13, 15, 24-26] and engineering scale systems (such as ecological engineering [27, 28], buildings [1], renewable energy projects [29-34], etc.) have been extensively accounted by Chen and his fellows. In an energy and carbon emission review for Macao in Li and Chen [26], imports were deliberately accounted by the mean embodiment intensities of the mainland China and world economies. In the case with the local municipality government as the responsibility entity, only the direct urban emissions by the Beijing economy are concerned, as accounted by Guo et al. [25] in a partial input-output analysis to estimate the embodied local emissions. From a global perspective for the carbon emissions by Beijing, a three-scale input-output analysis for the urban economy has been recently presented by Chen et al. [24] to give nine categories of embodiment fluxes. A comparison between the perspectives for the distinctive responsibility entities as the world, the nation and the municipality can help to illustrate the significance of systems ecological accounting based on the multi-scale input-output analysis.
Presented in this paper are a framework of the three-scale input-output analysis for ecological endowments and a case study to carbon emissions by the urban economy in Beijing 2007.
2 Methodology
To integrate economic flows and ecological endowment fluxes within and across a local system boundary from the perspectives of international, domestic and local responsibility entities [1], one-, two- and threescale input-output analyses are comprehensively introduced. Detailed description of the special cases of the one-scale analysis with a local responsibility entity and the three-scales analysis with a global responsibility entity have been concretely introduced in previous studies [24, 25]. Corresponding endowment data source requirement is illustrated in Table 1.

Table 1 Three-scale data sources for a local system
2.1 One-scale input-output analysis for local responsibility entity
A local responsibility entity is only responsible for the control of the direct ecological endowment flux DE from the local source, therefore the ecological fluxes embodied in domestic and foreign trades are excluded from the one-scale input-output analysis. As diagramed in Fig. 1, there are three output fluxes as endowment embodied in final consumption, EEC, endowment embodied in domestic export, EEEd, and endowment embodied in foreign export, EEEf. Detailed algorithm is available in Guo et al. [25].

Fig. 1 Diagram of one-scale endowment flux for regional responsibility entity.
As shown in Table 2, the embodied endowments originated from the single local source have three destinations: Category LL is for endowment embodied in products consumed locally, Category LD for that exported to domestic market, and Category LF for that exported to foreign market.
Promptly,
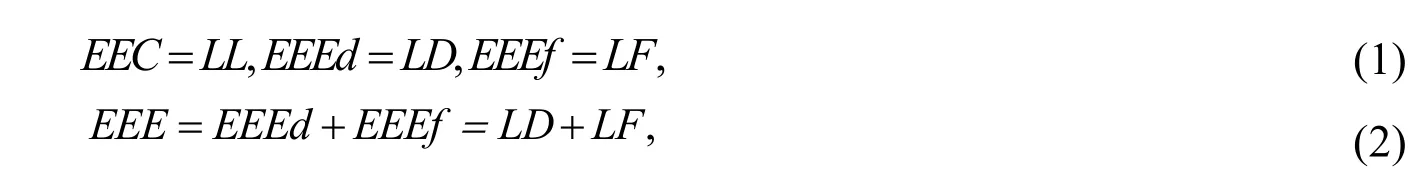
where EEE stands for the endowment embodied in export.

Table 2 Embodied endowments in one-scale analysis for local responsibility entity
2.2 Two-scale input-output analysis for national responsibility entity
From the perspective of a national responsibility entity, concerned endowment flows have two-scale sources in the local regional economy and the rest of the national economy, as shown in Fig. 2 with the appearance of endowment embodied in domestic import noted byEEId.

Fig. 2 Diagram of two-scale endowment flux for national responsibility entity.
Embodied endowments from two-scales sources of inputs can be classified into six categories as listed in Table 3. The domestic import has three destinations: Category DL represents endowment embodied in products consumed locally, Category DD stands for endowment embodied in domestic export, and Category DF is endowment embodied in foreign export.

Table 3 Embodied endowments in two-scale analysis for national responsibility entity
Promptly,

Excluding foreign import, endowment embodied in import,EEI, only includes that in domestic import asEEId, then

where EEB stands for the net embodied endowment of the trade balance.
2.3 Three-scale input-output analysis for global responsibility entity
From the perspective of a global responsibility entity, concerned endowment fluxes associated with the local economy come from three scales, i.e., international, domestic and local systems, as shown in Fig. 3 with three sources of inputs and three destinations. Concrete formulation and algorithm are available in Chen et al. [24].
Listed in Table 4 are nine categories of embodied endowment fluxes with different sources and destinations. The foreign import has three destinations: Category FL for endowment embodied in local consumption, Category FD for domestic export, and Category FF for foreign export.

Table 4 Embodied endowments in three-scale analysis for global responsibility entity

Fig. 3 Diagram of three-scale endowment flux for global responsibility entity.
With the appearance of the endowment embodied in foreign import,EEIf, there are relationships, such as

and

as summarized in Table 5.

Table 5 Relationships between ecological accounting items with three-scale inputs
3. Case study to carbon emissions by Beijing 2007
The foreign and domestic trades in the urban economy in Beijing have been given increasing attentions. The intensive trades result in massive embodied ecological endowment fluxes associated with the local urban economy, among which carbon emissions have been recently most concerned. A comparison is made between the embodied carbon emissions for various responsibility entities. Data sources and related manipulations are introduced in Chen et al. [24], with economic sector listed in Appendix.
3.1 Embodied emission intensity
Figure 4 compares the embodied CO2emission intensities. The embodied intensities increase as the scale is elevated. The average intensities for one-scale and two-scales are 0.92 t/1E+04 Yuan and 1.63 t/1E+04 Yuan, respectively. The average difference amounts to 0.71 t/1E+04 Yuan. More evidently, for the 20 sectors numbered 2, 5, 7, 9-19, 21, 23, 25, 26, 35 and 40, the differences between one-scale and two-scale intensities are higher than the average difference, due to intensive domestic import. Notably, these 20 sectors are mostly belonging to the secondary industry. The three-scale average intensity (1.76 t/1E+04 Yuan) is higher than that for two-scales by only 8%, due to less carbon emissions introduced by the foreign import in Beijing, except for Sectors 4-5, 11-22, 25-27 and 40 with slightly greater differences. The differences between three scales intensities are more remarkable for industrial sectors but those for service sectors are small.
By sector, the emission intensities at three scales vary significantly, as demonstrated in Fig. 4. However, the distributions of sectoral intensities for all the three cases are consistent. Sector 23 (Electric Power/Steam and Hot Water Production and Supply) has the largest emission intensities with values of 7.01 t/1E+04 Yuan for one-scale, 9.08 t/1E+04 Yuan for two-scales and 9.11 t/1E+04 Yuan for three-scales,followed by Sector 5 (Nonmetal and Other Minerals Mining and Dressing) with 6.63, 7.61 and 7.79 t/1E+04 Yuan, Sector 14 (Smelting and Pressing of Ferrous and Nonferrous Metals) with 4.89, 6.07 and 6.39 t/1E+04 Yuan, and Sector 13 (Nonmetal Mineral Products) with 4.53, 5.93 and 6.12 t/1E+04 Yuan.

Fig. 4 Embodied CO2emission intensities of three scales.
3.2 Emissions embodied in final consumption
Fig. 5 depicts the embodied CO2emissions in final consumption. Generally, the distribution of embodied CO2emissions by three-scales associated with final consumption is similar to that by two-scales. However, embodied emissions by one-scale show a different trend. For instance, emissions from secondary industry at one scale keep relatively constant, while those at two- and three-scales fluctuate significantly due to the effects of imports.
The choice of different scales also brings about the different sectoral embodied emissions of final consumption. At three-scales, the top CO2emitter is Sector 26 (Construction Industry) with an amount of 5.57E+07 t, followed by Sector 40 (Health, Social Security and Social Welfare) with 9.55E+06 t and Sector 33 (Real Estate) with 7.80E+06 t. The three largest emitters at two-scales are the same as those at three-scales, but small difference in the total emissions. The largest three embodied emissions at twoscales are 5.52E+07 t (Sector 26, Construction Industry), 8.54E+06 t (Sector 40, Health, Social Security and Social Welfare) and 7.51E+06 t (Sector 33, Real Estate), respectively. However for one-scale, the three largest contributors to embodied emissions in final consumption are Sector 26 (Construction Industry, 1.81E+07 t), Sector 33 (Real Estate, 5.26E+06 t) and Sector 42 (Public Management and Social Organization, 3.69E+06 t).
EEC can be divided into five categories based on the input-output table, namely, urban household consumption, rural household consumption, government consumption, fixed capital formation and growing inventories. As listed in Table 6, the total embodied emissions in final consumption amount to 5.56E+07 t (one-scale), 1.41E+08 t (two-scales) and 1.53E+08 t (three-scales), respectively. The difference between EEC under one-scale and two-scales is 8.51E+07 t, due to a massive domestic imported input flux, while the three- and two-scale analyses show difference in EEC only by 1.26E+07 t, due to a moderate foreignimported input flux.

Table 6 Embodied CO2emissions by final consumption (unit:t)

Fig. 5 Sectoral embodied emissions in final consumption.
Regarding the structure of total embodied CO2emissions by final consumption, fixed capital formation is the largest contributor to the total embodied emissions by final consumption, with a percentage of 44.59%, followed by urban household consumption of 27.01% and government consumption of 20.82%. Unlike the above mentioned categories, inventory increase and rural household consumption only take very small fractions of the total, together with a percentage of 7.58%.
3.3 Emissions embodied in trade
The details of EEI, EEE and EEB are summarized in Table 7. As to the accounting with two-scales including domestic import, EEI is estimated as 1.75E+08 t. With the consideration of both domestic and foreign trades in the three-scale input-output analysis, EEI amounts to 2.08E+08 t. The values of EEE at one-scale, two-scales and three-scales are accounted as 4.76E+07 t, 1.38E+08 t and 1.58E+08 t, respectively. And with the combination of EEI and EEE, the values of EEB for the urban, national and global responsibility entities are 4.76E+07 t, -3.74E+07 t and -5.04E+07 t, respectively. The negative EEB values from the national and international perspectives reveal the urban economy as a net importer of carbon emissions, due to its intensive tertiary industry.

Table 7 Embodied CO2emissions in domestic and foreign trades (unit: t)
4 Concluding remarks
To mitigate the over exploitation of environmental resources as ecological endowments, there are various responsibility entities, such as a government, a company or a non-profit organization, responsible for the mitigation over their distinctive influential domains at different scales. Multi-scale analysis for complex ecological systems is essential for ecological accounting for multiple responsibility entities.
Comprehensively presented in this paper is the framework for the multi-scale input-output analysis of a local economy for global, domestic and local responsibility entities. In the case of the one-scale analysis, the local entity only concerns the local endowment sources, without responsibility for the endowments embodied in domestic and international imports as induced exploitation outside the local system. In the two-scale case with the domestic entity responsible for the national system, both the endowment embodied in domestic trade and the local endowments are equally accounted. In the three-scale case with a global entity responsible for the global system, the foreign import is included besides both the domestic import and local exploitation.
A case study is performed for carbon emission by the urban economy in Beijing 2007. The increase in the embodied intensities with the elevation of the scale is concretely illustrated. While the average intensity for the two-scales analysis is estimated almost two-folds that for one-scale, that for three scales is only slightly higher than that for two-scales. Fixed capital formation is turned out to be the largest contributor to the total embodied emissions by final consumption, followed by urban household consumption and government consumption. The urban economy is revealed as a net importer of carbon emissions, due to intensive tertiary industry.
Acknowledgment
This work is supported by the Natural Science Foundation of China (Grant No. 11272012) and the Innovation Project Foundation of Beijing Academy of Science and Technology (Grant No. PXM2011_178215_000003).
Appendix

Sectors for Beijing’s economic input-output table 2007 [24].

[1] Chen, G.Q., Chen, H., Chen, Z.M., Zhang, B., Shao, L., Guo, S., Zhou, S.Y. and Jiang M.M. (2010), Low-carbon building assessment and multi-scale input-output analysis,Communications in Nonlinear Science and Numerical Simulation, 16(1), 583-595.
[2] Dhakal, S. (2010), GHG emissions from urbanization and opportunities for urban carbon mitigation,Current Opinion in Environmental Sustainability, 2(4), 277-283.
[3] Guo, J.P. (2011), On China's energy saving and emission reduction and international law analysis about global climate change,Energy Procedia, 5, 2568-2575.
[4] Niels, B.S. (2010), Delving into the carbon footprints of Singapore-comparing direct and indirect greenhouse gas emissions of a small and open economic system,Energy Policy, 38(9), 4848-4855.
[5] Harris, P.G., Chow, A.S.Y., and Symons, J. (2012), Greenhouse gas emissions from cities and regions: International implications revealed by Hong Kong,Energy Policy, 44, 416-424.
[6] Xi, F., Geng, Y., Chen, X., Zhang, Y., Wang, X., Xue, B., Dong, H., Liu, Z., Ren, W., Fujita, T., and Zhu, Q. (2011), Contributing to local policy making on GHG emission reduction through inventorying and attribution: A case study of Shenyang, China,Energy Policy, 39(10), 5999-6010.
[7] Chen, F. and Zhu, D. (2013), Theoretical research on low-carbon city and empirical study of Shanghai,Habitat International, 37, 33-42.
[8] D’ Avignon, A., Carloni, F.A., Rovere, E.L.L., and Dubeux, C.B.S. (2010), Emission inventory: An urban public policy instrument and benchmark,Energy Policy, 38(9), 4838-4847.
[9] Dhakal, S. (2009), Urban energy use and carbon emissions from cities in China and policy implications,Energy Policy, 37(11), 4208-4219.
[10] Glaeser, E.L. and Kahn, M.E. (2010), The greenness of cities: Carbon dioxide emissions and urban development,Journal of Urban Economics, 67(3), 404-418.
[11] Kennedy, C., Steinberger, J., Gasson, B., Hansen, Y., Hillman, T., Havránek, M., Pataki, D., Phdungsilp, A., Ramaswami, A., and Mendez, G.V. (2010), Methodology for inventorying greenhouse gas emissions from global cities,Energy Policy, 38(9), 4828-4837.
[12] Cellura, M., Longo, S., and Mistretta, M. (2011), The energy and environmental impacts of Italian households consumptions: An input–output approach,Renewable and Sustainable Energy Reviews, 15(8), 3897-3908.
[13] Guo, S., Shao, L., Chen, H., Li, Z., Liu, J.B., Xu, F.X., Li, J.S., Han, M.Y., Meng, J., Chen, Z.M., and Li, S.C. (2007), Inventory and input–output analysis of CO2emissions by fossil fuel consumption in Beijing 2007,Ecological Informatics, 12, 93-100.
[14] Lenzen, M., Murray, S.A., Korte, B., and Dey, C.J. (2003), Environmental impact assessment including indirect effects—a case study using input–output analysis,Environmental Impact Assessment Review, 23(3), 263-282.
[15] Zhou, S.Y., Chen, H., and Li, S.C. (2002), Resources use and greenhouse gas emissions in urban economy: Ecological input-output modeling for Beijing 2002,Communications in Nonlinear Science and Numerical Simulation, 15(10), 3201-3231.
[16] Chen, G.Q. and Chen, Z.M. (2011), Greenhouse gas emissions and natural resources use by the world economy: Ecological input-output modeling,Ecological Modelling, 222(14), 2362-2376.
[17] Chen, Z.M. and Chen, G.Q. (2013), Demand-driven energy requirement of world economy 2007: A multi-region inputoutput network simulation.Communications in Nonlinear Science and Numerical Simulation, 18(7), 1757-1774.
[18] Chen, Z.M. and Chen, G.Q. (2011), Embodied carbon dioxide emission at supra-national scale: A coalition analysis for G7, BRIC, and the rest of the world,Energy Policy, 39(5), 2899-2909.
[19] Chen, Z.M. and Chen, G.Q. (2011), An overview of energy consumption of the globalized world economy,Energy Policy, 39(10), 5920-5928.
[20] Chen, G.Q. and Chen, Z.M. (2010), Carbon emissions and resources use by Chinese economy 2007: A 135-sector inventory and input-output embodiment,Communications in Nonlinear Science and Numerical Simulation, 15(11), 3647-3732.
[21] Chen, G.Q. and Zhang, B. (2010), Greenhouse gas emissions in China 2007: Inventory and input-output analysis,Energy Policy, 38(10), 6180-6193.
[22] Chen, Z.M., Chen, G.Q., Zhou, J.B., Jiang, M.M., and Chen, B. (2010), Ecological input-output modeling for embodied resources and emissions in Chinese economy 2005,Communications in Nonlinear Science and Numerical Simulation, 15(7), 1942-1965.
[23] Zhang, B. and Chen, G.Q. (2010), Methane emissions by Chinese economy: Inventory and embodiment analysis,Energy Policy, 38 (8), 4304-4316.
[24] Chen, G.Q., Guo, S., Shao, L., Li, J.S. and Chen, Z.M. (2012), Three-scale input-output modeling for urban economy: Carbon emission by Beijing 2007,Communications in Nonlinear Science and Numerical Simulation, doi.org/10.1016/j.cnsns.2012.12.029.
[25] Guo, S., Liu, J.B., Shao, L., Li, J.S., and An, Y.R. (2012), Energy-dominated local carbon emissions in Beijing 2007: Inventory and input-output analysis,Scientific World Journal,doi. 10.1100/2012/923183.
[26] Li, J.S. and Chen, G.Q. (2013), Energy and greenhouse gas emissions review for Macao,Renewable & Sustainable Energy Reviews, 22, 23-32.
[27] Chen, G.Q., Shao, L., Chen, Z.M., Li, Z., Zhang, B., Chen, H., and Wu, Z. (2011), Low-carbon assessment for ecological wastewater treatment by a constructed wetland in Beijing,Ecological Engineering, 37(4), 622-628.
[28] Shao, L., Wu, Z., Zeng, L., Chen, Z.M., Zhou, Y. and Chen, G.Q. (2012), Embodied energy assessment for ecological wastewater treatment by a constructed wetland,Ecological Modelling, doi.org/10.1016/j.ecolmodel.2012.09.004.
[29] Yang, Q., Chen, G.Q., Zhao, Y.H, Chen, B., Li, Z., and Wang, Z.F. (2011), Energy cost and greenhouse gas emissions of a Chinese solar tower power plant,Procedia Environmental Sciences, 5, 77-80.
[30] Chen, H. and Chen, G.Q. (2011), Energy cost of rapeseed-based biodiesel as alternative energy in China,Renewable Energy, 36(5), 1374-1378.
[31] Yang, Q. and Chen, G.Q. (2012), Greenhouse gas emissions of corn–ethanol production in China,Ecological Modelling, doi.org/10.1016/j.ecolmodel.2012.07.011.
[32] Chen, G.Q., Yang, Q., Zhao, Y.H., and Wang, Z.F. (2011), Nonrenewable energy cost and greenhouse gas emissions of a 1.5 MW solar power tower plant in China,Renewable Sustainable Energy Review, 15(4), 1961-1967.
[33] Yang, Q. and Chen, G.Q. (2012), Nonrenewable energy cost of corn-ethanol in China,Energy Policy, 41, 340-347.
[34] Chen, G.Q., Yang, Q. and Zhao, Y.H. (2011), Renewability of wind power in China: A case study of nonrenewable energy cost and greenhouse gas emission by a plant in Guangxi,Renewable Sustainable Energy Review, 15(5), 2322-2329.
12 January 2013
†Corresponding author.
Email address: gqchen@pku.edu.cn
ISSN 2325-6192, eISSN 2325-6206/$- see front materials © 2013 L&H Scientific Publishing, LLC. All rights reserved.
10.5890/JEAM.2013.01.004
Accepted 25 February 2013
Available online 2 April 2013
 Journal of Environmental Accounting and Management2013年1期
- Journal of Environmental Accounting and Management的其它文章
- Carbon Footprint and Life Cycle Assessment of Organizations
- Environmental Performance and Biophysical Constrains of Italian Agriculture Across Time and Space Scales
- Analysis of the Scientific Collaboration Patterns in the Emergy Accounting Field: A Review of the Co-authorship Network Structure
- Keeping the Books for the Environment and Society: The Unification of Emergy and Financial Accounting Methods
- Global Gold Mining: Is Technological Learning Overcoming the Declining in Ore grades?
- Sustainability Ethics and Metrics: Strategies for Damage Control and Prevention