
The application of numerical simulation of delta wing with blunt leading edge using RANS/LES hybrid method
2014-04-06 12:48BAIJunqiangWANGBoSUNZhiwei
空气动力学学报 2014年6期
BAI Jun-qiang,WANG Bo,SUN Zhi-wei
0 Foreword
In order to obtain good maneuverability and agility,modern aircraft always flies at high angle of attack,sometimes even larger than the stall angle.The aerodynamic efficiency of conventional aircraft is low at large angle of attack,and it is unable to provide the necessary lift and moment.In this case,the movement and flight control of aircraft become very difficult and it often leads to accident directly.In order to improve the maneuverability of aircraft at high angle of attack,separated flow at high angle of attack is researched in recent years,and its formation mechanism is also conducted in-depth exploration.
For the calculation of separated flow,Reynolds averaged method often can not describe the details of the development and the change of different scale's eddy[1-2].Large Eddy Simulation (LES)and Direct Numerical Simulation(DNS)in complex geometries and high Reynolds number(more than 1.0×10⁵)is difficult to bring into effect in engineering because of the huge problem in the computation with the level of the current computer.In Large Eddy Simulation[3]a large part of computation is used to simulate the small-scale,high-frequency motion in boundary layer.If this part can be eliminated from computation and only the movement of largescale eddy that mainly influence on the flow is computed,it will greatly reduce the computation.DES,DDES are produced as a mixture of Reynolds averaged and large eddy simulation method against this background.
DES[4]uses Reynolds averaged N-S method in the boundary layer near the wall,and turbulence model is used to simulate the small-scale fluctuation motion in the flow;The turbulence scale parameter of the turbulence model dissipation term will be modified in the flow separation zone[5].If the grid scale can meet the requirements,it plays the role of subgrid scale stress model[6]in Smagorinski Large Eddy Simulation.DES method does not take a large number of small-scale fluctuation motion into account in the turbulent boundary layer,so the number of grid required is greatly reduced.The method not only takes advantage of the small computation amount using Reynolds averaged method in the boundary layer,but also well simulate large scale detached eddy in the flow separation.
DDES method[7-8]solves the problem on mesh dependence of DES.In the mesh refinement process Modeled-Stress Depletion phenomenon and the grid induced separation problems may occur.Spalart,Strelets and others improved the original DES method:the Delay Control of the function of boundary layer is introduced to determine the parameters.The method ensures that the RANS method in boundary layer is used in calculation regardless of Large Eddy Simulation.
Nowadays the simulation using DES and DDES around delta wing configurations with sharp leading edges has been well known,many experimental and numerical investigations[9-13]have been published to simulating the flow using high fidelity numerical methods.However,the flow around delta wing configurations with blunt leading edge is still not entirely understood.Therefore,several experimental data in the Second International Vortex Flow Experiment were provided and generated within the NATO RTO/AVT-113task group for a 65°swept delta wing with sharp and various blunt/rounded leading edges[14].
The paper focuses on the flow around the delta wing with blunt leading edge using RANS and hybrid models such as DES and DDES methods.The overall goal is to simulate the flow more fully a-round these non-sharp leading edge delta wings and gain more about the mechanism.
1 Governing equations
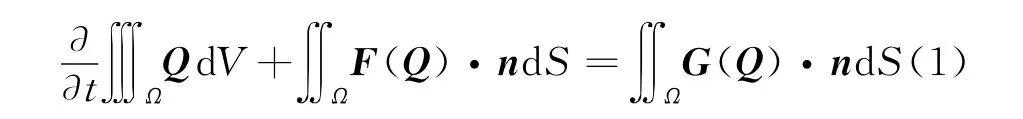
In the paper,the unsteady three dimensional compressible Navier Stokes equation in integral form under inertial Cartesian coordinates is adopted.The equation can be written as:
In order to close RANS equations,based on Boussinesq assumption,the Reynolds stress can be defined as:
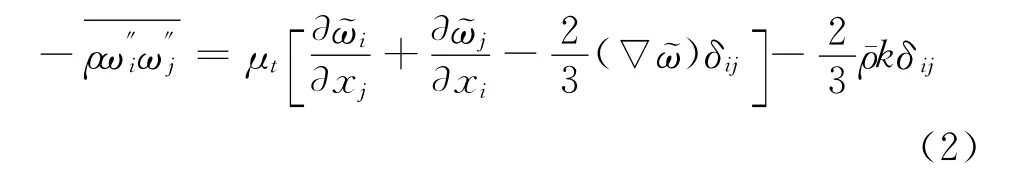
Here,ωiis the relative velocity in the xidirection.
Finite volume method,Roe scheme in spatial discretization and pseudo-time method are used in the unsteady numerical simulation.
2 Turbulence model and boundary condition
S-A turbulence model is used in the paper.It can well simulate most of attached flow and the free movement of thin shear flow.Besides,it also has good robustness and numerical convergence.The Riemann invariants in normal direction is used in Far-field boundary condition in order to achieve nonreflective boundary condition;and the no-slip condition is adopted in wall boundary condition,that is,u=v=w=0The normal pressure gradient of wall∂p/∂n=0,this paper assumes∂T/∂n=0in which n is the normal direction of wall toward outside.
3 DES,DDES method
In the DES method,the length of the scale in S-A turbulence model and the distance from any point in the flow field to the nearest wall surface d,can be expressed as:

In whichΔis the maximum distance from the center of the grid center to the adjacent cells,constant coefficient CDES=0.65.The scale of grid in normal direction is small near the wall,CDESΔ>d,~d=d,model here is the standard S-A model and the model works in the RANS mode;Far from boundary layer,When CDESΔ<d,~d=CDESΔ.The model works in Large Eddy Simulation mode.Then,the generation term SPand the dissipation term SDin the equations can be respectively expressed as:

When the generation term is equal to the dissipation term (SP=SD),the eddy viscosity coefficient can be expressed as:

Where C is constant.This expression and the Smagorinsky subgrid stress model are very similar.
In the same flow problem two different grid division methods are adopted near the wall.The grid area corresponding to RANS and LES region are also different and the final results of the two sets of grids vary greatly,so that the solution of the mesh is sensitive to the results.Menter pointed out that under the situation of a closely continuous grid,the prediction of the separation will occur earlier,that is,the grid induced separation problem,then Spalart reconstruct the characteristic size d,the specific form is defined as the following:

This is the DDES method,in which fdis the function of the eddy viscosity coefficient vt,velocity gradient Uijand so on:
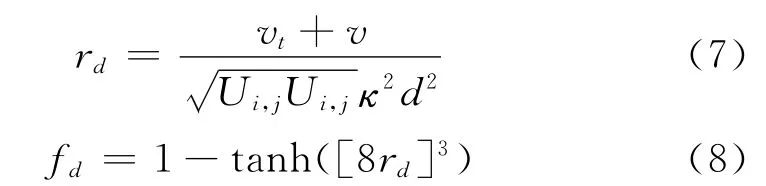
The effect of fdis to take the feedback of the characteristic size d for the results into consideration.
4 Numerical simulation of the delta wing with blunt leading edge
The computational model uses the 65°swept delta wing with medium-scale leading-edge radius and blunt edge in the second eddy flow experiment(Eddy Flow Experiment 2,VFE2)for study.It is shown in Figure 1.
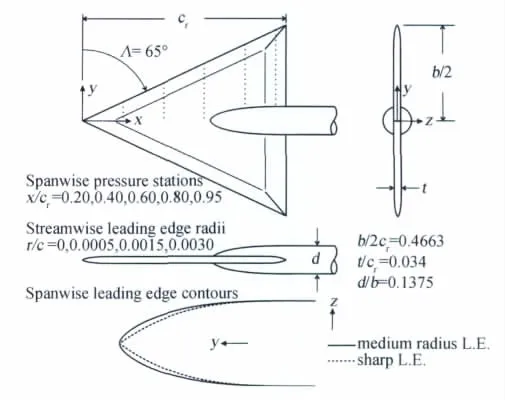
Fig.1 Model parameters图1 模型参数
Figure 2shows the distribution of the grid.Structured grid is used in this paper and space is divided into 133blocks and 5.93×10⁶grid cells.

Fig.2 Model grid图2 模型网格
Computation state:Ma=0.4,α=13.3°,Re=3×10⁶.The number of iteration is about 10000.
Test data shows that the main eddy on the leading edge induces the secondary eddy,there is also an inner eddy with the same direction in rotation(relative to the eddy on leading edge,it can be called outside eddy).The small difference of the start position of outside eddy will cause the change of pressure distribution significantly.The separation region on the front of wing is the place that the inner eddy occurs,and the position and the strength of the inner eddy will affect the distribution of another suction peak.
Since the model is a delta wing with the blunt leading edge,the start position of primary eddy is not the vertices at zenith.It is a challenge in CFD simulation to accurately capture the primary eddy along the axial front position.The location of the main eddy and the capture of suction peak can further determine the precise location of inner eddy.
Figure 3to Figure 5are the comparison of RANS,DES and DDES pressure distribution of numerical simulation and experimental data respectively.All three methods can well catch the main eddy,while the start position of the main eddy is more forward and the calculated intensity of inner eddy is all weaker than the experimental data.Because the all-turbulence computation is used and the results are greatly influenced by grid distribution,the accuracy of turbulence model and transition.eddy in the flow field experiences a very complex process,In the beginning the initial layer is near the boundary layer,and the boundary layer becomes thicker and thicker along the downstream flows,and develops to the edge side,and ultimately roll up to inner eddy,the eddy develops inward.Inner eddy develops from the pileup of boundary layer within the eddy and inducement of outside eddy,so that it is very sensitive to the upstream flow.As shown by the comparison of results,DES,DDES can describe the internal eddy better than RANS.Figure 6is the pressure distribution of the experimental data at different slices in X direction.The pressure coefficient of RANS,DES,DDES in different slices are shown from Figure 7to Figure 9,the results of all the suction peak of leading edge and the trend of the pressure on the surface of wing are in good agreement with the experimental results.The flow around the leading edge is attached over the whole span up to 45% chord length.The pressure coefficient predicted with the same grid by RANS is too high and the strength of the inner vortex simulated by RANS is too weak where the inner eddy even smaller.However,the surface pressure predicted by DES and DDES are in better agreement with the experiment than RANS simulation.The differences between the two results and the experiment are mainly on the trailing edge of the wing in that the flow is unsteady and complicated in the region and adequately high time averaging can solve the problem in the future.As is shown in Figure 9,DDES method has a better simulation of inner eddy than DES method,because DDES does not rely on the refinement of local grid in comparison to DES method.
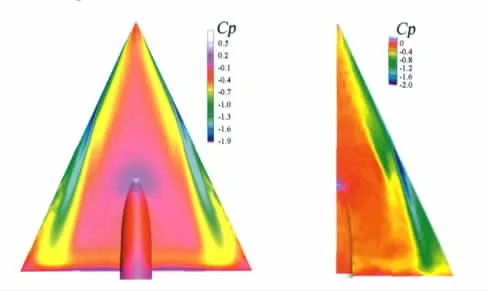
Fig.3 RANS pressure distribution in comparison with experiment图3 RANS压力分布与实验结果的对比
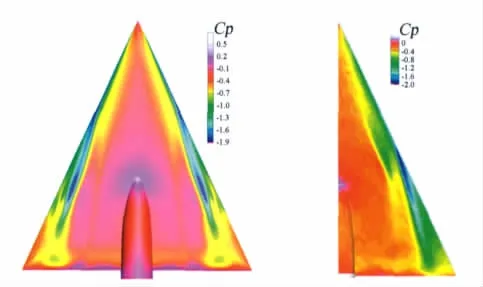
Fig.4 DES pressure distribution in comparison with experiment图4 DES压力分布与实验结果的对比

Fig.5 DDES pressure distribution in comparison with experiment图5 DDES压力分布与实验结果的对比
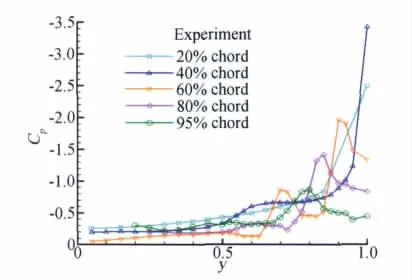
Fig.6 Pressure coefficient of experiment in different slices图6 实验下的不同截面压力分布
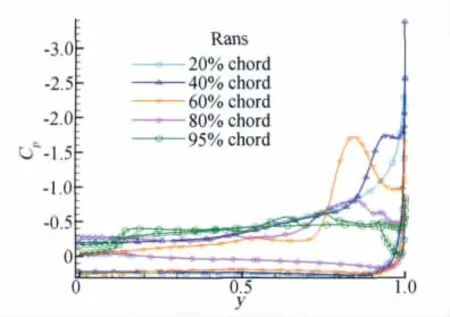
Fig.7 Pressure coefficient of RANS in different slices图7 RANS下的不同截面压力分布
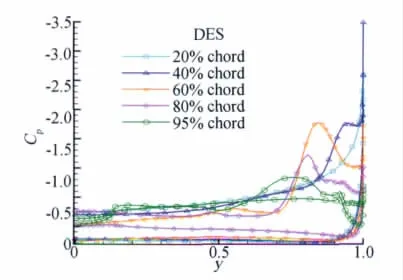
Fig.8 Pressure coefficient of DES in different slices图8 DES下的不同截面压力分布
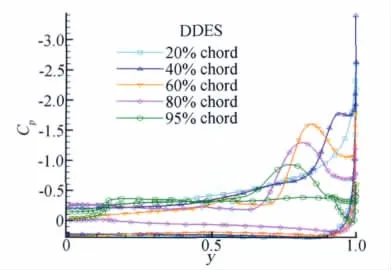
Fig.9 Pressure coefficient of DDES in different slices图9 DDES下的不同截面压力分布
Figure 10is the vorticity distribution of experiment,RANS,DES and DDES simulation results in different slices.What the Figure 10shows is helpful for us to understand the topology of the flow.The flow near the wing surface which corresponds to the higher vorticity forms the primary vortex in outer region.As is shown in Figure 11to 13,in comparison with the experiment data,DES and DDES show more details than RANS.
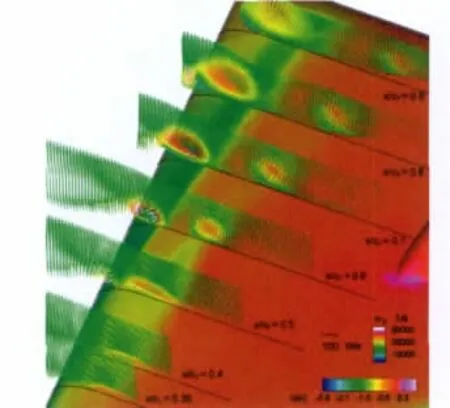
Fig.10 The vorticity distribution of experiment in different slices图10 实验下的不同截面涡量分布
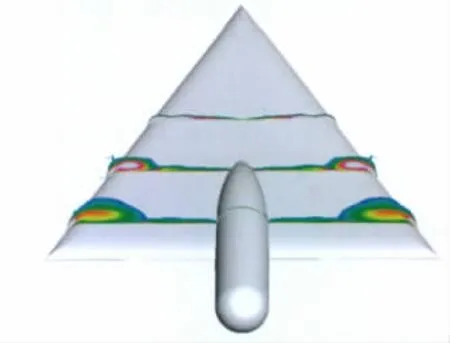
Fig.11 The vorticity distribution of RANS in different slices图11 RANS下的不同截面涡量分布
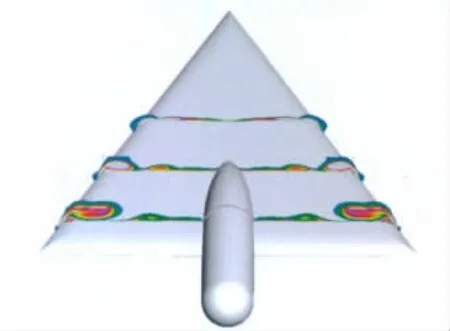
Fig.12 The vorticity distribution of DES in different slices图12 DES下的不同截面涡量分布
At high angle of attack,the boundary layer departs from the wall at the beginning of the separation line on the surface,and then the eddy rolls over on the leeward side.The eddy controls the aerodynamic characteristics of aircraft.Figure 14is the computational results of the spatial streamlines of DDES.It can be learned that the eddy can be well described from the beginning to the wake of the eddy.
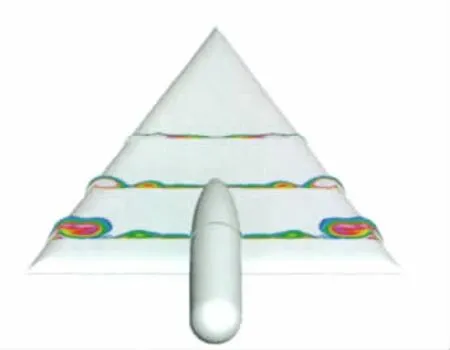
Fig.13 The vorticity distribution of DDES in different slices图13 DDES下的不同界面涡量分布

Fig.14 The streamlines of DDES图14 DDES方法下的流线图
5 Conclusions
In this paper,RANS,DES and DDES numerical simulation of eddy separation on the delta wing with blunt leading edge is bring into effect.The results of the numerical simulation are analyzed:
(1)In terms of the separation eddy flow,the pressure distribution of RANS is consistent with the experimental data given,but it can not give satisfactory results on the strength of small eddy.
(2)The pressure distribution of DES method is consistent with the experimental data,and more detail of the eddy topology can be given than RANS.DES method has obvious advantages in separated flow in comparison with RANS method.
(3)DDES method reduces the dependence of mesh and has a outstanding performance in the numerical simulation,numerical results given are also more rational,more detail of the eddy topology can be given than DES.
From the analysis of the mechanism of CFD,the flow around the wing experienced the process from the separation bubble on the leading edge,the instability of the flow to the rupture of the eddy.It is a complex process of change.The results of separated flow depend on the accurate simulation of boundary layer and detached eddy.While the DES uses RANS method near the wall and LES method in the area of detached eddy.The computational grid is saved near the wall and the boundary layer can also be well simulated,and LES method effectively solves the problem of numerical simulation of the separation zone.Through the study,the application of DES,DDES method leads to an increased understanding of the flow field of the delta wing with blunt leading edge at high angle of attack.
[1]ANDREA A M,LIOU M S,LOUIS A.Povinelli integration of Navier-Stokes equations using dual time stepping and a multigrid method[J].AIAA Journal,1995,33(6):985-990.
[2]SPALART P,ALLMARAS S.A one-equation turbulence model for aerodynamic flows[R].AIAA Paper 92-0439.
[3]SPALART P,JOU W,STRELETS M,et al.Comments on the feasibility of LES for wings and on the hybrid RANS/LES approach[M].Greyden Press,1997:137.
[4]PHILIPPE R.SPALART.Trends in turbulence treament[R].AIAA 2000-2306,2000.
[5]MENTER FR,KUNTZ M.Adaptation of eddy-viscosity turbulence models to unsteady separated flow behind vehicles[M].McCALLEN R,BROWAND F,ROSS J,editors.The aerodynamics of heavy vehicles:trucks,buses,and trains.Springer,2004.
[6]HANSEN R P,LONG L N.Large-eddy simulation of a circular cylinder on unstructured grids[R].AIAA 2002-0982,2002.
[7]SPALART P R,DECK S,SHUR M L,et al.A new version of detached-eddy simulation,resistant to ambiguous grid densities[J].Theory of Computational Fluid Dynamics,2006,20:181-195.
[8]ZHI X X,HAI X C,YU F Z,et al.Study of delayeddetached eddy simulation with weakly nonlinear turbu-lence model[J].Journal of Aircraft,2006,43(5):1377-1385.
[9]DROUGGE G.The international vortex flow experiment for computer code validation[J].ICAS Proceedings,1:35-41.
[10]ELSENAAR A,HJELEBERG L,BUTEFISCH K A,et al.The international vortex flow experiment[R].AGARD-CP-437,1:9-1,9-23.
[11]WAGNER B,HITZEL S,SCHMATZ M A,et al.Status of CFD validation on the vortex flow experiment[R].AGARD-CP-437.1:10-1,10-10.
[12]HOEIJMAKERS H W M.Modelling and numerical simulation of vortex flow in aerodynamics[R].AGARD-CP-494,1991:1-1,1-46.
[13]LUCKRING J M.Recent progress in computational vortexflow aerodynamics[R].AGARD-CP-494,1991:6-1,6-21.
[14]HUMMEL D,REDEKER G.A new vortex flow experiment for computer code validation[A].RTO-AVT Symposium on “Vortex Flow and High Angle of Attack”[C].Loen Norway,2001.
猜你喜欢
小型微型计算机系统(2021年12期)2021-12-08
北京航空航天大学学报(2021年6期)2021-07-20
中国农村水利水电(2021年2期)2021-03-05
当代陕西(2020年13期)2020-08-24
上海建材(2020年12期)2020-04-13
VOGUE服饰与美容(2019年10期)2019-12-02
流行色(2019年7期)2019-09-27
南水北调与水利科技(2018年2期)2018-07-05
能源研究与信息(2018年1期)2018-05-08
福州大学学报(自然科学版)(2016年5期)2016-03-15
