Three-dimensional flow field structure of ship propeller analysis bymeans of 2D-LDV
2014-04-07 08:58LIGuangnianWUWeiguoZHANGJunXIEYongheHUXiaofeiBAIXinglan
空气动力学学报 2014年5期
LI Guangnian, WU Weiguo, ZHANG Jun, XIE Yonghe, HU Xiaofei , BAI Xinglan
(1.School of Transportation,Wuhan University of Technology,Wuhan 430063,China;2.China Ship Scientific Research Center,Wuxi 214082,China;3.School of Naval Architecture and Ocean Engineering,Zhejiang Ocean University,Zhoushan 316000,China;4.China Warship Research and Design Center,Wuhan 430064,China)
0 Introduction
When design the propeller,it is essential to get accurate information about the structure of marine propeller′s trailing vortex.Since the efficiency is an important measurement for the propeller and largely depended on the distribution of the circular rector of each blade,the optimization of the distribution becomes a very sinificant part in the design of marine propeller[1-3].In 1919,Betz firstly used the lifting line theory to deduce the condition of the optimal distribution of circular rector for the propellers working in uniform flow.Since then,many scholars did plenty of researches in this field[4-6].In 1992,Li Zhiheng[7]measured the velocity field of propeller by using the LDV system and investigated the circular rector by integration of velocity between blades.10years later,Su Yumin[8]dispersed the vortex sys-tem by the propeller′s lift-line vortex model,and then made use of the variation principle to establish a basic equation that is content to the given load factor or power factor of a propeller to calculate the best distribution of circular rector.In addition,he used the numerical calculating method to solute the equation and finally got the optimal solution.In 2006,Dong Zhengqing[9]used the LDV facility to measure the inner flow field of the ducted propeller by opening a window on the pipe walls and analyze the result.Then he also got the blades′radial distribution of the circular rector by integration by parts of tangential velocity in lower reaches and compare it with that of open water propeller in the circumstance of the equal thrust force.In 2007,Li Guangnian[10]analyzed the result of the propeller trailing vortex sheet′s LDV test in detail.He also compared the flow′s information of the two cross section in the propeller tailing vortex under the condition of uniform flow,as well as the circumferential distributions of axial velocity and radial velocity in different radius of the same cross section.However,because of the limited technologies at that time,Li can only get the information of the axial direction and radial direction in his test,without the distribution of the velocity in circumferential direction.
In the recent 20years,despite of the rapid development of the CFD technology and many satisfying results about the hydrodynamic performance of propeller we got through the CFD method[11-13],it is still elusive to monitor the micro-structures of complex flow,so the technique of flow field measurement and experiment is indispensable.Furthermore,we can hardly establish any theoretical model and confirm the result without the certification form the experiments.Fortunately,with the development of science and technology,the laboratory apparatus and the experiment methods have been enhanced a lot and many complicated problems that used to haunting the researchers is promising to be solved.By the means of relative experiments,it is possible to connect the detailed information about the generation process of propeller trailing vortex and flow of propeller tip to optimize the design of propeller as well as verify the CFD result systematically.This essay will describe the experiment that takes advantage of 2D-LDV technology to test the 3-D velocity field on one of the cross section in propeller trailing vortex sheet in large cavitation tunnel by arranging the test pots optimally,and analyze the experimental data in a detailed way.
1 Experiment method
The experiment object is DTMBP4119paddle and the equipments and propeller model will be introduced in the reference[5].In this experiment,the propeller is designed when J=0.833.The positive direction of x-axis is flow direction;that of the z-axis is vertically upward through the propeller disk center;y-axis is determined by the right-hand rule.The aim of this experiment is to measure the axial and radial velocities of the propeller′s wake field.The 0°of the motion coordinate system represents the reference line of the propeller blade,and the 0°of static coordinate system stands for the horizontal meridional plane.The cross-section of slip stream which the x/R=0.3281is set as the test surface.The test point in radial coordinate are r/R=0.3875,r/R=0.4,r/R=0.5,r/R=0.575,r/R=0.7625,r/R=0.8988,r/R=0.95,r/R=1.0.The speed range of 2Dlaser speedometer produced by the TSI is(0~100)m/s,with error of 0.2%,and the location of the speed testing point can be controlled by the 3Dmobile coordinates rack.Since the experiment instrument can only record the 2Dspeed,namely the axial and vertical speed,in this experiment we measured two points that were in the same radius to get the 3Dvelocity field,as shown in figure 1.First we measured the point A of which the axial speed is that of the propeller wake,and the vertical speed is the tangential velocity of the propeller wake,then the point B measurements,it is the same as that of the point A.When it comes to the rotating flow field,the LDV measure process can be divided to 2steps.First,according to the time information of the rotating phase form the propeller shaft power meter phase encoder,we recorded different information into the different circumferential position of the space unit.Then in the last space unit,we calculated the average speed of different times.So the LDV velocity measurements given in the final value is actually a average circumferential speed of each unit of space time.In this experiment,the space angle resolution of LDV measurement system is set to 0.9°,every 0.9°as a spatial unit,thus there are 400space units in a circle of 360°.From the result,we are confident that the resolution can meet the required test resolution accuracy.Because the phase point around is different,in the test coordinate system,the speed data of points B had 270°phase shift contrasted to points A.In order to point out the phase relationship between the test data and that of the real propeller blades,power meter phase encoder is used in this experiment.As the phase of the encoder and between the propeller shaft is fixed,the propeller blades in the test phase of the specific coordinate system can be tested by the laser beam alignment and positioning of the propeller blade reference line method.The result showed that when encoder instructions pointed to 0°,the reference line of propeller leaf 1is at the 20°phase in test coordinate system.
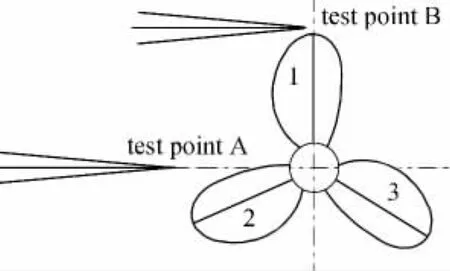
Fig.1 Test points图1 测试点
2 Data analysis
In this essay,U0,Vx,Vrand Vtstands for the stream velocity,axial velocity in fluid field,radial velocity and circumferential velocity respectively.
2.1 Circumferential velocity field
Figure 2shows the distribution curves of the circumferential velocities in different radiusof the cross section.It indicates that the distribution of the circumferential velocity changes periodically and three snap backs appear in one circle,namely one snap back per one paddle period,which are real velocity values and results from that the measuring point passing trailing vortex and viscosity wake surface[14-15].

Fig.2 Variation of circumferential velocity图2 周向速度分布
Figure 3reveal the circumferential velocity on transversal surface by x/R=0.3281.From Figure 3,we can find that,corresponding to three blades,three tip vortices distribute on the transversal surface by equal space and the vortex center locates around the place where r/R=0.95.It is apparent in the Figure 3that there are three strip obvious high speed tapes in the curves of the circumferential velocity,corresponding to three blades.These high speed tapes extend from propeller hub to blade tip and connect with tip vortex.Three strip trailing vortex sheets which orbit along with the propeller penetrate the transversal surface,leading to above three strip mutational speed area.Figure 4provide flow information of trailing vortex on transversal surface.Vector diagram shows that the flow around tip vortex and trailing vortex is chaos and velocity gradient is large.Moreover,one step appears when flow line passes trailing vortex,which indicates the flow around trailing vortex has obvious deformation effect and the flow around tip vortex has circumfluence.The flow separation also appears.
2.2 Hydrodynamic pitch angle analysis
Using axial and tangential velocity field from the experiment,we can get hydrodynamic pitch angle by calculation.
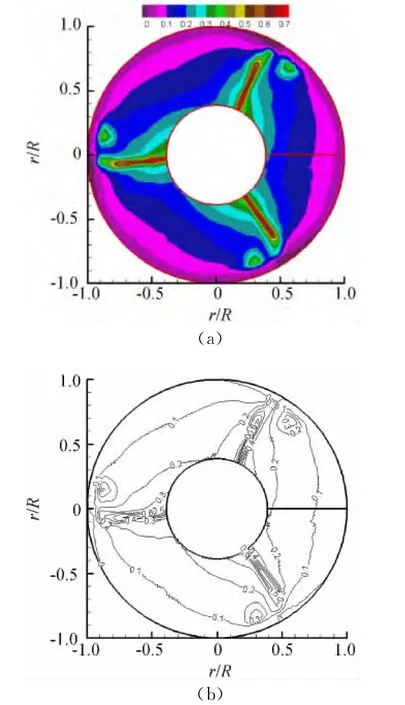
Fig.3 Contour of circumferential velocity图3 周向速度云图
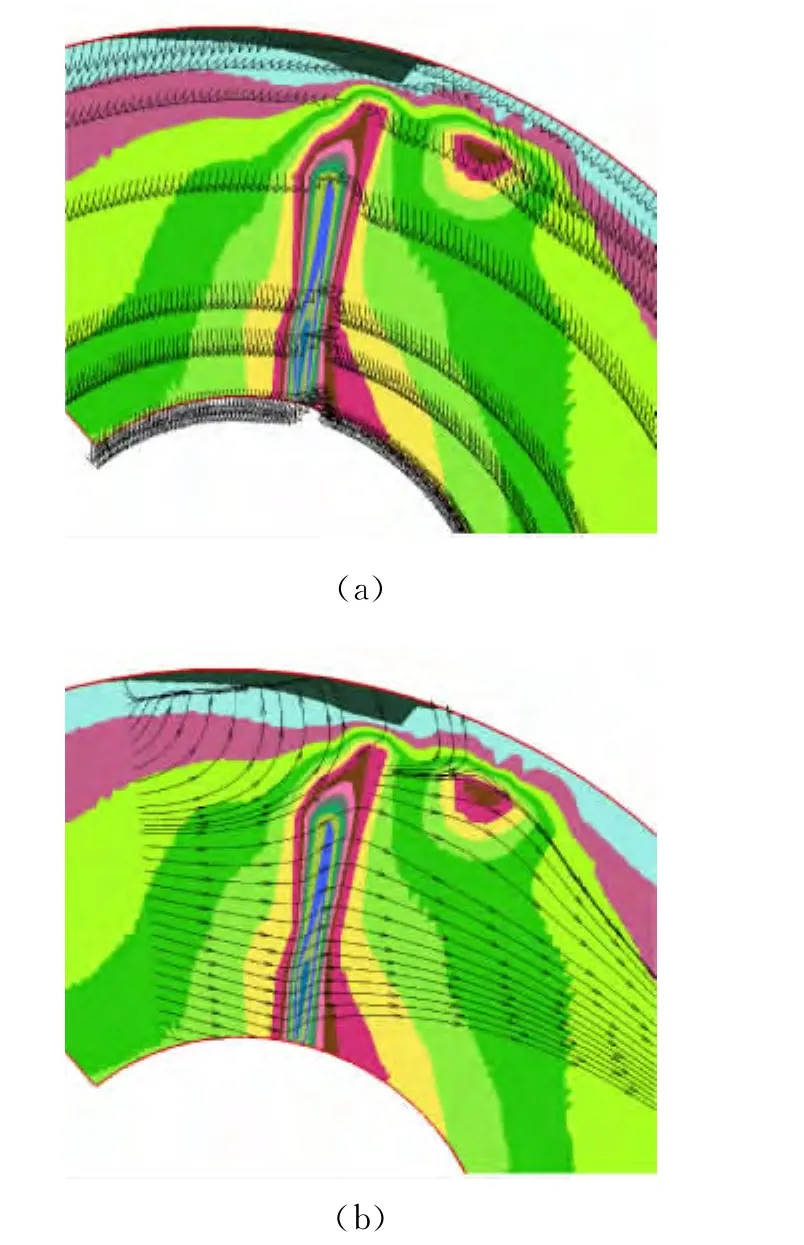
Fig.4 Tip vortex and trailing vortex图4 梢涡和尾涡
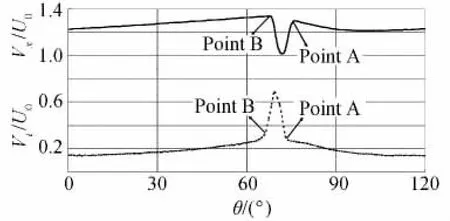
Fig.5 Point A and point B图5 A点、B点示意
Fig.6 Hydrodynamic pitch angle图6 水动力螺距角
2.3 Total attachment vortex circulation analysis
According to the tangential velocity of propeller trailing vortex measured from the experiment,we can obtaintotal attachment vortex circulation of propeller bound vortex from the Stokes integration and make the circulation dimensionless by 2πRU0.Then we can get dimensionless circulation,
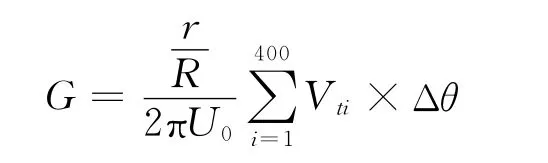
whereΔθis the configured angular solution in the LDV test,and the calculated results are shown in figure 7.The Figure 7reveal that,in the circumstance of uniform flow,the distribution of the circulation in propeller trailing wake along radial direction is one of our acquainted forms and the circulation of measurement plane along the propeller direction is a process that increasing gradually,which is maximum when r/R=0.7.With the distance from propeller quotation increasing,the circulation is on a declining curve as a whole,which reaches to zero when it goes to tip.

Fig.7 Total attachment vortex circulation图7 附着涡总环量
3 Conclusion
This paper analyzes the three-dimensional flow field informationof propeller wake under uniform flow.Experiment results show the macroscopic flow field trends and microcosmic dynamic information.The following conclusions can be drawn:
1)The LDV technology has huge advantages in the flow details of the test.It can capture the subtle flow structure,such as the speed mutation near the tip of propeller blade.
2)The hydrodynamic pitch test results show the law of the spatial distribution.In order to obtain the accurate information,the next step should be encrypting the arrangement of radial test points.
3)The calculation results of the total circulation of the propeller attach to vortex consistent with the theory,but because of the structure of the tip of the flow field is complex and the velocity gradient is large,this part of the circulation distribution remains to be further explored.To increase test points along the radial direction,in series section and in a number of conditions,the flow field is considered for further work.
[1]WANG G Q,DONG S T.Theory and applications of marine propeller[M].Harbin Engineering University Press,2005.(in Chinese)王国强,董世汤.船舶螺旋桨理论与应用[M].哈尔滨工程大学出版社,2005.
[2]DONG S T.WANG G Q.Hydrodynamic of ship propulsors[M].National Defense Industry Press,2009:20-24.(in Chinese)董世汤,王国强.船舶推进器水动力学[M].国防工业出版社,2009:20-24.
[3]LI J H,TANG D H,DONG S T.Propeller design by prescribed pressure distribution[J].Journal of Ship Mechanics,2010,14(1-2):10-19.(in Chinese)李俊华,唐登海,董世汤.指定压力分布的螺旋桨设计[J].船舶力学,2010,14(1-2):10-19.
[4]LI G N,GUO X,FU J J.Flow on wing with tip clearance analyzed by means of 2D-PIV[J].The Ocean Engineering,2010,28(2):100-104.(in Chinese)李广年,郭欣,傅俊杰.带端部间隙的机翼绕流PIV测量[J].海洋工程,2010,28(2):100-104.
[5]JU L,BA J Q,SUN Z W,et al.Integrated aero-structure design of circulation distribution for commercial aircraft wing[J].Acta Aeronautica et Astronautica Sinica,2013,34(12):2725-2732.(in Chinese)巨龙,白俊强,孙智伟,等.客机机翼环量分布的气动/结构一体化设计[J].航空学报,2013,34(12):2725-2732.
[6]SONG Y P,YANG X G,LI Y C,et al.Numerical simulation of coanda effect in circulation control airfoil[J].Journal of Engineering Thermophysics,2010,31(9):123-130.(in Chinese)宋彦萍,杨晓光,李亚超,等.环量控制翼型中柯恩达效应的数值模拟[J].工程热物理,2010,31(9):123-130.
[7]LI Z H.LDV measurements of field of propeller and circulation[D].China Ship Scientific Research Center,1992,05:2-5.(in Chinese)李志恒.螺旋桨流场及环量LDV测量方法[D].上海交通大学,中国船舶科学研究中心,1992,05:2-5.
[8]SU Y M,HUANG S.Numerical optimization of circulation distribution on marine propellers[J].Journal of Harbin Engineering University,2002,23(1):1-4.(in Chinese)苏玉民,黄胜.船舶螺旋桨叶片环量的数值优化[J].哈尔滨工程大学学报,2002,23(1):1-4.
[9]DONG Z Q,LU L Z,ZHOU W X.LDV measurements of inner velocity field of ducted propeller[J].Journal of Ship Mechanics,2006,10(5):24-31.(in Chinese)董郑庆,陆林章,周伟新.导管螺旋桨内流场的LDV测量[J].船舶力学,2006,10(5):24-31.
[10]LI G N.LDV measurements of propeller trailing vortex[J].Journal of Experiments in Fluid Mechanics,2010,24(4):75-79.(in Chinese)李广年.基于LDV技术的螺旋桨尾涡测试[J].实验流体力学,2010,24(4):75-79.
[11]WU B S.An overview of verification and validation methodology for CFD simulation of ship hydrodynamics[J].Journal of Ship Mechanics,2011,15(6):577-591.
[12]ZHAO F M,GAO C J,XIA Q.Overlap grid research on the application of ship CFD[J].Journal of Ship Mechanics,2011,15(4):332-341.(in Chinese)赵发明,高成君,夏琼.重叠网格在船舶CFD中的应用研究[J].船舶力学,2011,15(4):332-341.
[13]ZHANG Z J,CHEN Z G.Development of naval CFD structured grid auto-generation technology[J].Journal of Shanghai jiaotong University,2012,46(2):317-322.(in Chinese)张振江,陈作钢.船舶CFD结构化网格自动生成技术的开发[J].上海交通大学学报,2012,46(2):317-322.
[14]JESSUP S.Propeller blade flow measurements using LDV[C].ASME Summer Fluids Division Meeting,Lake Tahoe,NV,1994.
[15]SERAFINI.Laser-velocimeter flow-field measurements of an advanced turboprop[C].17th Joint Propulsion Conference,AIAA/SAE/ASME,Colorado Springs,Colorado.
猜你喜欢
舰船科学技术(2022年11期)2022-07-15
航空发动机(2022年1期)2022-03-11
速读·中旬(2021年2期)2021-07-23
新传奇(2019年40期)2019-11-01
校园英语·上旬(2019年9期)2019-09-16
科技信息·下旬刊(2018年9期)2018-10-21
航空发动机(2018年4期)2018-09-18
检察风云(2017年9期)2017-05-18
大陆桥视野(2016年12期)2016-12-27