
Seasonal Variations in Phytoplankton Community Structure in the Sanggou, Ailian, and Lidao Bays
2014-04-26 10:54YUANMingliZHANGCuixiaJIANGZengjieGUOShujinandSUNJun
YUAN Mingli, ZHANG Cuixia, JIANG Zengjie, GUO Shujin, and SUN Jun,
1) College of Marine Science and Engineering, Tianjin University of Science and Technology, Tianjin 300457, P. R. China
2) Yellow Sea Fisheries Research Institute, Chinese Academy of Fishery Sciences, Qingdao 266071, P. R. China
Seasonal Variations in Phytoplankton Community Structure in the Sanggou, Ailian, and Lidao Bays
YUAN Mingli1), ZHANG Cuixia1), JIANG Zengjie2), GUO Shujin1), and SUN Jun1),*
1) College of Marine Science and Engineering, Tianjin University of Science and Technology, Tianjin 300457, P. R. China
2) Yellow Sea Fisheries Research Institute, Chinese Academy of Fishery Sciences, Qingdao 266071, P. R. China
The seasonal variations in phytoplankton community structure were investigated for the Sanggou Bay (SGB) and the adjacent Ailian Bay (ALB) and Lidao Bay (LDB) in Shandong Peninsula, eastern China. The species composition and cell abundance of phytoplankton in the bay waters in spring (April 2011), summer (August 2011), autumn (October 2011), and winter (January 2012) were examined using the Utermöhl method. A total of 80 taxa of phytoplankton that belong to 39 genera of 3 phyla were identified. These included 64 species of 30 genera in the Phylum Bacillariophyta, 13 species of 8 genera in the Phylum Dinophyta, and 3 species of 1 genus in the Phylum Chrysophyta. During the four seasons, the number of phytoplankton species (43) was the highest in spring, followed by summer and autumn (40), and the lowest number of phytoplankton species (35) was found in winter. Diatoms, especially Paralia sulcata (Ehrenberg) Cleve and Coscinodiscus oculus-iridis Ehrenberg, were predominant in the phytoplankton community throughout the study period, whereas the dominance of dinoflagellate appeared in summer only. The maximum cell abundance of phytoplankton was detected in summer (average 8.08 × 10³cells L-1) whereas their minimum abundance was found in autumn (average 2.60 × 10³cells L-1). The phytoplankton abundance was generally higher in the outer bay than in the inner bay in spring and autumn. In summer, the phytoplankton cells were mainly concentrated in the south of inner SGB, with peak abundance observed along the western coast. In winter, the distribution of phytoplankton cells showed 3 patches, with peak abundance along the western coast as well. On seasonal average, the Shannon-Wiener diversity indices of phytoplankton community ranged from 1.17 to 1.78 (autumn > summer > spring > winter), and the Pielou’s evenness indices of phytoplankton ranged from 0.45 to 0.65 (autumn > spring > summer > winter). According to the results of canonical correspondence analysis, phosphate level was the major factor that limited the occurrence of P. sulcata and C. oculus-iridis, whereas optimal temperature and low salinity were responsible for Prorocentrum blooms in summer. The detailed description of seasonal variations in phytoplankton community structure in the three bays provide reference data for future studies on marine ecosystems and mariculture in adjacent areas.
phytoplankton; seasonal variation; community structure; Sanggou Bay; Ailian Bay; Lidao Bay
1 Introduction
Phytoplankton are the primary producers in marine ecosystems, which absorb CO2and solar energy into organic compounds and produce energy through photosynthesis. Phytoplankton play an important role in global material cycle and energy flow (Sun, 2011), as well as carbon flux, cloud albedo, seawater heat flux, and luminous flux (Sun et al., 2011). In view of the fundamental link of marine food chain, phytoplankton are considered to be an important food resource of zooplankton and provide directly or indirectly bait for breeding aquatic animals, such as fish, shrimp and shellfish (Ren et al., 2010). The species composition and biomass conditions of phytoplankton directly affect their harvest production (Jin, 1965; Kang, 1986). Thus, investigation of phytoplankton community characteristics is of reference value for estimating the potential yield and managing reasonable development and utilization of the marine biotic resource (Cheng, 2004). Due to the small individual size and short life cycle, phytoplankton can rapidly respond to environmental changes. Thus, the phytoplankton community structure serves as an indicator of water quality (Shen and Shi, 2002).
The Sanggou Bay (SGB, about 133.3 km2) is a semienclosed basin located in the eastern Shandong Peninsula and open to the Yellow Sea. The SGB is one of the most important mariculture bases in northern China (Song and Cui, 1996; Zhang et al., 2012) and is rich in economically important aquatic species such as seaweed, oysters, and scallops (Mao et al., 1988). In mariculture process, the excessive baits and the metabolites of farm-raised cultures deposited into sediment or suspended in water are the major components that cause water quality degradation in shallow waters (Wan, 2012). Along with the rapid development of local mariculture industry, the environ-ment of SGB and the adjacent water bodies are negatively impacted, as most obviously reflected by the changes in the phytoplankton community structure (Sun and Zhao, 1998; Zhu et al., 2000). Because of selective filter-feeding to dinoflagellates, the scallop aquaculture has changed the phytoplankton community composition in SGB (Zhang et al., 2005). Early surveys indicated that to some extent, scallop culture reduced the community diversity of phytoplankton in the SGB during 1983–2004 (Song et al., 2007). Additionally, the distribution of phytoplankton species was uneven while their biodiversity was at the medium level in the SGB during 2003–2005 (Mu et al., 2009). With the development of aquaculture, the phytoplankton community structure in the SGB has significantly changed in the past 30 years. Due to the significant role of phytoplankton as the primary marine producers, the changes in their community structure would inevitably impose a feedback effect on local farming. Deep understanding of phytoplankton community structure in the SGB would provide guiding information for reasonable management of aquaculture.
Previous studies on phytoplankton in the SGB have primarily focused on tow-net samples (Song et al., 2007; Zhang et al., 2005), in which small-sized phytoplankton cells are easily omitted due to the limitation of the net sampling method with mesh aperture (Sun et al., 2002; Sun et al., 2003a). Despite the use of water samples in some surveys, such kind of work is limited to phytoplankton community characterization and rarely correlates phytoplankton parameters to local hydrological factors, thus blurring the relationship between the environment changes and the phytoplankton-related biological reactions (Mu et al., 2009). In the present study, we focused on the seasonal succession of phytoplankton communities and the changes in several environmental factors such as water temperature, salinity, and nutrient levels during the four seasons of a year in SGB and the adjacent Ailian Bay (ALB) and Lidao Bay (LDB). The results were analyzed to test the relationship between the phytoplankton community structure and the environmental factors, in order to provide guiding information for relevant studies on marine ecosystem and aquaculture.
2 Material and Methods
2.1 Study Area and Sampling Strategy
A multidisciplinary research was carried out in the SGB and the adjacent ALB and LDB (37˚00´–37˚15´N, 122˚30´–122˚45´E) (Fig.1) during April 23–25, 2011 (spring), August 2–5, 2011 (summer), October 27–28, 2011 (autumn), 2011, and January 5–7, 2012 (winter). A total of 33 stations were planned and investigated during the 4 cruises.
Water depth, temperature, salinity and dissolved oxygen (DO) were measured in situ with a calibrated automatic analyzer (YSI Professional Plus Multiparameters Water Quality Meter, US). Surface water samples (underwater 0.5 m) were collected using a Ruttner sampler (HYDRO-BIOS, Germany) at each station. Additional samples (depth 10 m) were collected at the stations with water depth >10 m. Phytoplankton samples (250 mL) were taken in polyethylene bottles and fixed with buffered formaldehyde (final conc. 2% by volume). 197 water samples were fixed in the investigation and stored at room temperature for laboratory analyses.
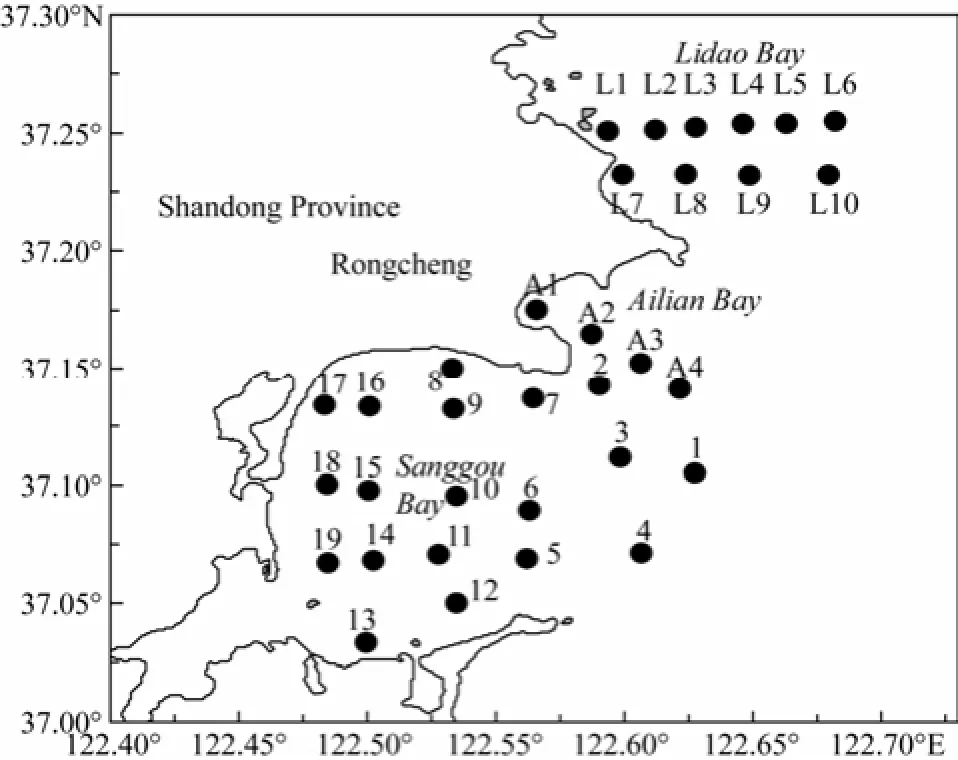
Fig.1 Study area and sampling stations in the Sanggou, Ailian and Lidao bays.
2.2 Laboratory Analyses
Cell enumeration and species identification of phytoplankton were performed at ×200 or ×400 magnification under an inverted microscope after 24-h sedimentation of the fixed samples in a 25 mL Utermöhl chamber (American Optical Ltd.) (Sun et al., 2002; Sun et al., 2003a). Phytoplankton species were identified according to Jin et al. (1965) and Isamu (1991).
Water samples were filtrated with 0.45-μm-pore-sized acetate fiber membranes for chemical analyses. Ammonium (NH4-N), nitrate (NO3-N), and nitrite (NO2-N) levels were analyzed by using the sodium hypobromite/hypochlorite oxidation, zinc-alternate reduction, and naphthyl ethlenediamine spectrophotometric methods, respectively. Soluble reactive phosphate (SRP) and silicate concentrations were determined by phosphorus- and silicon-molybdenum blue reactions, respectively (Grassholf et al., 1983).
2.3 Community Structure Analysis
The phytoplankton community diversity was evaluated using the Shannon-Wiener (S-W) diversity index (H') (Shannon, 1951; Sun and Liu, 2004) as follows:
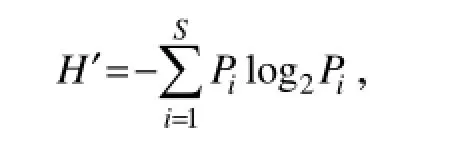
where Piis the relative cell abundance of a species, and i and S are the numbers of the species. The evenness index (J) (Pielou, 1984) was calculated from H' (Sun and Liu, 2004) as follows:
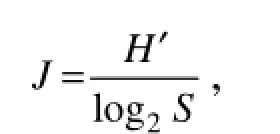
where H' is the S-W diversity index, and S is the number of the species in a sample. The phytoplankton dominance index (Y) was calculated using the following formula (Sun et al., 2003b):

where niis the number of the individual species, N is the total number of all species, and fiis the occurrence frequency of the species in a sample. The Jaccard similarity index (P) was calculated using the following formula (Jaccard, 1908):
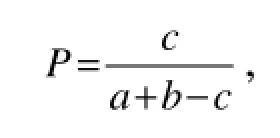
where a and b are the numbers of species in 2 different seasons, and c is the number of the common species in the 2 seasons.
Canonical correlation analysis (CCA) (ter Braak, 1986) was performed to analyze the relationship between phytoplankton cell abundance and related environmental factors. Biplots of different seasons were made with the MVSP3.1 program package (Kovach Computing Services, UK).
3 Results
3.1 Hydrology
The hydrological characteristics of SGB, LDB, and ALB, including water depth, temperature, salinity, pH, and nutrient levels, were investigated. The water depths of the 3 bays range from 5 m to 40 m and average approximately 16.8 m. As located in a typical temperate coastal area, the 3 bays have an average water temperature of 4.4℃ in winter and 20.2℃ in summer. There are small differences in the average salinity among 4 seasons, ranging from 30.41 in summer to 31.54 in winter. The average transparency depth varies seasonally from 0.67 m in winter to 1.49 m in spring. The maximum pH value 8.68 occurs in spring and the minimum pH value 8.24 is in autumn. The nitrogen level is the highest in autumn (average 0.377 mg L-1), followed by summer (average 0.254 mg L-1); the lowest value appears in spring and winter (average 0.244 mg L-1). The phosphate levels of bay waters remain low from spring to winter, i.e., 0.009, 0.005, 0.003, and 0.002 mg L-1on average, respectively. The average silicate level of bay waters is approximately 10-fold higher in winter (up to 3.453 mg L-1) than in spring (0.322 mg L-1), summer (0.199 mg L-1), and autumn (0.278 mg L-1).
3.2 Phytoplankton Species Composition
A total of 80 taxa belonging to 39 genera of 3 Phyla were identified in 197 phytoplankton water samples. These included 64 species of 30 genera in the Phylum Bacillariophyta (76.92% of total species number); 13 species of 8 genera in the Phylum Dinophyta (20.51%); and 3 species of 1 genus were Chrysophyta (2.57%). The species composition of phytoplankton community followed the temperate coastal and widely distributed regimes. The total number of phytoplankton species was greater in spring than in the other 3 seasons. The number of diatom species accounted for >50% of the total species number in 4 seasons, showing similar seasonal changes to those with phytoplankton. By comparison, dinoflagellates were most diverse in summer but were still less diverse than diatoms (Fig.2). Chrysophyta only appeared in summer and autumn with very few species.

Fig.2 Comparison of the numbers of phytoplankton species in the Sanggou, Ailian and Lidao bays among 4 seasons.
There were 20–25 identical species among 4 seasons in the surveyed area, of which 15 species appeared in all of the four seasons, including 14 species of diatom and 1 species of dinoflagellate. The Jaccard similarity index values were 0.317–0.500 (Table 1) with the highest level detected between autumn and winter. The above results suggest that the phytoplankton community structure obviously changes with seasons.
In the surveyed area, the diatoms Paralia sulcata (Ehrenberg) Cleve and Coscinodiscus oculus-iridis Ehrenberg were most common and predominant in four seasons (Table 2). P. sulcata was the primary dominant species that accounted for 36.60% of the phytoplankton abundance in summer and >50% in the other seasons (up to 72.01% in winter). Other dominant diatoms species such as Thalassiosira sp. and Nitzschia sp. frequently occurred in spring, autumn, and winter, whereas dinoflagellates rather than diatoms were predominant in summer. Two dominant dinoflagellates Prorocentrum gracile and Prorocentrum triestinum accounted for 17.41% and 20.92% of the phytoplankton abundance, respectively. Both species were mainly concentrated at the Station 19. In spring, a large number of Detonula pumila appeared at the StationL4 only, accounting for 96.23% of the phytoplankton abundance. In winter, the dominant species were diatoms. The occurrence frequency of P. sulcata in winter (90%) was the highest among seasons.
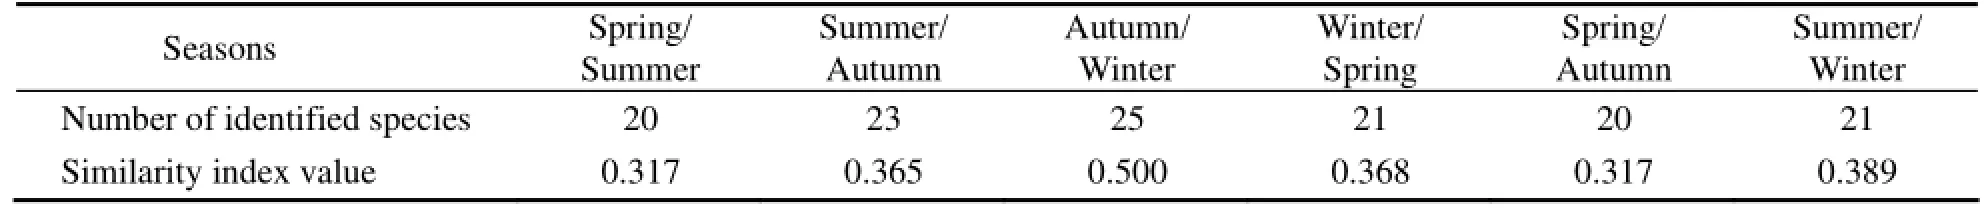
Table 1 The Jaccard similarity index of phytoplankton community in the Sanggou, Ailian and Lidao bays between seasons
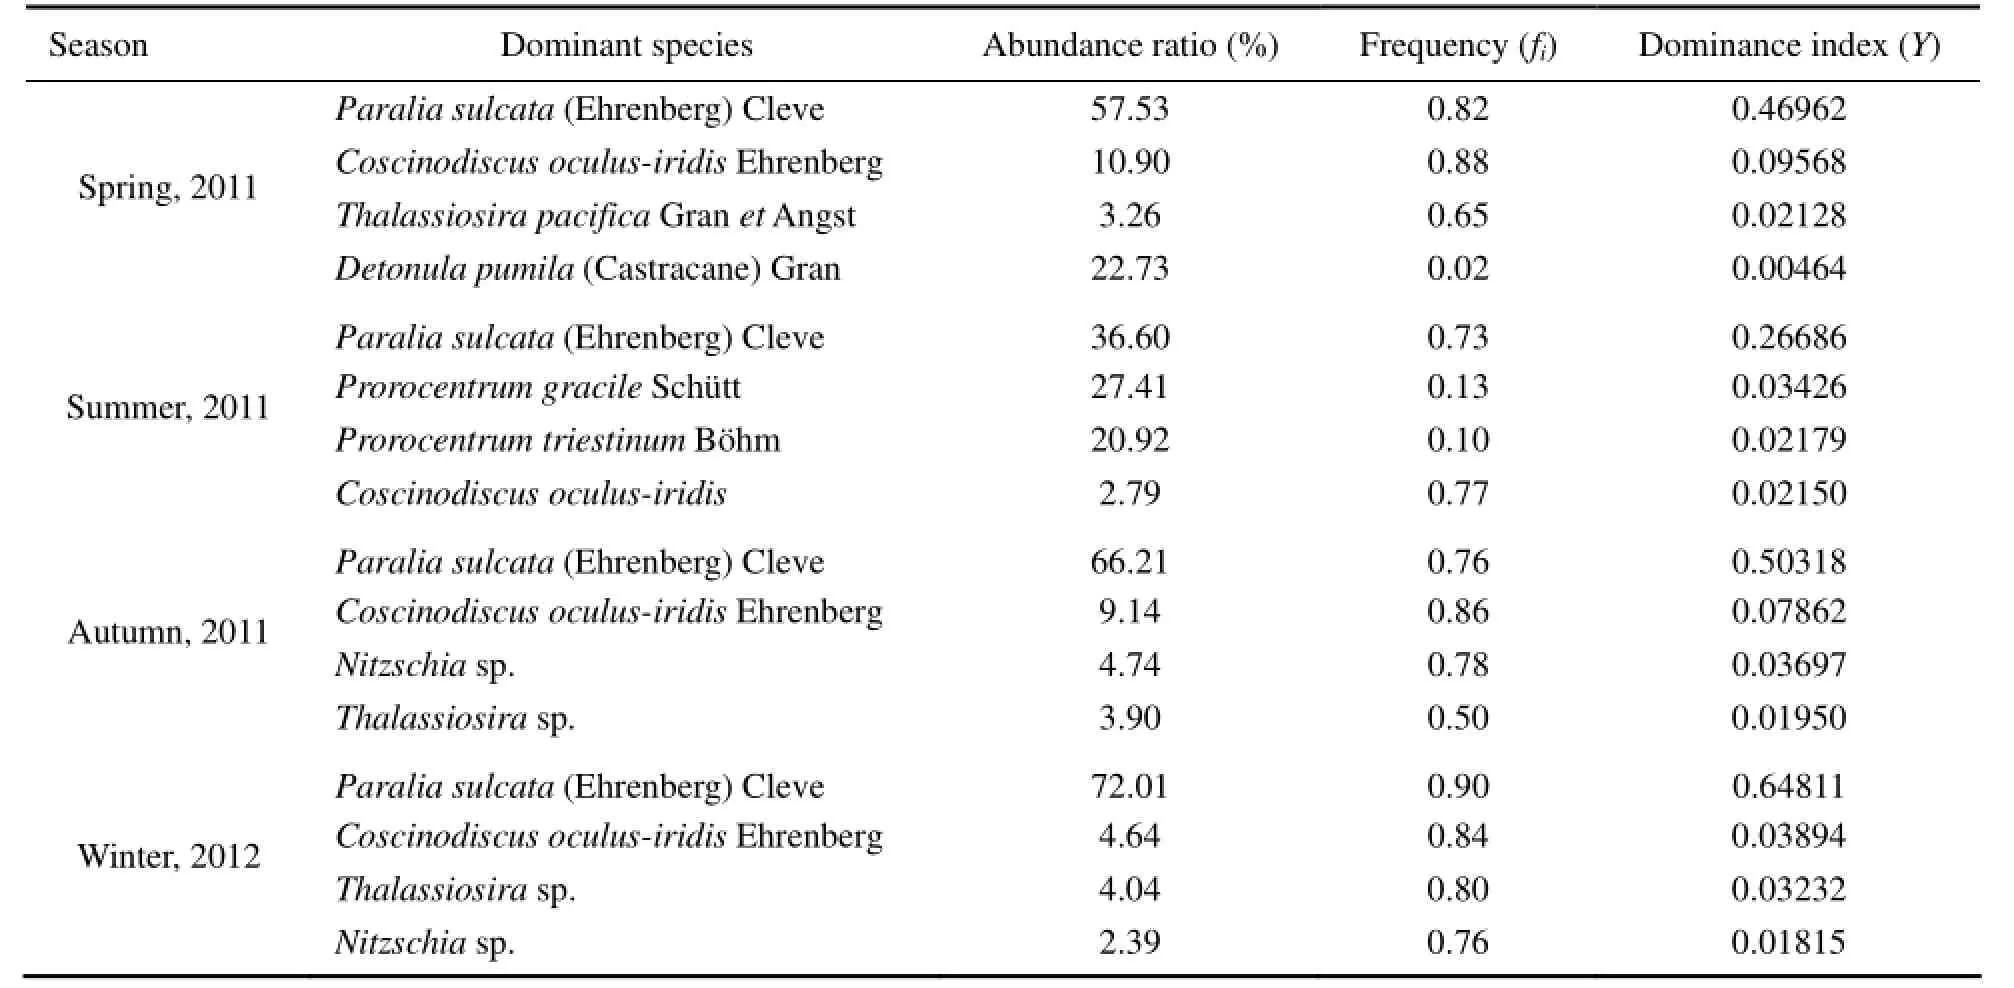
Table 2 Dominant species of phytoplankton in the Sanggou, Ailian and Lidao bays
3.3 Phytoplankton Cell Abundance
The cell abundance of phytoplankton ranged (0.15–188.80) × 103cells L-1(average 5.84 × 10³cells L-1) and peaked in summer (seasonal average 8.08 × 10³cells L-1), followed by spring (6.62 × 10³cells L-1) and winter (6.07 × 10³cells L-1). The lowest cell abundance of phytoplankton was found in autumn (2.60 × 10³cells L-1) (Fig.3A). The cell abundance of diatom ranged from 0 to 76.67 × 10³cells L-1(average 4.77 × 10³cells L-1) and peaked in spring (seasonal average 6.61 × 10³cells L-1), followed by winter (6.07 × 10³cells L-1) and summer (3.85 × 10³cells L-1). The lowest cell abundance of diatom was detected in autumn (2.55 × 10³cells L-1) (Fig.3B). The cell abundance of dinoflagellate was 0–185.87 × 10³cells L-1(average 1.07 × 10³cells L-1), with average value peaking in summer (seasonal average 4.22 × 10³cells L-1) and being ≤0.05 × 10³cells L-1in other seasons (lowest in winter, 0.003 × 10³cells L-1) (Fig.3C). Over the four seasons, the relative abundance of diatom was 99.96% and 99.76% of total phytoplankton abundance in winter and spring, respectively, followed by 98.05% in autumn and only 47.67% in summer. The relative abundance of dinoflagellate was 52.27% of the total phytoplankton abundance in summer and <2% in other seasons. Chrysophyta merely appeared in summer and autumn in low cell abundance.
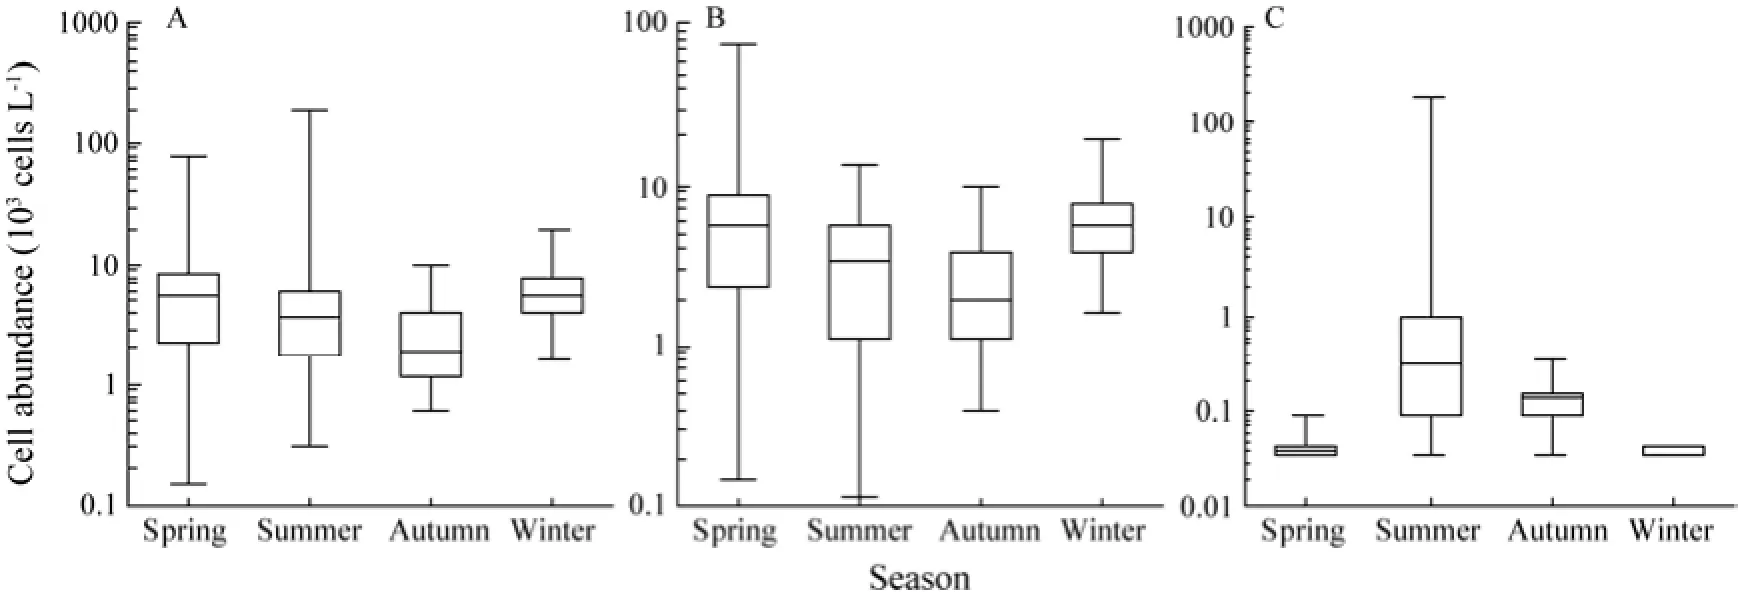
Fig.3 Box-Whisker plots of phytoplankton cell abundance (× 103cells L-1) in the Sanggou, Ailian and Lidao bays in the four seasons. Whiskers mean minimum and maximum values; boxes display the lower and upper quartiles; and lines mean median-sets. A, phytoplankton; B, diatom; and C, dinoflagellate.
3.4 Horizontal Distribution of Phytoplankton Cell Abundance
3.4.1 Surface water
The horizontal distribution of phytoplankton cell abundance in surface water of the bays over the four seasons is shown in Fig.4. In spring, high-abundance phytoplankton were mainly concentrated in the north of central LDB and sparsely distributed in coastal waters. The maximum cell abundance of phytoplankton (76.67 × 10³cells L-1) was observed at Station L4, where Detonula pumila was predominant, followed by P. sulcata and C. oculus-iridis. In summer, high-abundance phytoplankton were mainly distributed in the south of inner SGB with the abundance of (0.31–188.80) × 103cells L-1. A peak of the phytoplankton abundance was observed at Station 19 where the dinoflagellates P. gracile and P. triestinum were dominant. In autumn, the phytoplankton were concentrated in southern SGB, where cell abundance decreased toward the north and the inner bay. Maximum cell abundance of phytoplankton was found at Station 5 (9.64 × 10³cells L-1) where the dominant species P. sulcata accounted for 74.05% of total phytoplankton abundance. In winter, the phytoplankton abundance showed 3 patches with the peak level (19.41 × 10³cells L-1) observed at Station 18 where Skeletonema sp. was the dominant species (77.67% of total phytoplankton abundance).

Fig.4 Horizontal distribution of phytoplankton cell abundances (× 103cells L-1) in surface water of the Sanggou, Ailian, and Lidao bays.
The distribution of diatom and dinoflagellate cell abundance in surface water of the bays during the four seasons is shown in Fig.5. The high-abundance diatoms were concentrated in middle LDB in spring and moved southward in summer, toward southern LDB, outer ALB, and northern SGB. In autumn, the diatoms continued moving southward and were concentrated in the south of outer SGB. In winter, the diatoms were distributed in 3 patches in inner SGB, outer SGB, and middle ALB, respectively. High-abundance dinoflagellates were concentrated in the LDB in spring and autumn, the south of inner SGB in summer, and northern SGB and the south of middle SGB in winter.
In spring, the diatom cell abundance peaked at Station L4 (76.67 × 10³cells L-1) where Detonula pumila was dominant. The corresponding dinoflagellate cell abundance averaged 0.02 ×10³cells L-1and peaked at Station L10. In summer, the diatoms were concentrated from southern LDB to northern SGB (3.28 × 10³cells L-1on average) with the peak cell abundance at Station L8 (10.27 × 10³cells L-1). At this station, the dinoflagellate abundance was the highest among seasons (average 6.11 × 10³cells L-1), being 52.27% of the phytoplankton cell abundance. At Station 19, the phytoplankton cell abundance reached the peak value and Prorocentrum was the major contributor. The distribution of dinoflagellate cell abundance was similar to that of total phytoplankton in surface water. In autumn, the diatom cell abundance wasthe lowest among four seasons, averaging 2.19 × 10³cells L-1. The diatoms were concentrated in the south of outer SGB while the dinoflagellates were concentrated in the south of middle LDB. In winter, the distribution of diatom cell was relatively even in the surveyed area. The diatom cell abundance peaked at Station 18 (19.41 × 10³cells L-1), whereas the corresponding dinoflagellate cell abundance was generally low and averaged 0.004 × 10³cells L-1, that is, the lowest among the four seasons. In general, except in summer, diatoms had the absolute ad-vantage of growth and were characterized by the distribution of phytoplankton cell abundance in surface water.
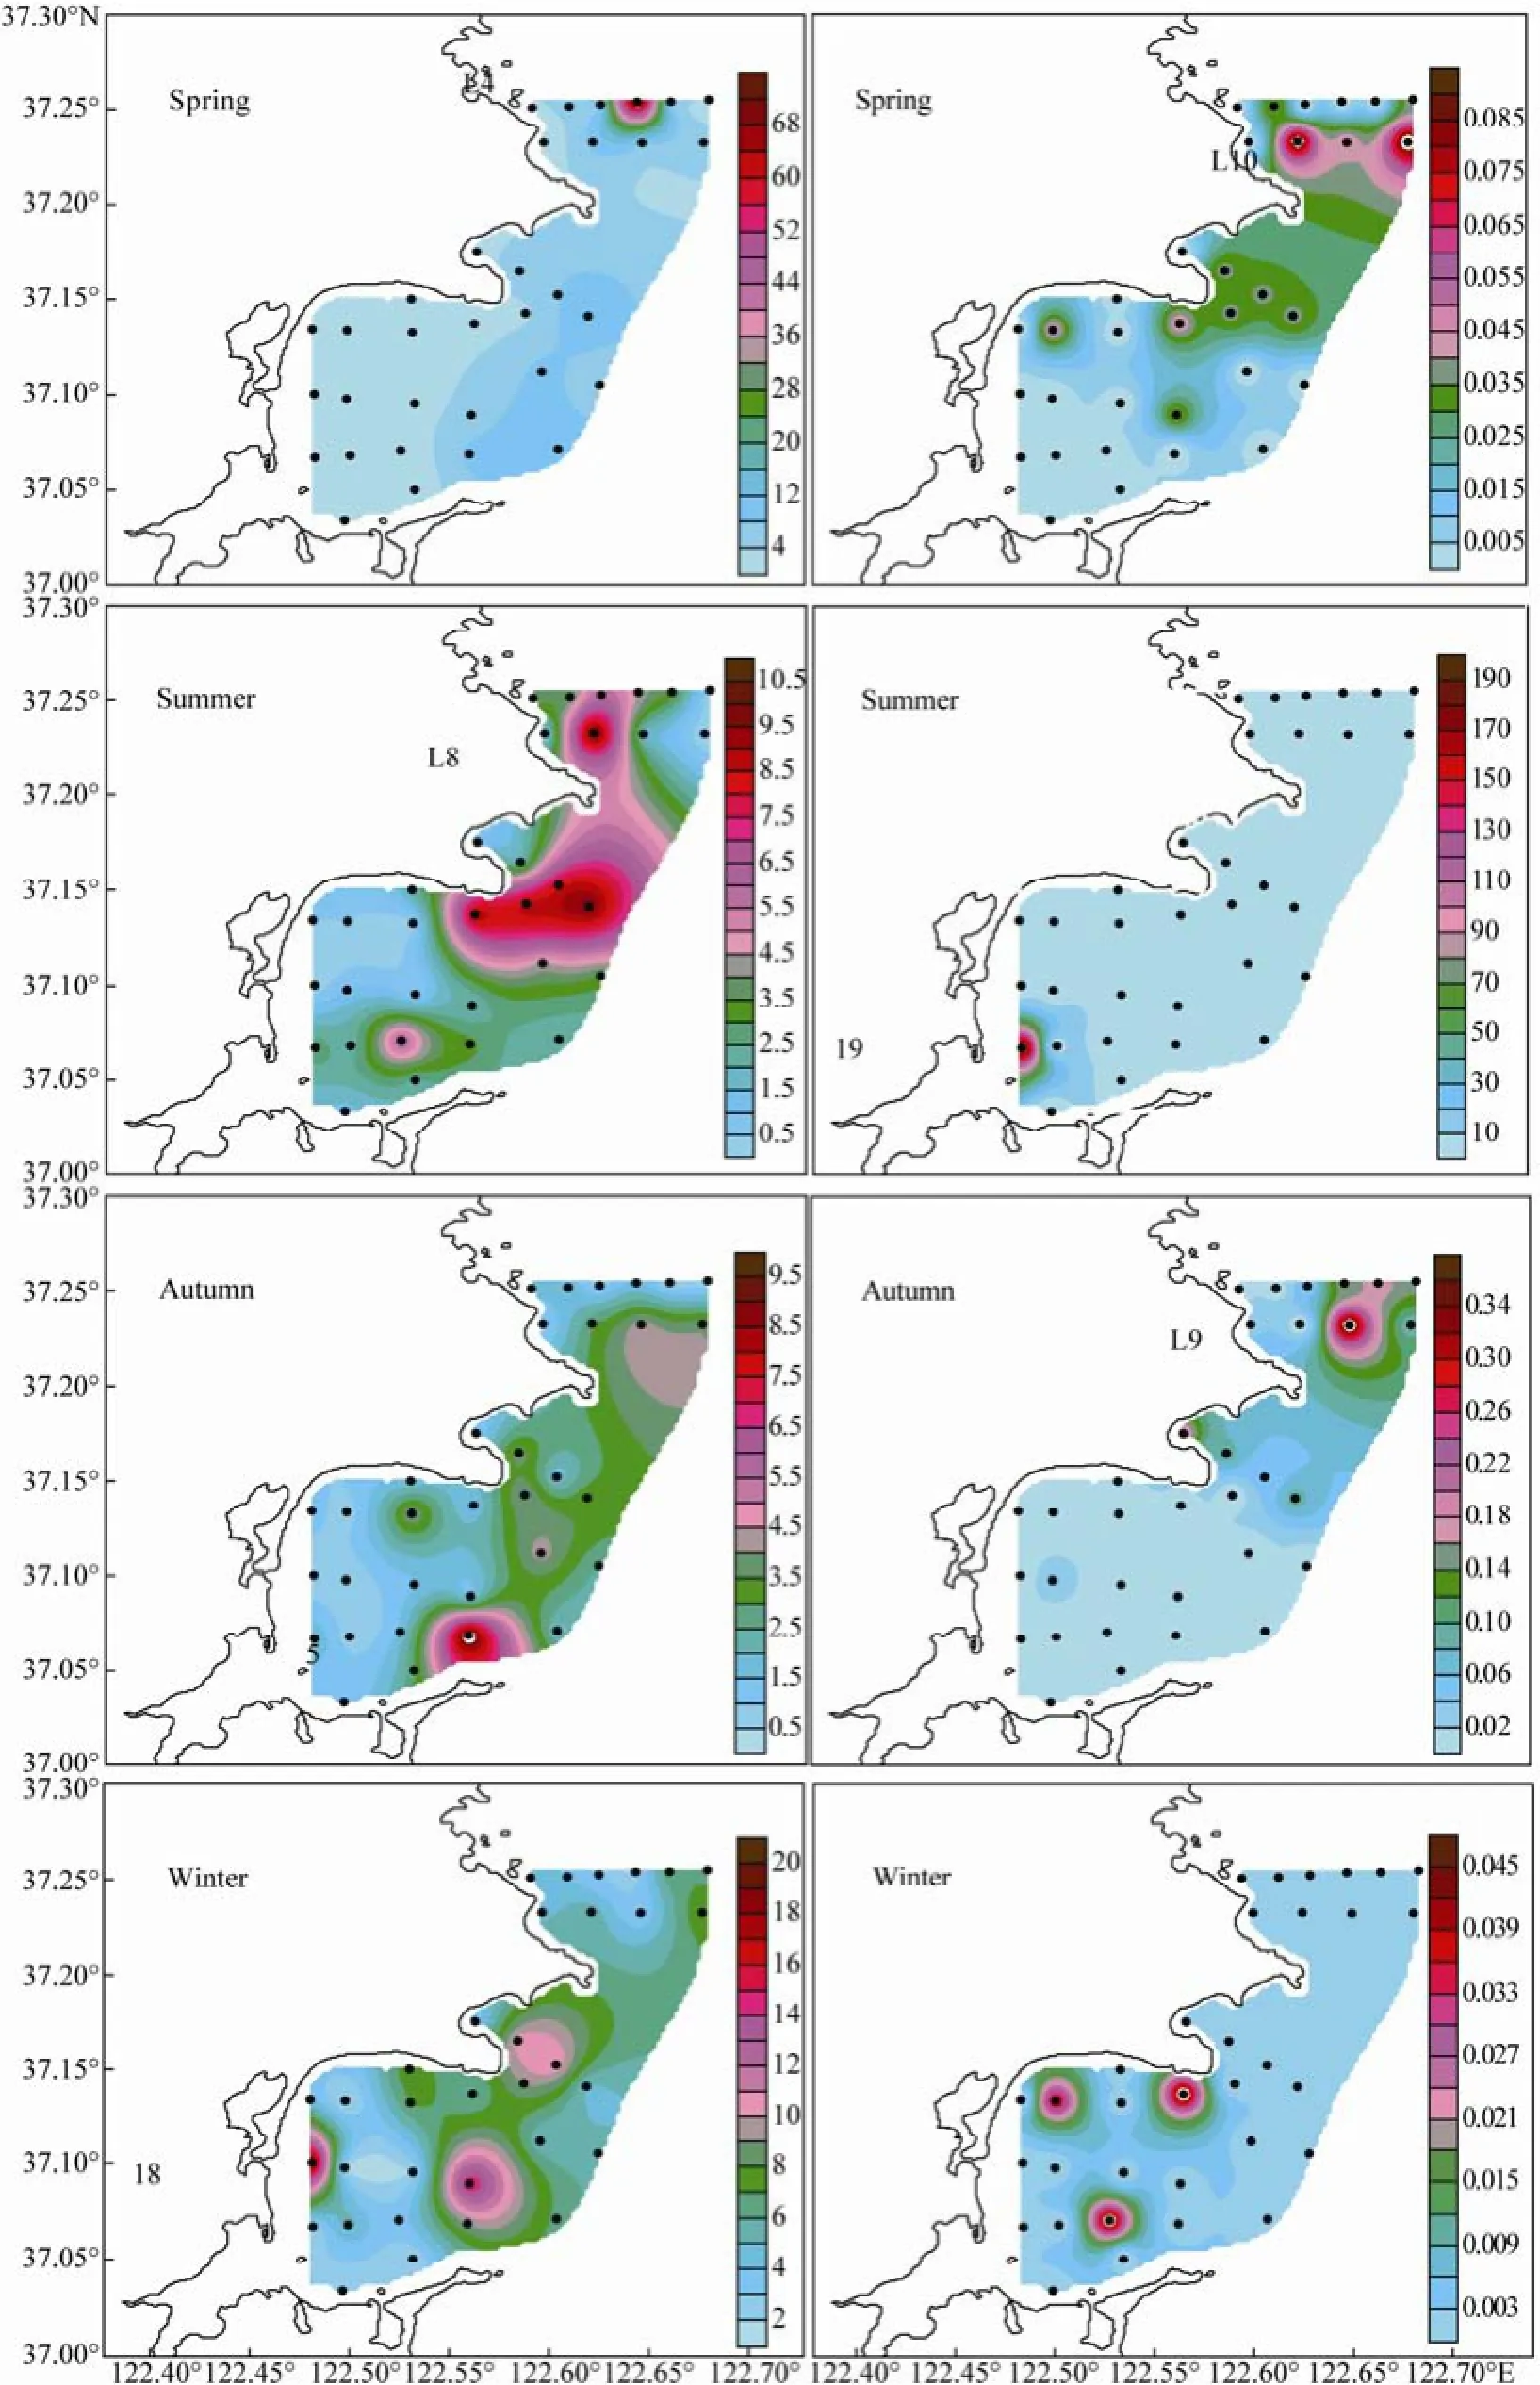
Fig.5 Horizontal distribution of diatom (Left) and dinoflagellate (Right) cell abundances (× 103cells L-1) in surface water of the Sanggou, Ailian, and Lidao bays.
3.4.2 Bottom water (10 m)
In spring, the phytoplankton in bottom water were concentrated in outer ALB and sparsely distributed in coastal waters. The phytoplankton abundance peaked at Station A3 where P. sulcata was predominant (83.92% of phytoplankton cell abundance). In summer, the abundance distribution of phytoplankton in bottom water was similar to that in surface water, that is, being within the rang of (0.58–188.80) × 103cells L-1(average 9.64 × 10³cells L-1) and mainly concentrated in the south of inner SGB. In autumn, the phytoplankton were concentrated around the center of LDB and ALB, with the maximum abundance detected at Station L3 (6.58 × 10³cells L-1) where P. sulcata and C. oculus-iridis were the dominant species. In winter, the phytoplankton cell abundance ranged (1.63–19.41) × 103cells L-1(average 6.00 × 10³cells L-1), with the maximum level detected at Station 18 (Fig.6). At this station, Skeletonema sp. was the dominant species, consistent with the case of surface water.
The horizontal distribution of diatom and dinoflagellate cell abundance in bottom water of the bays is shown in Fig.7. The distribution of diatom abundance in bottom water was different from that in surface water, especially in spring. The diatom abundance was higher in the outer bay than in the inner bay in spring. The diatoms were concentrated in the north of offshore SGB in summer, outer LDB and ALB in autumn, and inner SGB, outer SGB and outer ALB in winter. The distribution of dinoflagellate abundance in bottom water was similar to that in surface water in summer and winter. The dinoflagellates were concentrated mostly in the outer LDB in spring and autumn.
In spring, the cell abundance of diatoms peaked at Station A3 where P. sulcata followed by C. oculus-iridis were the predominant species. The corresponding cell abundance of dinoflagellates peaked at Station L9 (0.01 × 10³cells L-1), being lower than that in surface water. In summer, the diatom cell abundance was 3.53 × 10³cells L-1on average, with the maximum level (13.67 × 10³cells L-1) observed at Station 2 where P. sulcata and C. oculus-iridis were the predominant diatoms. The dinoflagellate cell abundance peaked at Station 19, consistent with the case of surface water. In autumn, the diatom cell abundance averaged 2.36 × 10³cells L-1, being lower than that in surface water, whereas the dinoflagellate cell abundance averaged 0.04 × 10³cells L-1, being higher than that in spring and winter. The diatom and dinoflagellate cell abundances peaked at stations L3 and L6, respectively. In winter, the diatom and dinoflagellate cell abundances showed similar distribution patterns in bottom and surface water layers. On the whole, the phytoplankton were dominated by dinoflagellates in summer and diatoms in other seasons.

Fig.6 Horizontal distribution of phytoplankton cell abundance (× 103cells L-1) in bottom water of the Sanggou, Ailian, and Lidao bays.
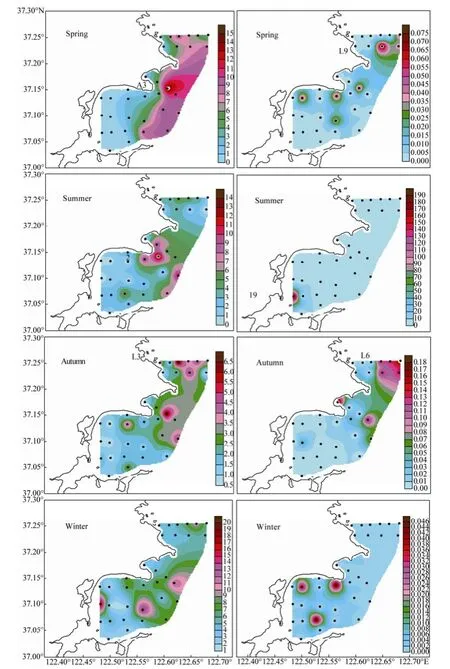
Fig.7 Horizontal distribution of diatom (Left) and dinoflagellate cell abundances (Right) (× 103cells L-1) in bottom water of the Sanggou, Ailian, and Lidao bays.
3.5 S-W Diversity Index and Pielou’s Evenness Index
The diversity indices of phytoplankton in four seasons ranged from 1.17 to 1.78 with an average of 1.41 (autumn > summer > spring > winter, seasonal average). The evenness indices of phytoplankton ranged from 0.45 to 0.65 with an average of 0.54 (autumn > spring > summer > winter, seasonal average). The S-W diversity index of phytoplankton community was evenly distributed in spring and was relatively lower in ALB and LDB than in SGB insummer and winter, whereas the evenness index of phytoplankton community was roughly lower in ALB and LDB than in SGB in the four seasons. Overall, the relatively higher S-W diversity index of phytoplankton appeared in the north of inner SGB, decreasing toward the outer bay. Pielou’s evenness index of phytoplankton was higher in coastal waters of the bay than in the offshore area (Fig.8). These trends suggested that phytoplankton were evenly distributed in high diversity in the surveyed area. Comparisons of the distribution between cell abundance and community diversity indices of phytoplankton in surface water showed that the high phytoplankton diversity index was associated with medium-level phytoplankton cell abundance.
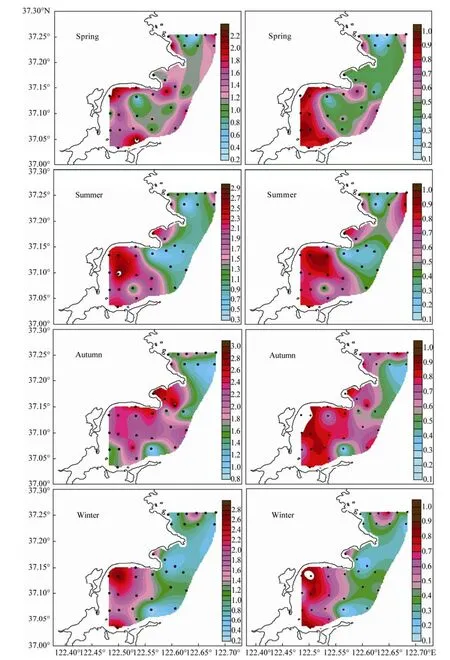
Fig.8 The distribution of Shannon-Wiener diversity index (Left) and Pielou’s evenness index (Right) of phytoplankton in surface water of the Sanggou, Ailian, and Lidao bays.
3.6 CCA
The relative positions of dominant phytoplankton species in the CCA bioplots (Fig.9) reflect the dependence of the species on environmental factors. Due to different ecological adaptabilities of phytoplankton species, the more similar species are on taxonomy, the closer their positions are in the diagram. In spring, the abundance of P. sulcata, C. oculus-iridis, T. rotula, and T. pacifica were positively correlated with phosphate, nitrite, nitrate, and ammonium levels. The abundance of Detonula pumila was most related to silicate level and depth. These results indicate that nutrient level was an important factor that impacted the phytoplankton community structure in spring. There were 2 categories of the correlation between the cell abundance of phytoplankton species and the levels of environmental variables in summer. The cell abundance of P. gracile and P. triestinum of dinoflagellate were positively correlated with nitrate level, pH, temperature, DO level, and silicate level and negatively correlated with salinity. The cell abundance of diatoms such as P. sulcata, Donkinia recta, and C. oculus-iridis was correlated with phosphate level, salinity, and water depth. The cell abundance of Nitzschia sp. correlated with nitrite and ammonium levels. In autumn, there were positive correlations between P. sulcata cell abundance and water depth, temperature, salinity, phosphate level, whereas the abundance of Donkinia recta, Nitzschia sp., Thalassiosira sp. and Pleurosigma angulatum were correlated with nitrite and nitrate levels, pH and DO level. In winter, P. sulcata and C. oculus-iridis cell abundance were positively correlated with temperature, salinity and phosphate level; Nitzschia sp. cell abundance was correlated with pH and DO level.
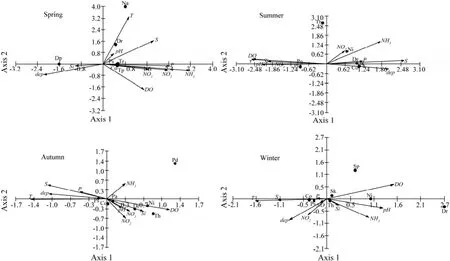
Fig.9 Biplots of phytoplankton species and environmental factors in the Sanggou, Ailian, and Lidao bays in four seasons. T: temperature; S: salinity; DO: dissolved oxygen; dep: depth; NO2: nitrite; NO3: nitrate; NH3: ammonium; P: phosphate; and Si: silicate. Ps: Paralia sulcata; Co: Coscinodiscus oculus-iridis; Tp: Thalassiosira pacifica; Dp: Detonula pumila; Na: Navicula sp.; Dr: Donkinia recta; Tr: Thalassiosira rotula; Pg: Prorocentrum gracile; Pt: Prorocentrum triestinum; Th: Thalassiosira sp.; Ni: Nitzschia sp.; Pa: Pleurosigma angulatum; Pd: Pseudonitzschia delicatissima; Sp: Stephanopyxis palmeriana; and Sk: Skeletonema sp.
4 Discussion
4.1 Comparison with Historical Data
The results from this study showed that diatoms, followed by dinoflagellates, were constantly dominant in the phytoplankton community in the SGB. Compared with previous data, the species composition of phytoplankton remained widespread and mainly in the temperate nearshore zone, while the number of phytoplankton species gradually declined in the past 30 years (Table 3). Human activities such as varieties of aquaculture model and their quantity expanding might have changed the marine ecological environment and further caused seasonal variations in the phytoplankton community structure.
During early breeding in the SGB, the cell abundance of phytoplankton peaked in July (summer) and October (autumn) (Mao et al., 1988). There were 2 peaks in late spring and winter in the 1990s (Fang et al., 1996). In the present survey, the phytoplankton cell abundance peaked in summer, consistent with the findings of Mao et al.(1988). Previously, Chaetoceros, Coscinodiscu, Nitzschia of Bacillariophyta and Ceratium of Dinophyta were found predominant in the SGB (Mu et al., 2009), while in the present study, Paralia, Coscinodiscus, Thalassiosira of Bacillariophyta and Prorocentrum of Dinophyta were the predominant phytoplankton species.
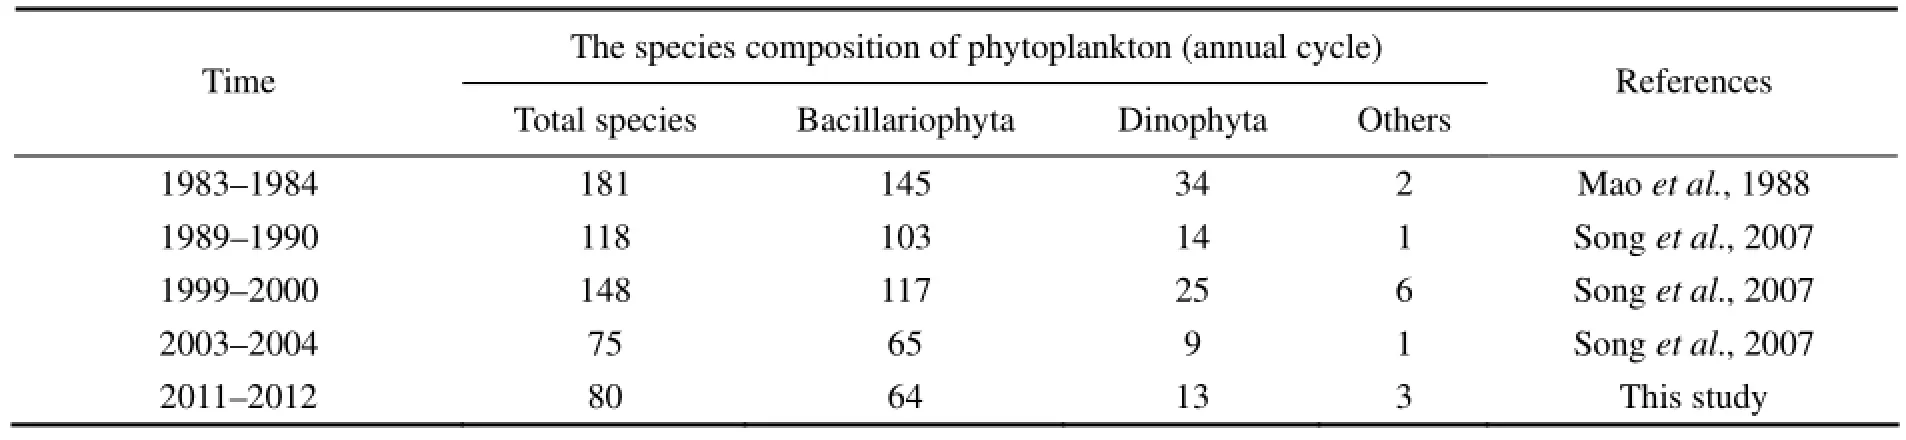
Table 3 Changes of the species composition of phytoplankton in the Sanggou, Ailian, and Lidao bays (1983–2012)
4.2 Seasonal Changes in Phytoplankton Cell Abundance and Species Composition
The phytoplankton community in the survey area was mainly composed of diatoms and dinoflagellates, consistent with previous findings (Mao et al., 1988; Mu et al., 2009; Song et al., 2007). At individual sites, there were a small number of Chrysophyta (Distephanus speculum). The diatoms such as P. sulcata, C. oculus-iridis and Thalassiosira sp. were dominant in terms of species number and cell abundance. Only in summer dinoflagellates had an explosive growth at a few stations, especially Station 19. P. gracile and P. triestinum were the major species with the maximum cell abundance 100.3 × 10³cells L-1and 78.3 × 10³cells L-1, respectively. Prorocentrum was the major genus of red tide in the world (Huang et al., 1997). Although it did not reach the threshold number of red tide, the increase in Prorocentrum cell abundance in summer indicated that the rapid growth and reproduction of dinoflagellates were likely to cause the outbreak of red tide.
Over the four seasons, the highest cell abundance of phytoplankton was detected in summer, followed by spring and winter; the lowest cell abundance of phytoplankton was found in autumn (Table 4). The seasonal variations in the phytoplankton abundance could be explained by several reasons. In spring (April), the repression of phytoplankton growth and reproduction from the competition for nutrients was weak and there were nutriments accumulated in winter. Together the suitable environmental conditions allowed the cell abundance of phytoplankton to reach a second peak. In summer (August), the harvest of kelp reduced the absorption of nutrients and the decomposing of residual kelp added substantial nutrients to the water column (Liu et al., 2003; Shi et al., 2010a), plus that the light and temperature were suitable for phytoplankton growth (Shi et al., 2010b). These conditions might promote phytoplankton blooms. In autumn (October), shellfish grew rapidly and consumed a large amount of phytoplankton while the phytoplankton growth was limited by light. Thus, the phytoplankton cell abundance declined drastically in this period (Shi et al., 2010b). Coming to winter (January), the harvest of shellfish weakened the pressure of feeding on phytoplankton whose cell abundance slightly recovered.
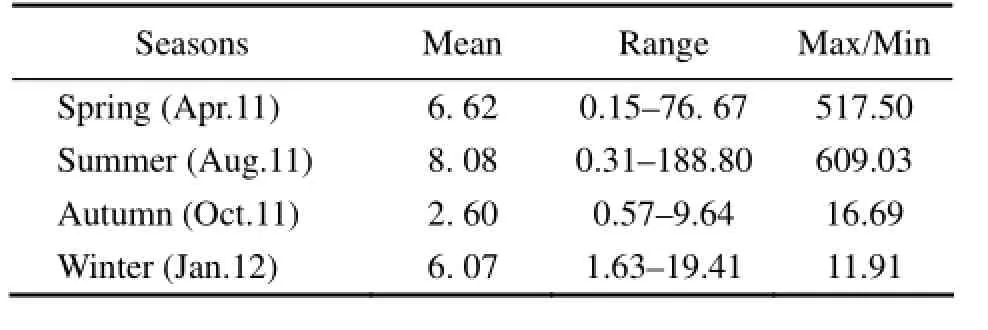
Table 4 Mean values and ranges of phytoplankton cell abundance (× 103cellsL-1) at the stations in the Sanggou, Ailian, and Lidao bays during the four seasons
Analyses for the different stations with their both surface and bottom water showed that (Table 4): in winter, the changes in the phytoplankton cell abundance among different sites were the least with the highest cell abundance being 11.91-fold that of the lowest value. In spring and summer, the maximum-to-minimum ratio of cell abundance was up to 517.50–609.03, indicating uneven distribution of phytoplankton. Farming activities including seeding and harvesting of aquaculture species could have changed the physicochemical environment of the waters, and in different farming areas the aquaculture species limited the growth and reproduction of phytoplankton to different degrees. These could be the main causes for the uneven distribution of phytoplankton in the study area in spring and summer. Additionally, highdensity breeding might have impacted the flow of sea water and impacted the transport of biogenic elements, resulting in local deficiency of water (Shi et al., 2010b) and further affecting the distribution of phytoplankton.
4.3 Seasonal Changes in Phytoplankton Community Diversity
The variations in phytoplankton community structure to some extent reflect the changes in water conditions, and thus can be used to evaluate the status of the aquatic environment (Mu et al., 2009). The S-W diversity index indicates the complexity of the community structure; the evenness index reflects the uniformity degree of the distribution of species as well as the maturity and stability of the community (Sun and Liu, 2004). Although the cell abundance of phytoplankton peaked in summer, their diversity was not high at all because the predominant species Prorocentrum accounted for 52.27% of the total phytoplankton cell abundance. In autumn, the cell abundance was the lowest while the diversity index was thehighest, verifying that the low phytoplankton cell abundance was associated with high species diversity. The S-W diversity index <1 and the evenness index <0.3 were used as the standard of poor diversity (Ma et al., 2002). According to the above standard, the phytoplankton community structure in the surveyed area was in a relatively stable state, as reflected by the S-W diversity index >1 and the evenness index >0.3.
Generally, anthropogenic activities in nearshore areas would decrease the phytoplankton diversity. However, in the present survey, the coastal area as more affected by human activities had higher phytoplankton diversity than nearshore area, possibly due to the effect of the specific aquaculture species. Shellfish’s non-selectively filtering of phytoplankton made each species in a dynamic equilibrium and no one species had absolute advantage. Therefore, the inner bay associated with shellfish breeding showed the higher diversity of phytoplankton (Shi et al., 2010a). In kelp farming area at the bay mouth, low nutrient levels related to kelp’s consumption limited the growth and reproduction of phytoplankton during most of the year. Such species at a competitive advantage occupied the entire phytoplankton community, leading to the decrease in the phytoplankton biodiversity.
4.4 Relationship Between Phytoplankton and Environmental Factors
The results of CCA showed that there were discrepancies in the correlation between the cell abundance of dominant phytoplankton species and the levels of specific environment factors over the four seasons. The dominant species of diatom, such as P. sulcata and C. oculus-iridis, were mainly restricted by phosphate level. P. Sulcata, as a benthic species, was well correlated with salinity. The dominant species of dinoflagellates that appeared only in summer were associated with nitrate level, silicate level and pH value. In summer, the dinoflagellate cell abundance greatly increased with the nutrient-competitive advantage at lower concentrations of phosphate and silicate. In winter, the low temperature was not suitable for the growth of phytoplankton. Thus, temperature was the main factor that limited phytoplankton growth in this season.
During the investigation period, summer was favorable for explosive growth of Prorocentrum. This is understandable because water temperature and the salinity in the surveyed area were 18.1–24.2℃ and 26.57–31.43, respectively, both being in the ranges of optimal growth conditions (Zhang and Liu, 2007). The low salinity in summer was more conducive to reproduction of phytoplankton because the growth energy was relatively less under such condition (Chen et al., 2005; Chen et al., 2006; Zhang and Liu, 2007). The total nutrient level was the lowest in summer when Prorocentrum was more competitive in the low-nutrient environment. The sufficient irradiance, suitable temperature, and low salinity and nutrient levels were favorable for explosive growth of dinoflagellates, which increased the possibility of red tide outbreaks. Once the red tide breaks out, local fisheries and aquaculture would be threatened, and even serious environmental problems and economic losses would be caused. Environmental monitoring should be ready for preventing the occurrence of red tide during the summer period.
5 Conclusions
Our preliminary investigation of phytoplankton community structure showed that diatoms and dinoflagellates were the major groups of phytoplankton in the SGB and the adjacent ALB and LDB. The diatom species P. sulcata and C. oculus-iridis were common and dominant over the four seasons, whereas the dinoflagellate Prorocentrum dominated the phytoplankton community in summer only. Compared to previous data (1983–1984), the present study employed different sampling strategy and microscopic examination methods. Still, a similar decreasing trend was observed in the number of phytoplankton species in the SGB area. Results of the CCA suggested that the abundance of predominant species P. sulcata and C. oculus-iridis were mainly limited by phosphate level in water, while the warm temperature and low salinity were primarily responsible for the dinoflagellate bloom in summer. More recently, a brown-watered picoplankton has been widely spreading and thriving in the SGB, which could heavily affect the adjacent marine ecosystem. Further monitoring and research are needed for investigating the implication of this picoplankton that will undoubtedly be coupled with the mariculture and trigger new marine issues.
制定智慧交通管理系统后台系统的数据结构、数据通讯协议、数据查询接口等标准和规范,提高智慧交通管理系统的开放性和兼容性.
Acknowledgements
This research was supported by the National Program on Key Basic Research Project of China (Grant Nos. 2011CB409804 and 2015CB954002), Program for New Century Excellent Talents in University (NCET-12-1065) and the National Natural Science Foundation of China (Grant No.41176136) to J. Sun. The authors thank Dr. Y. Yu (Institute of Oceanology, Chinese Academy of Sciences) for sampling assistance in the cruises.
Chen, B. Z., Wang, Z. L., Zhu, M. Y., and Li, R. X., 2005. Effects of temperature and salinity on growth of Prorocentrum dentatum and comparisons between growths of Prorocentrum dentatum and Skeletonema costatum. Advances in Marine Science, 23 (1): 60-64.
Chen, H. L., Lv, S. H., Zhang, C. L., and Zhu, D. D., 2006. A Survey on the red tide of Prorocentrum doghaiense in East China Sea, 2004. Ecologic Science, 25 (3): 226-230.
Cheng, J. S., 2004. The Ecological Environment and Biological Community in Inshore Waters of Huanghai and Bohai Seas. Press of Ocean University of China, Qingdao, 127-162.
Fang, J. G., Kuang, S. H., Sun, H. L., Sun, Y., Zhou, S. L., Song, Y. L., Cui, Y., Zhao, J., Yang, Q. F., Li, F., Zhang, A. J., Wang, X. Z., and Tang, T. Y., 1996. Study on the carrying capacity ofSanggou Bay for the culture of scallop chlamys. Marine Fisheries Reseach, 17 (2): 18-31.
Grassholf, K., Ehrhardt, M., and Kremling, K., 1983. Methods of Seawater Analysis. 2nd edition, Chemie Weinheim, 1-419.
Huang, X. H., Shi, D. M., and Zhang, J. P., 1997. Study on nitrogen meiabolism of Prorocentrum micans with special referece to the occurrence of red tide. Oceanologia et Limnologia Sinica, 289 (1): 33-38.
Isamu, Y., 1991. Illustrations of the Marine Plankton of Japan. 3rdedition. Hoikushapublishing, Tokyo, 1-158.
Jaccard, P., 1908. Nouvelles recherches sur la distribution florale. Bulletin de la Société Vaudense des Sciences Naturelles, 44: 223-270.
Jin, D. X., 1965. The introduction of nanoplankton. Journal of Fishery of Fujian, 1-8.
Jin, D. X., Chen, J. H., and Huang, K. G., 1965. Chinese Marine Planktonic Diatoms. Shanghai Science Press, Shanghai, 1-230.
Kang, Y. D., 1986. The ecological characteristics of phytoplankton and the relationship with the fishery in Yellow sea. Marine Fisheries Research, 7: 103-107.
Liu, H., Fang, J. G., Dong, S. L., Liang, X. M., Jiang, W. W., Wang, L. C., and Lian, Y., 2003. Study on phytoplankton in raft-culture areas of Laizhou Bay and Sangou Bay II. Marine Fisheries Research, 24 (3): 20-28.
Ma, J. X., Zheng, Z., Li, Y. P., Xing, H. Y., and Liu, Y. H., 2002. The distribution characteristics of phytoplankton in Laizhou Bay. Transaction of Oceanology and Limnology, 4: 64-67.
Mao, X. H., Zhang, W. X., and Zhang, J. Z., 1988. Comprehensive Investigation of Environment for Propagation and Multiplication in Sanggou Bay. Qingdao Press, Qingdao, 8-46, 113-148.
Mu, J. D., Dong, W., and Chen, B. J., 2009. Ecological characteristics of phytoplankton in Sanggou Bay. Progress in Fishery Sciences, 30 (3): 91-96.
Pielou, E. C., 1984. The Interpretation of Ecological Data. John Wiley & Sons, New York, 1-230.
Ren, Y., C., Wang, F., Dong, S., L., and Liu, F., 2010. Seasonal characteristics of primary production of sea cucumber (Apostichopus japonicus) culture ponds in Jinghai Bay, Rongcheng. Periodical of Ocean University of China, 40 (3): 24-28.
Shannon, C. E., 1951. A mathematical theory of communication. Bell System Technical Journal, 27: 379-423.
Shen, G. Y., and Shi, B. Z., 2002. Marine Ecology. 2nd edition. Science Press, Beijing, 191-192.
Shi, J., Wei, H., Zhao, L., Fang, J. G., and Zhang, J. H., 2010a. Study on ecosystem model of multi-species culture in Sanggou Bay: І Estblishment of the culture ecosystem model and sensitivity analyses of the parameters. Progress in Fishery Sciences, 31 (4): 26-35.
Shi, J., Wei, H., Zhao, L., Fang, J. G., and Zhang, J. H., 2010b. Study on ecosystem model of multi-species culture in Sanggou Bay: II Simulation of ecosystem and the circulation of nutrient. Progress in Fishery Sciences, 31 (4): 36-42.
Song, H. J., Li, R. X., and Wang, Z. L., 2007. Interannual variations in phytoplankton diversity in the Sanggou Bay. Advances in Marine Science, 25 (3): 332-339.
Song, Y. L., and Cui, Y., 1996. The analysis of nutritional status and its affecting factors in cultured areas of Sanggou Bay. Marine Fisheries Research, 17 (2): 41-51.
Sun, J., 2011. Marine phytoplankton and biological carbon sink. Acta Ecologica Sinica, 31 (18): 5372-5378.
Sun, J., Li, X., and Tian, W., 2011. Summer phytoplankton community in the Beibu Gulf. Transactions of Oceanology and Limnology, 3: 1-7.
Sun, J., Liu, D. Y., and Qian, S. B., 2002. A quantative research and analysis method for marine phytoplankton: An introduction to Utermöhl method and its modification. Journal of Oceanography of Huanghai & Bohai Seas, 20 (2): 105-112.
Sun, J., Liu, D. Y., and Feng, S. Z., 2003a. Preliminary study on marine phytoplankton sampling and analysis strategy for ecosystem dynamic research in coastal waters. Oceanologia et Limnologia Sinica, 34 (2): 140-148.
Sun, J., Liu, D. Y., Ning, X. R., and Liu, C. G., 2003b. Phytoplankton in the Prydz Bay and the adjacent Indian sector of the Southern Ocean during the austral summer 2001/2002. Oceanologia et Limnologia Sinica, 34 (5): 519-532.
Sun, J., and Liu, D. Y., 2004. The application of diversity indices in marine phytoplankton studies. Acta Oceanologica Sinica, 26 (1): 62-75.
Sun, Y., and Zhao, J., 1998. Water environmental characteristics in cultured areas of Sanggou Bay. Journal of Fishery Sciences of China, 5 (3): 69-75.
Ter Braak, C. J. F., 1986. Canonical correspondence analysis: A new eigenvector technique for multivariate direct gradient analysis. Ecology, 67 (5): 1167-1179.
Wan, L., 2012. Effect of shellfish farming on nutrient salts of seawater in Sanggou Bay in spring. Environmental Science and Management, 37 (6): 62-66.
Zhang, J. H., Wang, W., Han, T. T., Liu, D. H., Fang, J. G., Jiang, Z. J., Liu, X. J., Zhang, X. J., and Lian, Y., 2012. The distributions of dissolved nutrients in spring of Sangou Bay and potential reason of outbreak of red tide. Journal of Fisheries of China, 36 (1): 132-139.
Zhang, L. H., Zhang, X. L., Li, R. X., Wang, Z. L., Li, Y., Wang, L. C., Lian, L., and Liu, Y., 2005. Impact of scallop culture on dinoflagellate abundance in Sanggou Bay. Advances in Marine Science, 23 (3): 342-346.
Zhang, X. F., and Liu, Y. J., 2007. Advances in the biological study of dinoflagellate Prorocentrum donghaiense Lu. Ecology and Environment, 16 (3): 1053-1057.
Zhu, M. Y., Zhang, X. L., Li, R. X., and Chen, S., 2000. Impacts of shellfish culture on the coastal ecosystem. Journal of Ocean University of Qingdao, 30 (2): 53-57.
(Edited by Qiu Yantao)
(Received March 1, 2013; revised April 24, 2013; accepted August 29, 2014)
© Ocean University of China, Science Press and Spring-Verlag Berlin Heidelberg 2014
* Corresponding author. Tel: 0086-22-60601116
E-mail: phytoplankton@163.com
猜你喜欢
中国交通信息化(2021年12期)2021-02-12
装备制造技术(2020年12期)2020-05-22
广东技术师范大学学报(2016年5期)2016-08-22
中国市场(2016年45期)2016-05-17
中国市场(2016年12期)2016-05-17
船舶标准化工程师(2015年5期)2015-12-03
河北城市研究(2015年3期)2015-08-23
中国工程咨询(2015年3期)2015-02-14
电测与仪表(2014年23期)2014-04-04
上海理工大学学报(社会科学版)(2014年2期)2014-02-28
 Journal of Ocean University of China2014年6期
- Journal of Ocean University of China的其它文章
- The Formation of Wind Curl in the Marine Atmosphere Boundary Layer over the East China Sea Kuroshio in Spring
- Wind Wave Characteristics and Engineering Environment of the South China Sea
- Prediction of the Mooring Force of a 2-D Floating Oil Storage Tank
- An Experimental Study on the Wave-Induced Pore Water Pressure Change and Relative Influencing Factors in the Silty Seabed
- Fe-Si-Mn-Oxyhydroxide Encrustations on Basalts at East Pacific Rise near 13˚N: An SEM – EDS Study
- Seasonal Changes in Phytoplankton Biomass and Dominant Species in the Changjiang River Estuary and Adjacent Seas: General Trends Based on Field Survey Data 1959 - 2009