
Deepwater gas kick simulation with consideration of the gas hydrate phase transition*
2014-06-01 12:30WANGZhiyuan王志远SUNBaojiang孙宝江
水动力学研究与进展 B辑 2014年1期
关键词:志远
WANG Zhi-yuan (王志远), SUN Bao-jiang (孙宝江)
School of Petroleum Engineering, China University of Petroleum (East China), Qingdao 266580, China, E-mail: wangzy1209@126.com
Deepwater gas kick simulation with consideration of the gas hydrate phase transition*
WANG Zhi-yuan (王志远), SUN Bao-jiang (孙宝江)
School of Petroleum Engineering, China University of Petroleum (East China), Qingdao 266580, China, E-mail: wangzy1209@126.com
(Received January 8, 2013, Revised March 26, 2013)
The hydrate phase transition presents new problems and challenges for the deepwater well control in the drilling processes. A simulation model is built for deepwater gas kicks with consideration of the hydrate phase transition. The model is based on the multiphase flow governing equations and the hydrate phase transition calculation equations. The influence of the hydrate phase transition on the gas kick hydraulics is investigated through numerical simulations. It is shown that the diameter of the gas bubbles can significantly influence the hydrate phase transition effect. The influence of the hydrate phase transition on the gas kick hydraulics increases with the decrease of the average gas bubble diameter. The hydrate phase transition adds a “hidden” nature for the well kick in deepwater and hinders the early detection of the gas kick. The influence of the hydrate phase transition on the gas kick hydraulics is also studied in the case when the hydrate inhibitor is added to the drilling fluid.
deepwater, gas kick, simulation, gas hydrate, phase transition
Introduction
The hydrocarbon resource in the offshore deepwater environment is one of important energy resources. In the deepwater drilling process, when the hydraulic pressure in the wellbore is below the drilling formation pressure, the formation fluids would flow into the wellbore. When the formation fluid is the vapour phase hydrocarbon, it is termed the gas kick in the industry, which can potentially cause a catastrophic well control event. Furthermore, the gas in the well annulus forms solid hydrates in the interval of low temperature and high pressure. The hydrates travel upward with the carrying fluids (drilling mud) along the well annulus. Once the hydrates are out of the hydrate formation region, they are disassociated into the vapour phase. The hydrate phase transition presents new challenges for deepwater drilling[1]. If the hydrates are not handled properly, we might face the well blowout and offshore pollution problems. The deepwater gas kick simulation is a possible way to determine the multiphase flow behaviour with consideration of the hydrate phase transition.
Nunes et al.[2]established a kick analytical model and iteratively calculated the pressure distribution and the gas-liquid percentages in the well annulus and the choke line at each time step at a constant flow rate. Avelar et al.[3]proposed a set of deepwater kick simulation methods and analyzed the effect of the depth on the well control parameters. Johnny et al.[4]studied the hydrate formation potential and obtained the overcooled pressure of the hydrate formation in the well annulus using an advanced dynamic kick simulator. Wang et al.[5]presented a method for predicting the gas hydrate formation region in the deep-water well annulus. Yapa et al.[6]modelled underwater oil/gas jets and plumes with consideration of the gas hydrate formation and decomposition. Wang and Sun[7]established a deepwater gas kick model and conducted preliminary studies on the influence of the hydrate formation on kick flow parameters.
Although some progresses were made in deepwater gas kick simulations, few previous studies con-sidered the influence of the hydrate phase transition on the gas kick hydraulics, which is a major problem in deepwater drilling and well control. In this study, a simulation model is established for the gas kick in the deepwater well annulus with consideration of the hydrate phase transition. The influences of the hydrate phase transition on the deepwater gas kick hydraulics are analysed using numerical calculations.
1. Gas kick model with the gas hydrate phase transition in well annulus
1.1Multiphase flow governing equations considering the gas hydrate phase transition
Three components in the well annulus are usually considered, including the gas, the drilling fluid and the cuttings, where the mass and momentum conservation equations are used. However, the gases in the well annulus can form hydrate particles when they are transported into low-temperature and high-pressure regions, particularly near the seafloor, in the deepwater well annulus. The hydrate particles are lighter than the drilling fluids and will travel upward with the drilling fluids and the cuttings, and then disassociate after they leave the hydrate formation region. The hydrate phase transitions make the behaviour of the multiphase flow in the deepwater well differ from that in the well onshore or in the shallow water. In this study, we establish an improved annular multiphase flow governing equations by coupling the hydrate phase transition by adding the hydrate mass conservation equation, the hydrate term in the momentum conservation equation and the enthalpy term for the gas hydrate phase transition in the heat conservation equations.
The following assumptions are made when the governing equations are derived.
(1) The seawater temperature field is continuous and the formation temperature field varies linearly with the depth at a constant geothermal gradient from the mudline.
(2) The water-based drilling fluid is used, and no mass transfer occurs between the natural gas and the drilling fluid.
(3) The hydrates in the form of solid particles travel upward with the drilling fluid, neglecting the hydrate attachment on the well annulus or riser wall.
(4) The hydrate particles will not be split into two or more parts during the hydrate formation or disassociation process.
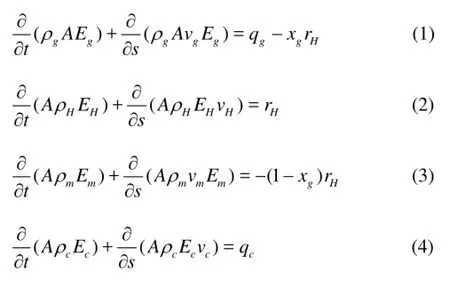
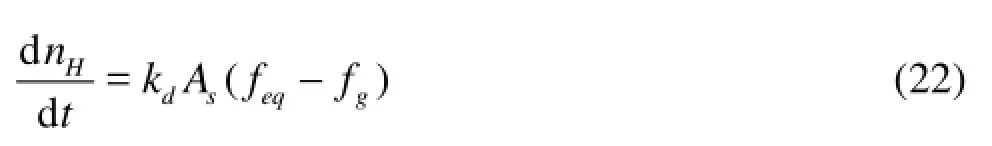
Based on the above assumptions, the annular multiphase flow governing equations with consideration of the hydrate phase transition, for the mass conservation, the momentum conservation, and the heat conservation, are obtained. The mass conservation equations of gases, hydrates, drilling fluids, and cuttings are as follows: whereρg,ρm,ρHandρcare the densities of the gas, the drilling fluids, the hydrates, and the cuttings, respectively,vg,vm,vHandvcare the velocities of the gas, the drilling fluids, the hydrates and the cuttings in the well annulus, respectively,Eg,Em,EHandEcare the volume fraction of the produced gas, the drilling fluids, the hydrates and the cuttings,Ais the annular cross-sectional area,qgis the gas production rate of unit length of formation,xgis the mass fraction of the gas in the hydrate,rHis the hydrate formation/decomposition rate of unit length in the well annulus, with its positive or negative value representing the formation or disassociation of the hydrates. andqcis the cutting production rate per unit length.
Equation (2) is the hydrate mass conservation equation. The final terms on the right-hand side of Eqs.(1) and (3) represent the gas and water mass gain/ loss terms due to the hydrate disassociation/formation, respectively.
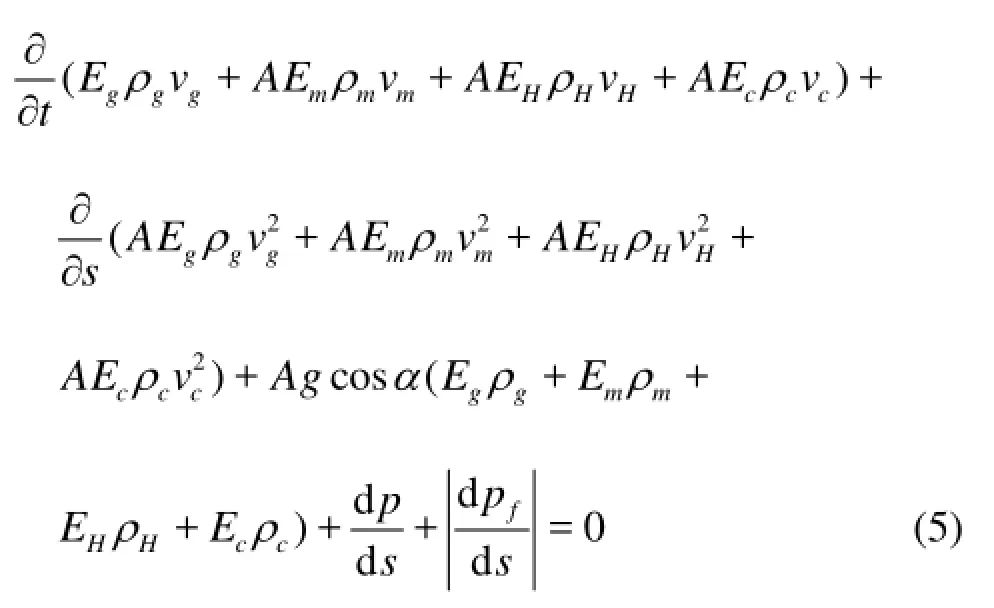
The momentum conversation equations of the gases, the hydrates, the drilling fluids, and the cuttings are as follows whereαrepresents the well deviation angle,pfrepresents the annular friction, andprepresents the annular pressure.
The hydrate phase transition is often accompanied by a heat exchange. The hydrate formation is anexothermic process[8], whereas the hydrate disassociation is an endothermic process[9]. Therefore, the enthalpy term for the gas hydrate phase transition, the third term in the left-hand side of Eq.(6), should be considered in the heat conservation equations. The heat conservation equations in the deepwater well annulus can be expressed as follows

whereρlis the density of the liquid,wg,wlare the mass flow rates of the gas and liquid phases, respectively,Cg,Clare the specific heats of the gas and liquid phases, respectively,Tei,Ta,Ttare the temperatures of the formation, the well annulus and the drill string, respectively, and ΔHHis the enthalpy of the gas hydrate phase transition, which can be calculated using the Clausius-Clapeyron equation.A',B' are the intermediate coefficients. The expression ofB' is

The deepwater well annulus section above the seabed is a riser surrounded by seawater and that below the seabed is surrounded by the formation, and the expression for these two sessions are defined as
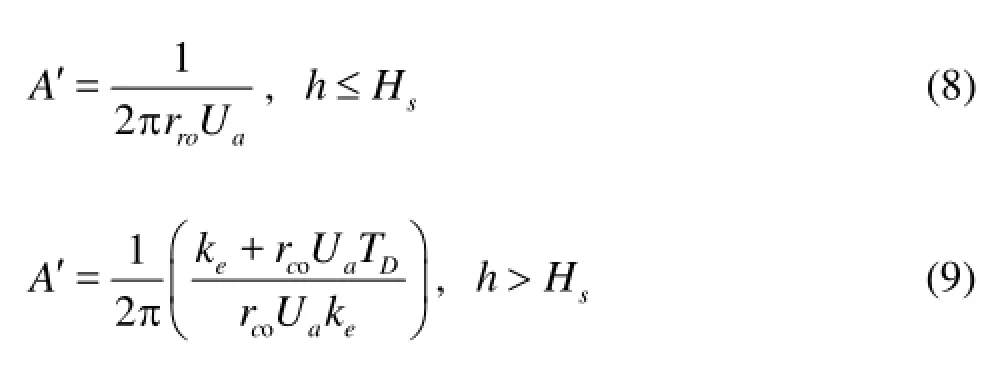
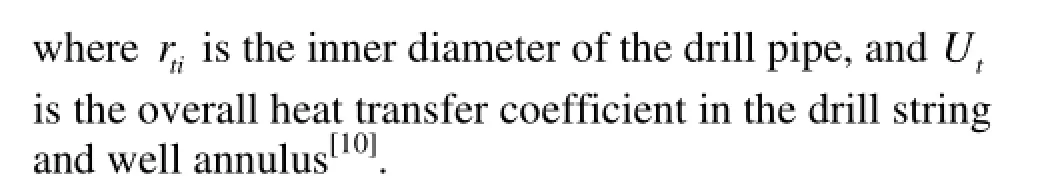
wherekeis the coefficient of heat transfer of the hydrate formation,rcois the casing external diameter,Uais the overall heat transfer coefficient of the annular fluid and the formation, andTDis a function of the transient heat transfer[11],his the well depth,Hsis the water depth.
Because only the drilling fluid flows in the drill string, the temperature field equation can be expressed in a relatively simple manner as follows

wheretArepresents the inner cross-sectional area of the drilling pipe.
1.2Auxiliary equations
Many previous studies considered the auxiliary equations for the multiphase flow in the well annulus, such as the flow pattern transition equations[12], the gas slip velocity equations, the fluid phase behaviour equations, and the flow friction calculation equations. In this study, we focus on the auxiliary equations related to the hydrate phase transition. These equations involve the hydrate phase equilibrium condition, the hydrate formation rate, and the hydrate disassociation rate.
(1) The hydrate phase equilibrium conditions. The first issue is to identify the conditions under which the hydrates form/decompose. In this paper, the hydrate phase equilibrium conditions refer to the temperature and pressure conditions in the well annulus. A chemical potential balance is established among the aqueous phase, the gas phase, and the hydrate lattice system in the crystal structure of the hydrates. The equations for the hydrate phase equilibrium conditions are based on the thermodynamic equilibrium theory[13].

where Δμ0is the difference between chemical potentials in the unoccupied lattice and the pure water in the reference state,Ris the gas constant,T0is the reference temperature,THis the hydrate-formation temperature, ΔH0is the difference between enthalpies in the unoccupied lattice and the pure water, ΔCKis the difference between the heat capacities in the unoccupied lattice and the pure water,pHis the hydrateformation pressure, ΔVis the molar volume differe-nce between the unoccupied lattice and the pure water,fwis the fugacity of water in the solution, Pascal,fwris the fugacity of water in the reference state (TH,pH), Pascal,lis the total number of hydrate species,Miis the ratio of the number of typeicavities to the number of water molecules in the hydrate phase,Lis the total number of gas types,θijis the fraction of thei-type cavities occupied by aj-type gas molecule,xwis the mole fraction of water; andywis the water activity coefficient in the solution.
(2) Calculation of the hydrate formation rate.
Englezos et al.[14]suggested two gas hydrate formation processes. The first process is the diffusion of the natural gas dissolved in the liquid into the hydrateliquid interface. The second process is the structural framework combination between gas and water molecules at the interface. Englezos proposed a method to calculate the hydrate growth rate from the aforementioned processes. The main formulas for the calculation of the hydrate formation rate are as follows:
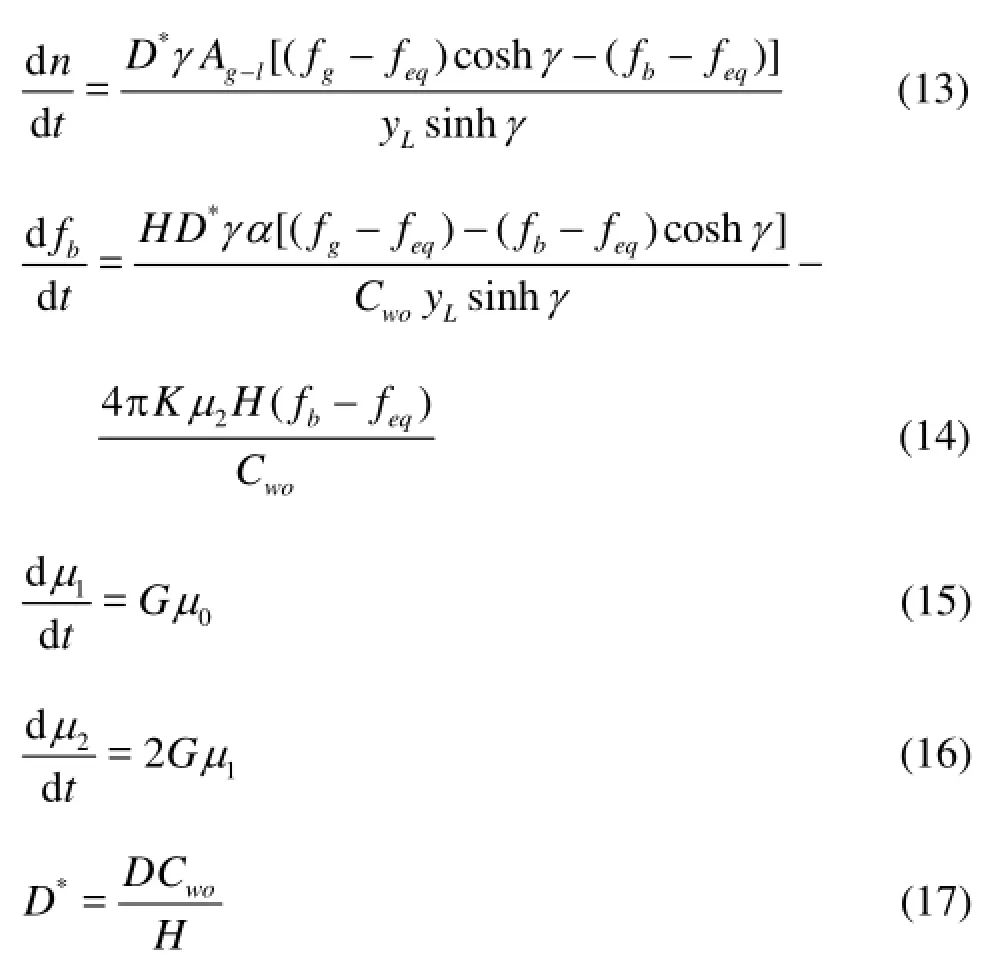
wherenis the hydrate formation rate,μnis thenth moment and the initialnth moment of the crystal distribution,Ag-lis the gas-liquid interface area,ais the gas-liquid interface area per unit liquid volume,Cwois the initial concentration of water molecules,Dis the mass transfer coefficient for gas in the dispersion film,fgis the gas fugacity,fbis the fugacity of the dissolved gas in water,feqis the three-phase equilibrium fugacity,yLis the thickness of the film at the gas-liquid interface,His the Henry’s law constant,γis the Hatta number, andGis an average growth rate for the computation of the first and second moments,Kis the combined rate parameter of hydrate formation.
The hydrate formation region is usually near the seabed in the deepwater well annulus. The diameter of the gas bubbles is usually small because of the high pressure in the hydrate formation region. The number of gas bubbles is an important factor for calculating the hydrate formation rate per unit length in an annulus. The gas bubbles are assumed as the volume-equivalent spheres. The number of gas bubbles per unit length in the annulus can be described as
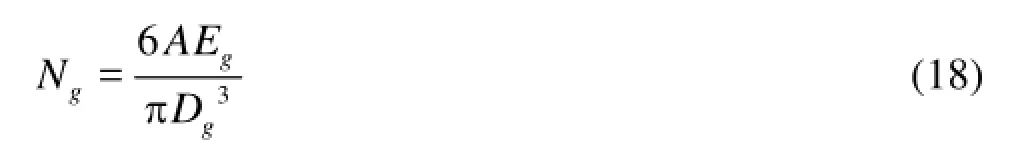
whereNgis the number of gas bubbles of unit length in the annulus andDgis the initial mean diameter of the gas bubbles as they reach the hydrate formation region.
Hinze[15]and Winterton[16]calculated the maximum and mean bubble diameters using the following Eqs.(19) and (20) to determine the diameter range of the gas bubbles when they reach the hydrate formation region in the deepwater well annulus.
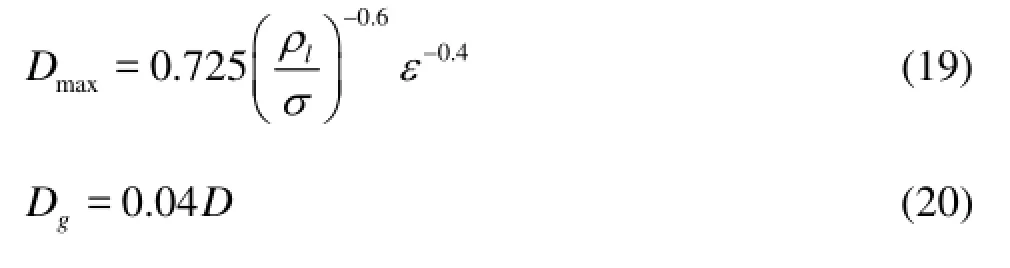
wheremaxDis the maximum bubble diameter,σis the surface tension,εis the energy dissipation rate per unit mass[15], andDis the diameter of the annulus.
The hydrate growth rate for one gas bubble can be calculated using Eqs. (13)-(17). The equation of the hydrate formation rate of unit length in an annulus is as follows
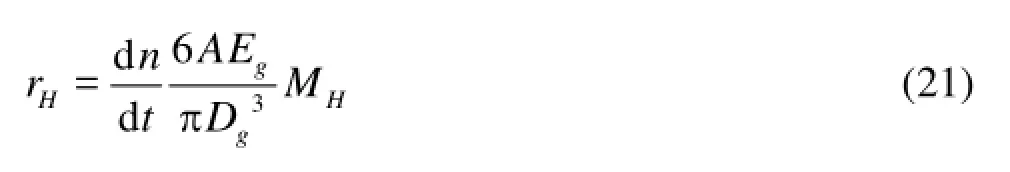
whereHMis the molar weight of the hydrate.
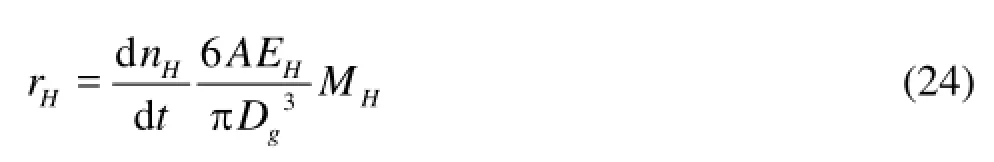
(3) Calculation of the hydrate decomposition rate. Kim et al.[17]proposed a hydrate decomposition dynamic model including the following two parts: (1) the deconstruction process of the cage lattice structure of the hydrate particle surface and (2) the desorption process of guest molecules from the surface. The calculation formulas for the hydrate decomposition rate are as follows:
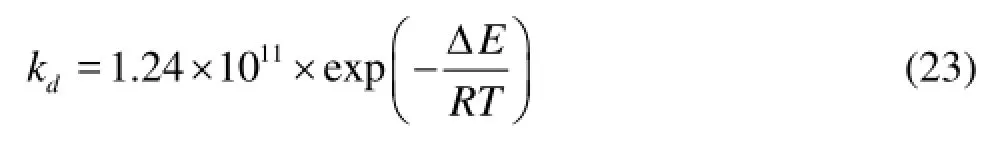
wherenHis the total moles of CH4contained in hydrate particles,Asis the surface area of one hydrate particle, ΔEis the activation energy, 78.3 kJ/mol for CH4,kdis the hydrate decomposition rate constant.
(4) The slip velocity of hydrate particles
The hydrate particles are buoyant due to their low density (e.g., 900 kg/m³ for methane hydrate). The slip velocity of the gas bubbles and the hydrate particles is, according to Zheng and Yapa[18],

wherevTis the slip velocity of the gas bubble or the hydrate particle,μis the viscosity of drilling fluid,ρmis the drilling fluid density,dis the diameter of the gas bubble or the hy drate particle,Ris the Reynolds number and Cliftprovided a correlation forRas
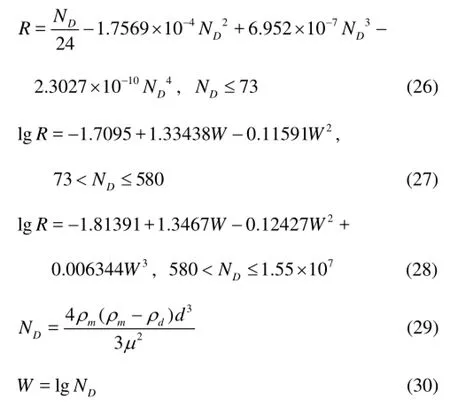
whereρdis the density of the gas bubbles or the hydrate particles.
Equations (24)-(30) can also be applied to calculate the slip velocity between the gas bubble and the hydrate shell whenρdin Eq.(29) is considered as the composite density of the bubbles and the hydrate shell (ρcom). The composite density of the bubbles with the hydrate shell is then
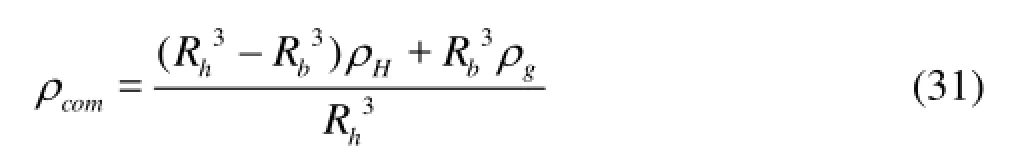
whereρcomis the composite density of the bubble with hydrate shell,Rhis the initial radius of the gas bubble, andRbis the radius of the gas bubble with hydrate shell, which can be calculated easily from the hydrate growth rate.
1.3Conditions of temperature field simulation
(1) Initial conditions. In the drilling process, when the fluid flow state in the annulus changes because of the gas invasion, the initial condition of the transient temperature field is equivalent to the temperature calculated under the steady-state conditions before the gas enters the annulus.
(2) Boundary conditions. The inlet temperature of the drill string can be measured directly as follows
The temperature of the liquid in the drill string is similar to the liquid in the annulus at the well bottom, and can be expressed as

The seawater temperature field can be expressed as

wherehsis some depth in the seawater,Tseais the seawater temperature at the depthhs,T0is the seawater temperature at the surface, andfTseais a function of the seawater temperature.
The formation temperature field can be expressed as
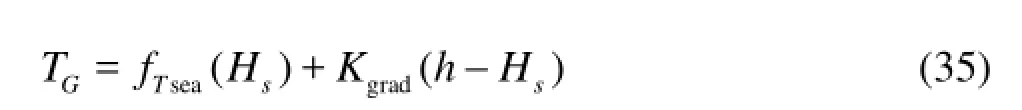
whereTGis the formation temperature at some depth,Kgardis the geothermal gradient.
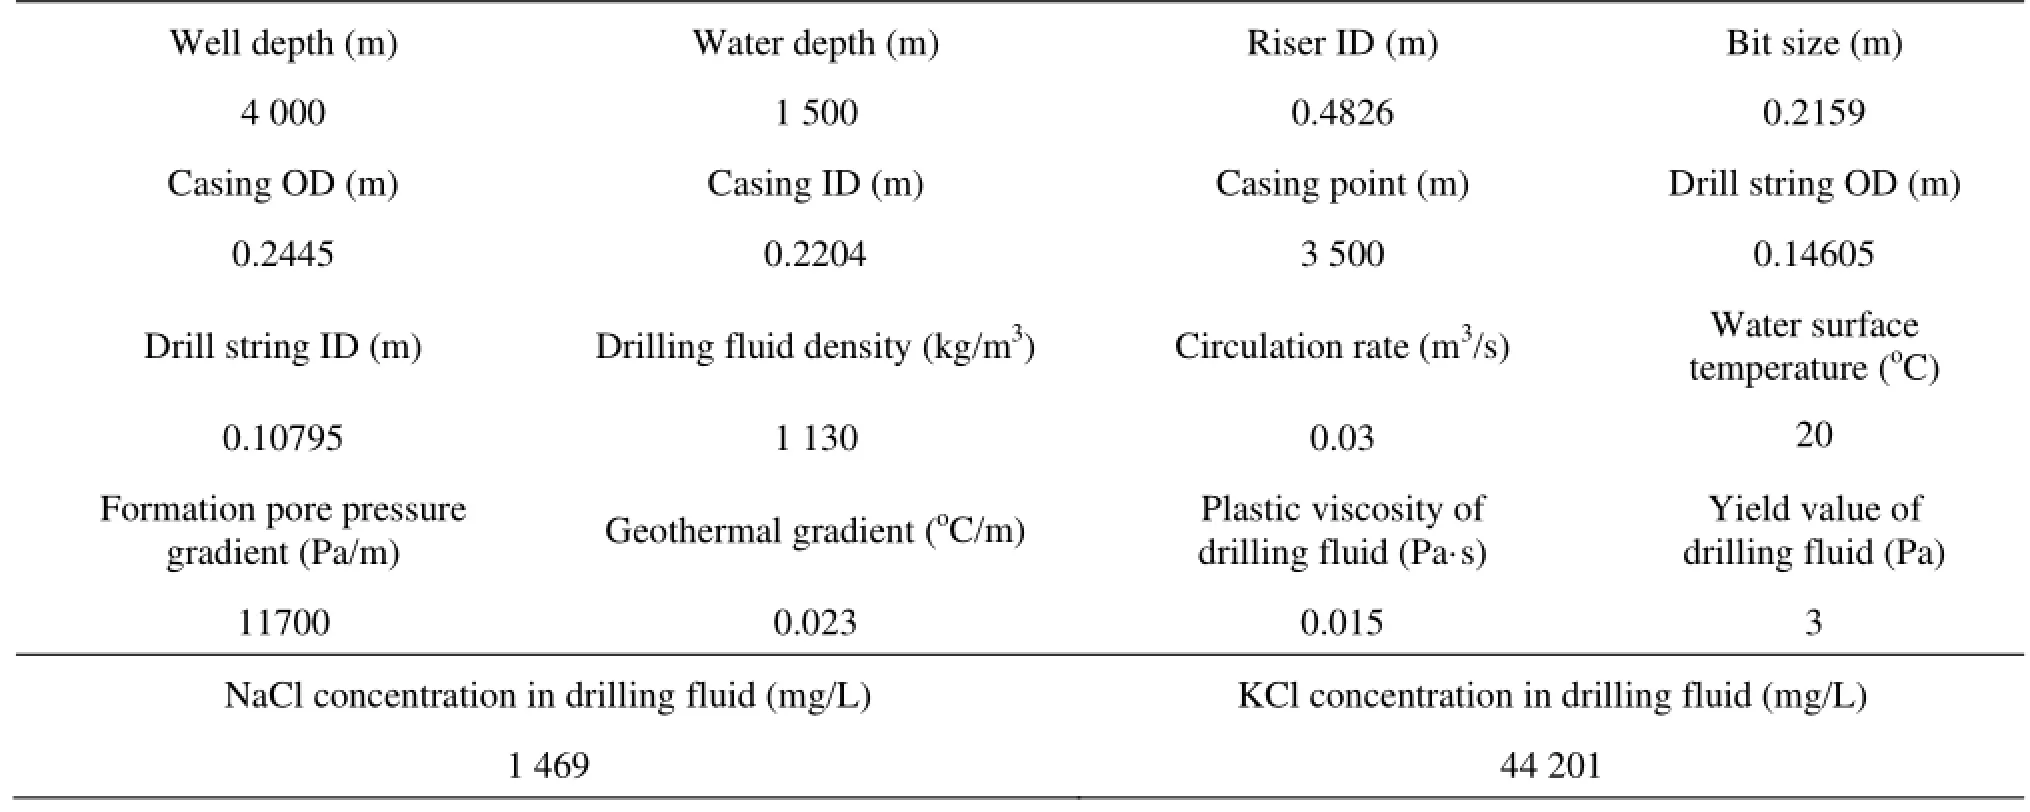
Table 1 Basic data
1.4Conditions of pressure field simulation
(1) Initial conditions. Before the gas enters into the annulus, there are only the drilling fluids in the annulus. Then,
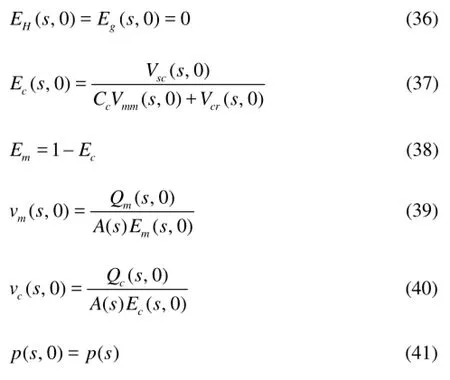
whereVscis the apparent velocity of the cuttings,Ccis the velocity distribution factor,Vmmis the velocity of the mixture,Vcris the slippage velocity of the cuttings,Qmis the drilling fluid circulation rate, andQcis the volumetric flow rate of the cuttings.
(2) Boundary conditions
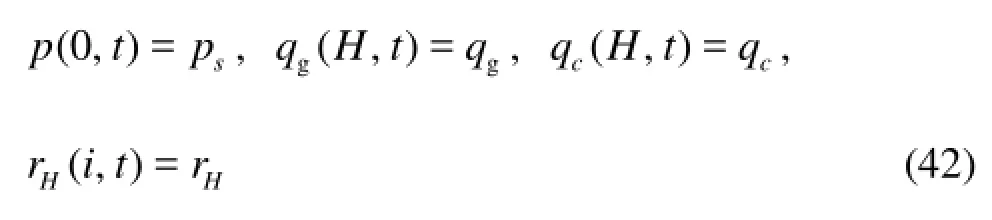
wherespis the casing pressure.
2. Results of the deepwater gas kick simulation with hydrate phase transition
The HG-X well in the South China Sea is used as an example to analyse the influence of the hydrate phase transition on the annulus flow parameters when a deepwater gas kick occurs. The well data are summarized in Table 1. The kick occurs during the drilling process and the invaded gas is methane.
2.1Sensitivity study for bubble diameters
The hydrate formation/disassociation rate is affected by the diameter of bubbles in the gas-liquid mixture because the bubble diameter is related to the gasliquid interface area. The maximum and mean bubble diameters are approximately 0.030 m and 0.009 m in the hydrate formation region, respectively, according to Eqs.(19) and (20). Thus, the gas bubble diameters are assumed in the range of 0.005 m-0.030 m to study the influence of the gas bubble diameter on the gas kick hydraulics, including the gas volume fraction, the pit gain, the bottom hole pressure and the shut-in casing pressure.
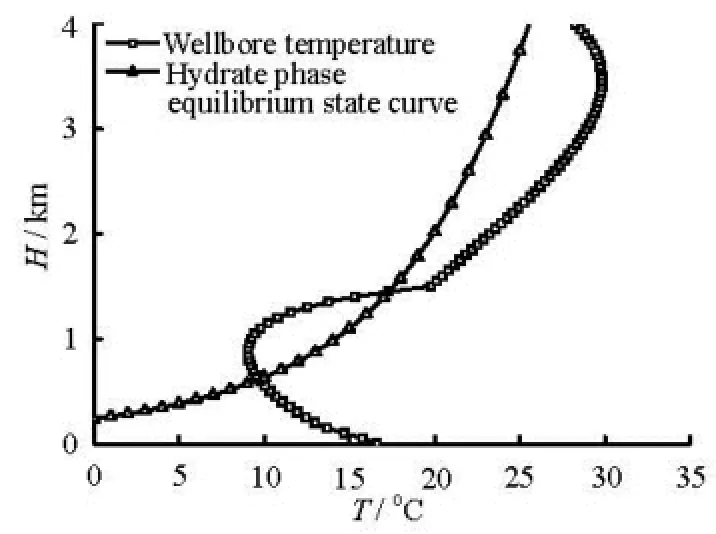
Fig.1 Hydrate formation region in well annulus during drilling
(1) The hydrate formation region in the annulus during the gas kick period. The hydrate formation region in the annulus can be determined from the hydrate phase equilibrium conditions and using the annulus temperature and pressure field calculation method. Figure 1 shows the hydrate formation region in the annulus during drilling for the case with no hydrate inhibitor added into the drilling fluid. The depth range enclosed by the hydrate phase equilibrium and the annulus temperature curves mark the hydrate formation region. In this case, the hydrate formation region is in the range of 600 m to 1 470 m. The temperature difference between the two curves in the closed region at the same depth is equivalent to the overcooled temperature for the hydrate formation. The hydrate formation region becomes larger when the closed region is longer in the vertical direction. On the other hand, the hydrate formation rate increases when the closed region is wider in the lateral direction.
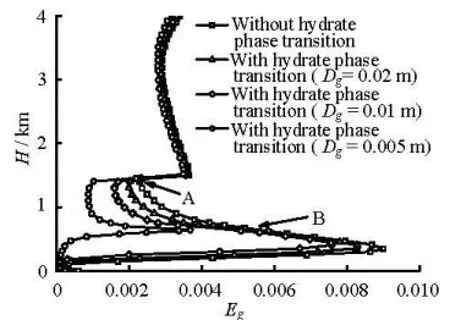
Fig.2(a) Gas volume fraction profiles at 95 min during gas kick
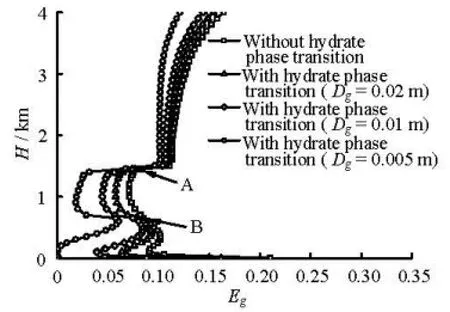
Fig.2(b) Gas fraction profiles at 95 min during gas kick
(2) The influence of the hydrate phase transition on the gas volume fraction during the gas kick period. Figures 2(a) and 2(b) show the gas fraction profiles in the annulus at the gas production rates of 0.15 Nm3/(MPa·s) and 1.0 Nm3/(MPa·s), respectively. The figures show that the gas volume fractions are different in cases with and without consideration of the hydrate phase transition. The influence of the hydrate phase transition on the gas volume fraction increases with the decrease of the average gas bubble diameter (Dg), because the smaller the gas bubbles diameters are at certain gas volume fractions, the larger the gasliquid interface areas will be, consequently, the hydrate formation rate will be increased. As seen in Fig.2(b), the ratios of the gas volume fractions with and without the hydrate phase transition are 0.26, 0.50, 0.62, 0.79, and 0.87 at a depth of 1 000 m and with bubble diameters of 0.005 m, 0.0075 m, 0.01 m, 0.02 m, and 0.03 m, respectively. The gas volume fraction curve has an inflection at points A and B, which are the lower and upper boundaries of the hydrate formation region, respectively. The gas volume fraction decreases when the gas enters the hydrate formation region because of the hydrate formation. Moreover, point A is near the mud line. The cross-sectional area of the riser section above the mud line is larger than the well annulus area. The sudden increase of the cross-sectional area reduces the gas volume fraction. The gas volume fraction increases when the gas leaves the hydrate formation region because of the hydrate disassociation. The hydrate formation would consume large amounts of gas and reduce the annular gas volume fraction, giving the deepwater kicks a “hidden” nature.
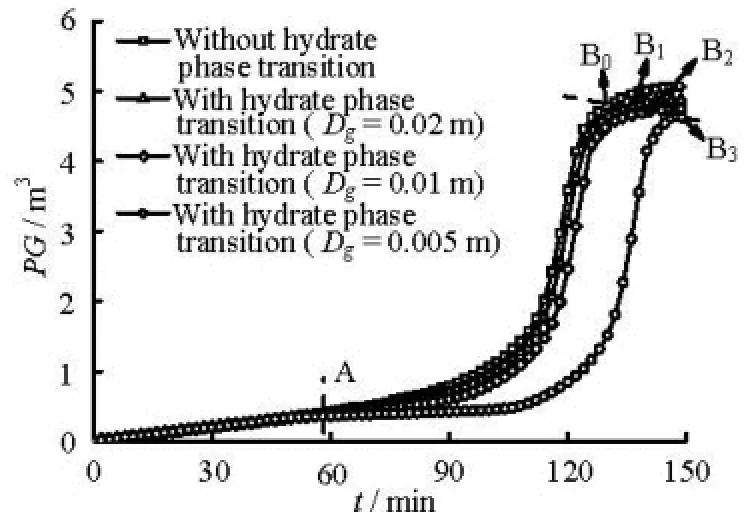
Fig.3(a) Curve of pit gain versus kick time with different gas bubble diameters

Fig.3(b) Curve of pit gain versus kick time with different gas bubble diameters
(3) The influence of the hydrate phase transition on the pit gain during the gas kick period. Figures 3(a) and 3(b) show the pit gain versus the kick time at gas production rates of 0.15 Nm3/(MPa·s) and1.0 Nm3/(MPa·s), respectively. Each pit gain curve can be divided into three parts by points A and Bi(i=0,1,…5). Prior to point A, the invaded gas has not reached the hydrate formation region in the annulus, and thus, the pit gain curves with different bubble diameters are overlapped. When the gas enters the hydrate formation region (between A and Bi), the pit gain curves begin deviate from each other, and the deviation becomes larger over time because the hydrate formation consumes different amounts of gas. After point Bi, the front of the multiphase flow reaches the surface and some gase escapes from the annulus, which leads to the slow pit gain growth. The influence of the hydrate phase transition on the pit gain increases with the decreasing bubble diameter. The hydrate phase transition reduces the pit gain and delays the detection of the well ki3ck. As observed in Fig.3(a), the pit gain reaches 1 m after 98 min when the hydrate phase transition is not considered. On3the other hand, the pit gain takes 124 min to reach 1 m when the average bubble diameter is 0.005 m and the hydrate phase transition is considered. Therefore, the detection of the well kick is delayed by 26 min. The delays in the well kick detection greatly increase the well control risks. Moreover, the hydrate is more likely to be present in an annulus at a low gas production rate than at the high gas production rate when the gas kick is detected by using the pit gain monitoring equipment with certain preci3sions. For example, when the pit gain reaches 1 m, the gas would reach the hydrate formation region as shown in Fig.3(a) but not reach the hydrate formation region as shown in Fig.3(b).
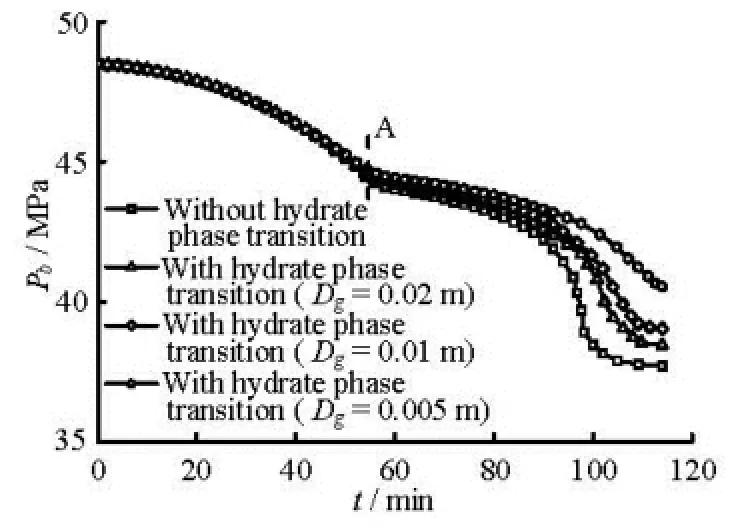
Fig.4 Curve of bottom hole pressure versus kick time with different gas bubble diameters
(4) The influence of the hydrate phase transition on the bottom hole and shut-in casing pressures during the gas kick period. Figure 4 shows the curve of the bottom hole pressure versus the kick time. Figure 5 shows the curve of the shut-in casing pressure versus the kick time for different gas bubble diameters at the gas production rate of 1.0 Nm3/(MPa·s). As observed in these figures, the values of the bottom hole pressure and the shut-in casing pressure are dependent on the hydrate phase transition. The differences between the simulated results with and without the consideration of the hydrate phase transition increase with the decrease of the bubble diameter. The slopes of the curves decrease after point A (approximately 53 min) because the gas front enters the riser after 53 min and the section area of the riser is much larger than that of the annulus below the seafloor. Some wrong decision can be made when the degree of the gas kick or the type of invaded fluid is judged based on the pressure difference between the shut-in casing pressure and the shutin stand pressure because the hydrate phase transition reduces the shut-in pressure.
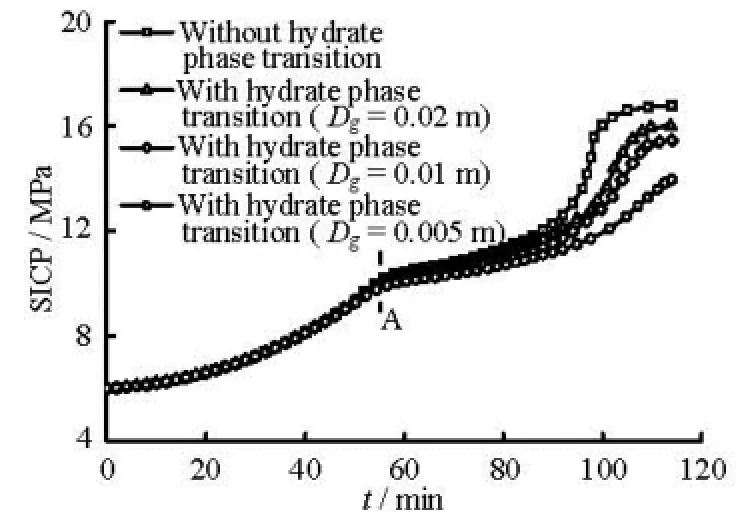
Fig.5 Curve of shut-in casing pressure versus kick time with different gas diameters
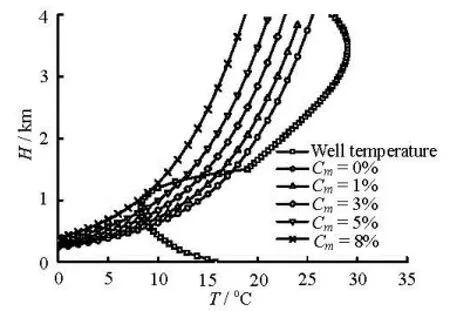
Fig.6 Hydrate formation regions with different methanol concentrations (Cm)
2.2Result analysis of the deepwater gas kick simulations with different hydrate inhibitor concentrations
Methanol is a common hydrate inhibitor. Figure 6 shows the hydrate formation region in the annulus with different methanol weight concentrations (Cm). The hydrate phase curves gradually move downward and the hydrate formation regions become smaller when the methanol concentration increases. Moreover, no hydrate is formed in the annulus when the methanol inhibitor concentration reaches 8% weight concentration. The hydrate formation regions and the hydrate overcooled temperatures decrease with the addition of inhibitors, consequently the hydrate formation ratesare decreased. Figure 7 shows the formation rate of the single bubble (diameter of 0.01 m) with different methanol concentrations (Cm) in the hydrate formation region. The hydrate formation rate decreases with the increase of the methanol concentration. Moreover, the maximum value of the hydrate formation rate with 5% methanol weight concentration is 1/7 of that without inhibitors being added.

Fig.7 The single bubble’s formation rate with different methanol concentrations (Cm), when the bubble diameter is 0.01 m
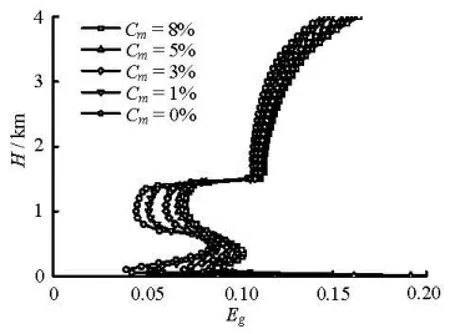
Fig.8 Gas fraction profiles with different methanol concentrations at 95 min during gas kick
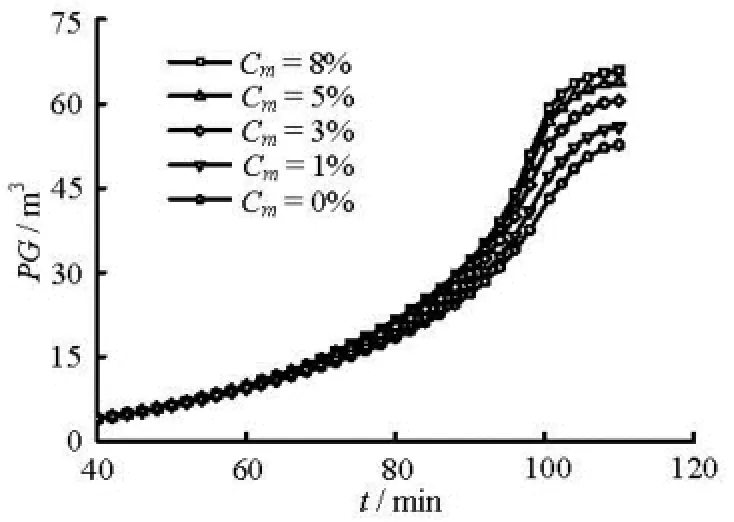
Fig.9 Pit gain versus kick time with different methanol concentrations
The influence of the hydrate phase transition on the gas kick hydraulics, such as the gas volume fraction, the pit gain, is studied when the gas invasion rate is 0.10 Nm3/(MPa·s) and the average bubble diameter is 0.01 m. Figures 8 and 9 show the simulated results. The influence of the hydrate phase on the aforementioned parameters decreases with the increase of the methanol concentration. However, the influence of the hydrate phase transition on the flow parameters disappears when the methanol inhibitor weight concentration reaches 8%. As shown in Fig.8, the maximum overcooled temperature for the hydrate formation, the temperature difference between the annulus temperature curve and the hydrate phase equilibrium state curve (Cm=0) at depth of 1 057 m, is 6.2oC. Using the method proposed by Yamanlar et al.[19], the methanol weight concentration can be calculated as 7.6%, which is very close to the value 8% found in this study.
The effect of the inhibitor concentration on the gas kick hydraulics should be considered in the deepwater gas kick simulations to better understand the deepwater gas kick process and provide guidances for future well control implementations.
3. Conclusions
A simulation model for deepwater gas kicks that accounts for the hydrate phase transition is established. The model is based on the improved annular multiphase flow governing equations and the hydrate phase transition calculation equations. The improved annular multiphase flow governing equations are derived by coupling the hydrate phase transition via adding the hydrate mass conservation equation, the hydrate term in the momentum conservation equation and the enthalpy term for the gas hydrate phase transition in the heat conservation equations. The model can be used quantitatively determine the relationship between the gas kick hydraulic parameters, such as the pit gain, the gas volume fraction, the bottom hole pressure and the shut-in casing pressure, versus the kick time and the impact of some hydrate inhibitor added into the drilling fluid.
In the gas kick process, the gas bubble diameter can significantly influence the hydrate phase transition effect. Both the gas volume fraction in the annulus and the pit gain would be reduced because of the hydrate phase transition, which gives the well kicks in deepwater a “hidden” nature and increases the difficulty of the early detection of gas kicks. The hydrate phase curves gradually move downwards, and the hydrate formation region decreases when the hydrate inhibitor concentration increases. The hydrate overcooled temperature decreases and the hydrate formation rate and the influence of the hydrate phase transition on gas kick hydraulics are decreased. The influence of the hydrate phase transition on the kick parameters disappears when the methanol inhibitor weight concentration reaches 8% in this study.
References
[1] FOSSIL B., SANGESLAND S.. Managed pressure drilling for subsea applications: Well control challenges in deep waters[C]. SPE/IADC Underbalanced Technology Conference and Exhibition, 91633. Houston, Texas, USA, 2004.
[2] NUNES J. O. L., BANNWART A. C. and RIBEIRO P. R. Mathematical model of a gas kick in deep water scenario[C]. IADC/SPE Asia Pacific Drilling Technology. Jakarta, Indonesia, 2002.
[3] AVELAR C., RIBEIRO P. R. and SEPEHMOORI K. Deep-water gas kick simulation[J]. Journal of Petroleum Science and Engineering, 2009, 67(1-2): 13-22.
[4] JOHNNY P., KNUT S. B. and KNUT L. Computing the danger of hydrate formation using a modified dynamic kick simulator[C]. SPE/IADC Drilling Conference. Amsterdam, The Netherlands, 2001.
[5] WANG Z., SUN B. and CHENG H. Prediction of gas hydrate formation region in the well-bore of deepwater drilling[J]. Petroleum Exploration Development, 2008, 35(6): 731-735.
[6] YAPA P. D., ZHENG L. and CHEN F. A model for deepwater oil/gas blowouts[J]. Marine Pollution Bulletin, 2001, 43(7): 234-241.
[7] WANG Z., SUN B. Multiphase flow behavior in annulus with solid gas hydrate considering nature gas hydrate phase transition[J]. Petroleum Science, 2009, 6(1): 57-63.
[8] JIANG G., WU Q. and ZHAN J. Experimental studies of the formation and dissociation of methane hydrate in loess[J]. Journal of Natural Gas Chemistry, 2010, 19(3): 217-223.
[9] FAN S., ZHANG Y. and TIAN G. et al. Natural gas hydrate dissociation by presence of ethylene glycol[J]. Energy Fuels, 2006, 20(1): 324-326.
[10] HAGOORT J. Prediction of wellbore temperatures in gas production wells[J]. Journal of Petroleum Science and Engineering, 2005, 49(1-2): 22-36.
[11] HAGOORT J. Ramey’s wellbore heat transmission revisited. SPE Journal, 2004, 9(4): 465-474.
[12] ZHANG H. Q., WANG Q. and SARICA C. et al. Unified model for gas-liquid pipe flow via slug dynamics-Part 1: Model development[J]. Journal of Energy Resources Technology, 2003, 125(4): 266-273.
[13] JAVANMARDI J., MOSHFEGHIAN M. A new approach for prediction of gas hydrate formation conditions in aqueous electrolyte solutions[J]. Fluid Phase Equilibria, 2000, 168(2): 135-148.
[14] ENGLEZOS P., KALOGERAKIS N. and DHOLABHAI P. D. et al. Kinetics of formation of methane and ethane gas hydrates[J]. Chemical Engineering Science, 1987, 42(11): 2647-2658.
[15] HINZE J. O. Fundamentals of the hydrodynamic mechanism of splitting in dispersion processes[J]. AIChE Journal, 1955, 1(3): 289-295.
[16] WINTERTON R. H. S. A simple method of predicting bubble size in bubble columns[J]. Chemical Engineering and Processing: Process Intensification, 1994, 33(1): 1-5.
[17] KIM H. C., BISHNOI P. R. and HEIDEMANN R. A. et al. Kinetics of methane hydrate decomposition[J]. Chemical Engineering Science, 1987, 42(7): 1645-1653.
[18] ZHENG L., YAPA P. D. Buoyant velocity of spherical and non-spherical bubbles/droplets[J]. Journal of Hydraic Engineering ASCE, 2000, 126(11): 825-854.
[19] YAMANLAR S., POETTMANN F. H. and SLOAN E. D. Control hydrate formation[J]. Hydrocarbon Processing, 1991, 70(9): 155-161.
10.1016/S1001-6058(14)60011-1
* Project supported by the National Natural Science Foundation of China (Grant No. 51104172), the National Science and Technology Major Project of China (Grant No. 2011ZX05026-001) and the National High Technology Research and Development Program of China (863 Program, Grant No. 2013AA09A215).
Biography: WANG Zhi-yuan (1981-), Ph. D.,
Associate Professor
猜你喜欢
大众文艺(2022年24期)2023-01-09
Chinese Physics B(2022年11期)2022-11-21
心声歌刊(2022年1期)2022-06-06
Chinese Physics B(2022年4期)2022-04-12
电影文学(2021年17期)2021-10-14
快乐作文(1.2年级)(2021年2期)2021-09-10
作文评点报·低幼版(2020年42期)2020-12-14
Chinese Physics B(2019年6期)2019-06-18
小学生作文·小学低年级适用(2016年1期)2016-03-07
学周刊(2015年1期)2015-07-09

- 水动力学研究与进展 B辑的其它文章
- An ocean circulation model based on Eulerian forward-backward difference scheme and three-dimensional, primitive equations and its application in regional simulations*
- Detrended analysis of Reynolds stress in a decaying turbulent flow in a wind tunnel with active grids*
- Estimation of discharge and its distribution in compound channels*
- Influences of soil hydraulic and mechanical parameters on land subsidence and ground fissures caused by groundwater exploitation*
- A hybrid DEM/CFD approach for solid-liquid flows*
- Scale analysis of turbulent channel flow with varying pressure gradient*